Euro can rebound down from resistance line and continue fallHello traders, I want share with you my opinion about Euro. Looking at the chart, we can see how the price a not long time ago started to rise inside the upward channel, where firstly it declined to the 1.0780 resistance level, which coincided with the seller zone. Soon, the price broke this level and declined to support line of the channel, after which EUR at once rebounded and made an upward impulse to the resistance line of the channel, breaking the 1.0780 level one more time. Next, the price some time traded near, but later Euro turned around and started to decline inside the downward channel, leaving the past channel. In the downward channel, EUR fell to the support level, which coincided with the buyer zone, breaking the 1.0780 resistance level also. After this, the price bounced from the 1.0620 level and tried to rise, but declined to the buyer zone, which a not long time rebounded up to the resistance line of the channel, making a fake breakout. At the moment, I think that the Euro can rebound down from the resistance line, break the support level, and continue to decline in a downward channel. For this reason, I set my target at the 1.0500 level. Please share this idea with your friends and click Boost 🚀
Upward

GOLD to reach 2082 soonOn the 30-min chart
Gold is projected to reach 2082 soon, then a slight correction, then a journey upwards.
RSI and MACG are supporting this view.

Coinbase UPdateBullish Divergence on the weekly time frame (annual time frame) indicating a run for the next 4 months.
Oversold stochastic
Market exhaustion on the RSI, also showing bullish divergence.

Divergence on Petronet Weekly ChartThe weekly chart analysis suggests a potential upward movement. The 14-day stochastic oscillator has reversed from the oversold zone, indicating a momentum shift. Price found support at 220 level. A fresh divergence on the chart adds to the indication of an upcoming upward trend.
Buy at Market, Target at 235, Stop Loss at 218

BWA: 6% upward potential to current HH 🐂 Trade Idea: Long - BWA
🔥 Account Risk: 1.00%
📈 Recommended Product: Knockout
🔍 Entry: +/- 48.28
🐿 DCA: No
😫 Stop-Loss: 45.29 (46.67 for aggressive trade)
🎯 Take-Profit #1: 51.05 (50%)
🎯 Take Profit #2: -
🎯 Trail Rest: Yes
🚨🚨🚨 Important: Don’t forget to always wait for strong confirmation once possible entry zone is reached. Trade ideas don’t work all the time no matter how good they look. Do not get a victim of FOMO, there is always another trade idea waiting. 🚨🚨🚨
If you like what you see don’t forget to leave a comment 💬 or smash that like ❤️ button!
—
BorgWarner is in a larger uptrend and currently finished its consolidation to the former HH (higher high), doing a liquidity grab there, and closed yesterday above it’s last LH (lower high) above the consolidation downtrend. We therefore assume that BorgWarner will at least test its current HH from the larger uptrend with possible upward potential from there.
This trade is based on price action alone.
—
Disclaimer & Disclosures pursuant to §34b WpHG
The trades shown here related to stocks, cryptos, commodities, ETFs and funds are always subject to risks. All texts as well as the notes and information do not constitute investment advice or recommendations. They have been taken from publicly available sources to the best of our knowledge and belief. All information provided (all thoughts, forecasts, comments, hints, advice, stop loss, take profit, etc.) are for educational and private entertainment purposes only.
Nevertheless, no liability can be assumed for the correctness in each individual case. Should visitors to this site adopt the content provided as their own or follow any advice given, they act on their own responsibility.

TSLA to Continue Cruising Tesla is set to continue cruising upward despite strong sell indicators arising and constantly failing. Tesla is defying the odds in this hot market and with news of the $7500 tax credit for owning a Tesla automobile, the stock will only further rise. Fundamentals can impact trading to a point where the technicals are useless. The debt ceiling deal bull run is also in effect and should be simmering down this week.

DOW Jones to push upwards to resistance zone at 33690Price trends upwards to test the resistance zone at 33690. About 190 points can be made with this move.

EURUSDNow the market has retest the support zone showing reject on suppurt and confirming the weak of bearish, as i am patient waiting for structure to been form pushing up
and breaking resistance zone waiting for a retest on resistance zone so that i have a clear confirm is a buy. as well my trend line shows the upward trend.

XAUUSD CAN SHOW BIG BREAKOUT!Hi investors! afterwatching today's technicals, I concluded that, chart can show big breakout towards upside or downward !! A/C to me considering some fundamentals of todays market/world conditions & upcoming world recession, XAUUSD can FLY !!!!
LOOKING FOR BETTER POSITIONING.

Bitcoin Bullish Trend SignalAs you see in the chart, there is a purple bearish trend line and there are 3 red horizontal lines.
The Purple trendline is based on two pivots on days of 30th of March and 10th of November. And the red horizontal lines indicate top and bottom of Trading range that has been made in the past few weeks and the dotted one is showing top of the smaller trading range inside the big one.
I am noticing the first sign of the trend reversal in btc, and that is it has broken the purple trendline and after a nice pullback, has started to rise up.
I am expecting btc to continue to rise in the following days and see two major Resistance up on it's way, which are the two tops of the past trading range.

BCH - Trading Ranges To OvercomeWe obviously fell a lot with BCH, but still price did not broke any multi year supports, set back in 2018. With such fall those yearly price gabs were closed and i am very positive that the bottom is in for BCH and other crypto.
There is gonna be plenty of resistances back to the top. Those resistances are trading ranges or price areas where larger trading volumes have occurred. It is where i expect that price can pause out and start ranging for a while. First we need to get out of the first (orange) price range and visit a second (blue) range. I expect that once we really start going we should be there really fast just because there are a ton of shorts in the market right now and shortsqueeze can happen easily.
As for the 3rd price range ...I still think that we will go to the third trading range nd even .618 fib. retracement level (green arrow), but before that, price will probably have to work out lower between 2nd and 1st trading range before continuation upwards. I can be really wrong. No one knows really. it is a speculation based on historical price behavioral.
I am not a financial advisor so non of this should be taken as a financial advise. Be well.

EUR/USD upward trend The trend is still breaking all the resistance levels, with this momentum, I think the price will break the next resistance at 1.0200.

USD/CAD breaks the bearish structure-breaking bearish channel
-break the main resistance
-Confirm the upward trend
-momentum
-technical indicators
-fundamental analysis

The possibility of an upward movement for #cadchfhello guys!
in my opinion, this pair (#cadchf) started a new bullish trend from a strong support level (level=0.73602) and on that level formed a head and shoulders pattern so it confirmed a new bullish trend too, on the other hands, the last supply kink engulfed easily ( i mean range of 0.7525-0.7545) so everything is ready for another upward movement until 0.76150!
i hope you be profitable and thank you for your attention!
please like and follow!

GMT - USDT Can Go HigherHi traders, as can be seen from the daily chart there are good bullish signals for this pair although overall the market still remains strongly bearish. First we see that the MA50 has been broken and the price right now uses it as a support. Second, there is a large bullish divergence in the RSI. In conclusion it is possible to see that after the first impulse from the 0.55 area, the price is now in a range that could with a good probability break up.
Not a financial advice!

BTCUSDT potential Head and ShoulderBTCUSDT potential inverted Head and Shoulder in a expected swing upward on this bullish oversold momentum. Pinbar bottom daily formation.

It's Going UpThis is called an upward channel. It's upward because the trend lines are pointing up. It's a channel because the support and resistance trendlines are parallel.

Tesla, Long trade, target R1-R2 $1021-$1039Technical Analysis
Frame 30 minutes is showing some good reasons to go in long trade for tomorrow.
RSI 8, Ma 8, are in 60%, the prices are over the BB 20 basis, $999.46.
But there is another signal, showing the prices will drop at the end of the day. So, it is important to take the profits and set the positions to go in short trade as soon the signals change to downward.
The results, of the Intraday Strategy. Pivot levels
R3 1,063.35
R2 1039.13
R1 1,021.84
PP 997.62
S1 980.33
S2 956.11
S3 938.82

SPX500, Intraday strategy, Pivot point (PP) $4,391.23Hey there, if you are waiting for buying, this could be an interesting strategy, considering the pivot point ( PP ), support (S1,S2,S3), and resistances (R1,R2,R3)
For the next 3 days, we could have an upward. Let's take a look at these band's results, intraday strategy
Target R1 $4,391.23 until R2 $4,461.83, controlling the stop loss at S1 $4,322.27 or S2 $4,320.63
R3 4,532.43
R2 4,461.83
R1 4,392.87
PP 4,391.23
S1 4,322.27
S2 4,320.63
S3 4,250.03

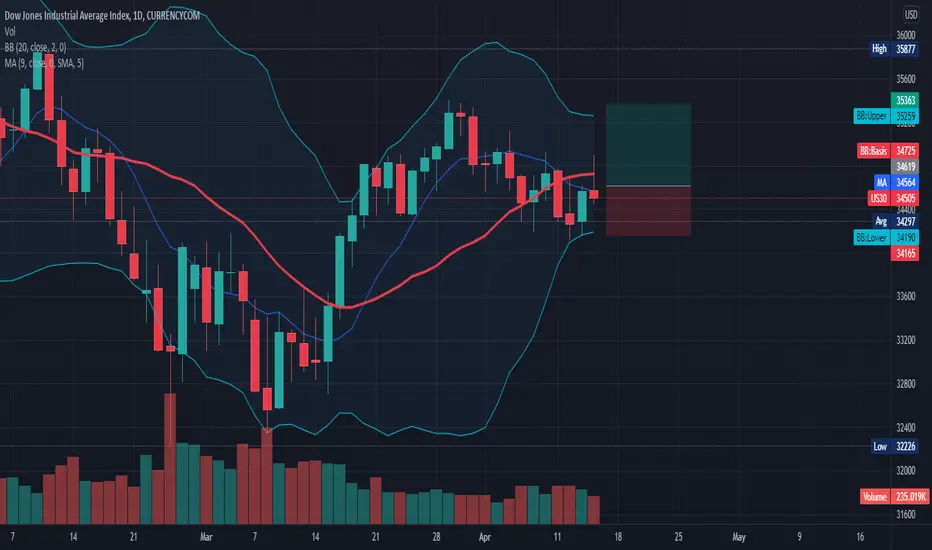
US30, intraday strategy, Pivot point (PP) $34,619.33Hey there, if you are waiting for buying, this could be an interesting strategy, considering the pivot point ( PP ), supports (S1,S2,S3), and resistances (R1,R2,R3)
For the next 3 days, we could have an upward. Let's take a look at these band's results, intraday strategy
Target R2 $35,070 until R3 $35,521, controlling the stop loss at S1 $34,336 or S2 $34,168
R3 35,521.33
R2 35,070.33
R1 34,787.67
PP 34,619.33
S1 34,336.67
S2 34,168.33
S3 33,717.33
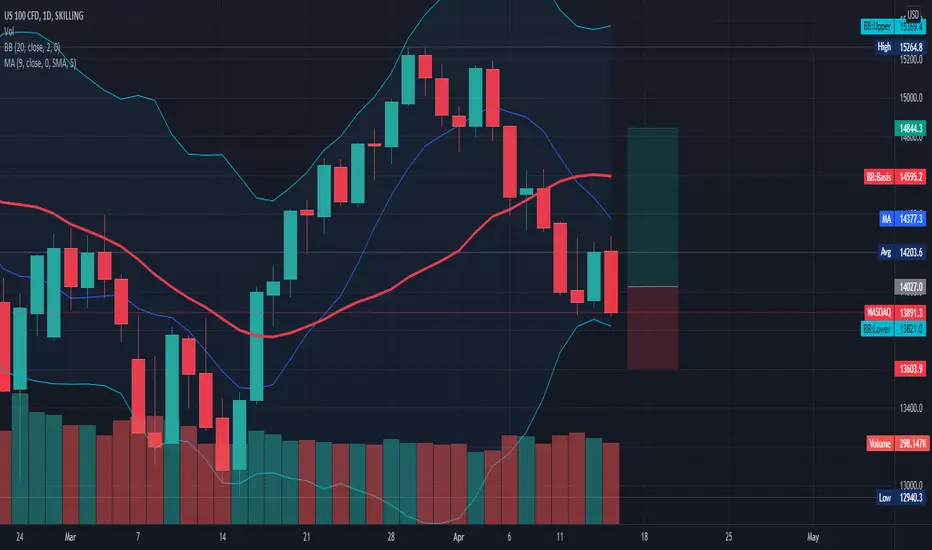
NASDAQ, intraday strategy, Pivot point (PP) $14,018Hey there, if you are waiting for buying, this could be an interesting strategy, considering the pivot point ( PP ), support (S1,S2,S3), and resistances (R1,R2,R3)
For the next 3 days, we could have an upward. Let's take a look at these band's results, intraday strategy
Target R2 $14,432 until R3 $14486, controlling the stop loss at S1 $13,747.97 or S2 $13,604.63
R3 14,846.03
R2 14,432.23
R1 14,161.77
PP 14,018.43
S1 13,747.97
S2 13,604.63
S3 13,190.83"
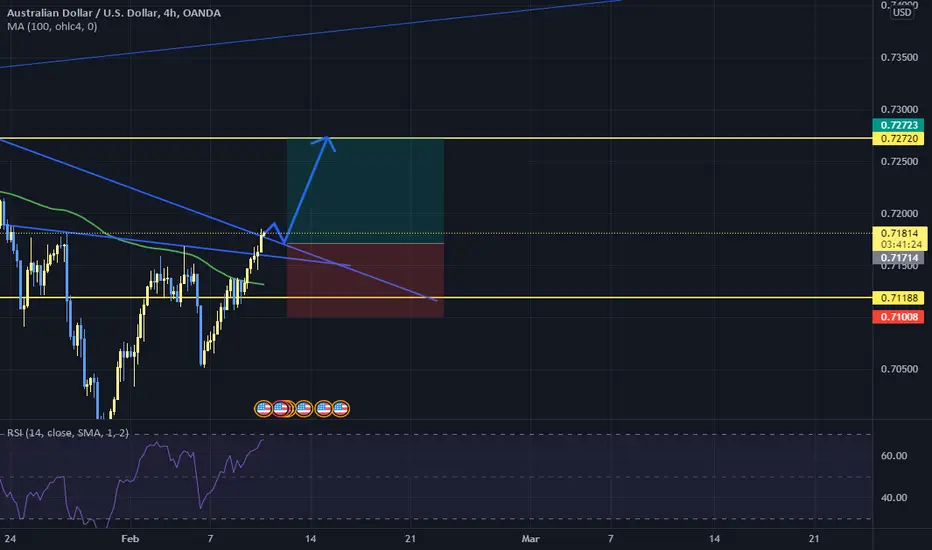
AUDUSD upward momentumAUDUSD broke a downtrend we can enter a buy position with the targets shown on chart
EURCHF upward momentumI see inverted HEAD AND SHOULDERS ob 4h chart soo we ay go up if we broke the neckline and the target is shown on the chart
