CARBON FREE ENERGY IS ABOUT TO BE EXPENSIVE This is a simple story of clean energy and a Canadian firm
Countries such as JAPAN, THE USA, RUSSIA, UK, and FRANCE pushing for nuclear-produced hydrogen.
Nuclear power demand raised from 2% to 2.6 which supply capacity is expected to shrink through 2050.
If you have been following the Uranium market by now you probably know of Sprott asset management active uranium purchases in the spot market with reportedly over $1 billion in assets.
Even though right now governing bodies are monitoring "Sprott" buying activity but "it's nothing that's worrying them at this point" --- This is from a well-written article by J.HOLMAN from S&P Market intelligence
OUR OPINION
Little or no regulatory interference will push prices higher
Nuclear stocks are the next explosive stocks since cannabis and blockchain
Could also see prices of Metal commodities and large manufacturing firms see an increase in demand/ strength in business and positive earnings
Nuclear Waste Management spike in revenue and growth into the business venture long-term
It's HERE AND CHEAP why not just BUY?
URA
URA to the Moon (Uranium)Uranium will be entering a breakout over the coming years.
Demand for energy will skyrocket as problems began to surface in current infrastructure.
The technology has advanced by leaps and bounds. Going Nuclear will continue to be the narrative driving Uranium demand and mining companies.
See you in the future of energy.

$URA Target 22.49 Analysis & Key Levels$URA Target 22.49 for 13.59%
I don’t have a position here yet but I’m just looking what to get into next week… Feeling bullish on URA - and I’d love to see it get above the 50MA and then I’m in…

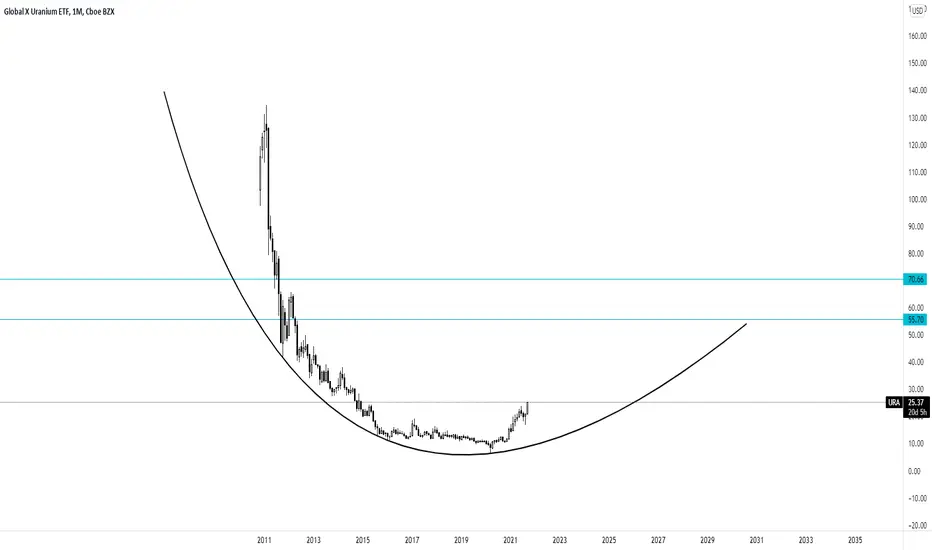
$URA - Uranium ETF - we have liftoffThe Global X Uranium ETF (URA) provides investors access to a broad range of companies involved in uranium mining and the production of nuclear components, including those in extraction, refining, exploration, or manufacturing of equipment for the uranium and nuclear industries.
Breaking downtrend which has been in place for the last 2 months. Looks like this is ready for its next leg higher.. (MACD also crossing up)

Blue Sky UraniumBSK, which is a high beta play for anyone wishing to get exposure to uranium stocks, seems to lag the index.
While already been a stock offering a high risk-return tradeoff, this short-term lag offers a good opportunity to enter this market as, if the correlations persists, BSK should soon catch up with its peers.

Extremely bullish pattern for Uranium StocksUranium stocks, hit by a decade long decline of uranium prices, are now strongly reversing like many other commodities.
While one can use Uranium ETFs to get a long exposure, I prefer junior companies (which offer a better risk-return trade-off in my opinion), such as $BSK.
*Disclaimer: I'm long BSK for more than a year

Cameco CCJ 25 to 30 on this movewant to stay above 15.4. think good risk reward here.
not financial advice

URA- WORLD CRISIS
I personally feel it would be a perfect time to get some URA, A war is on its way there is a revolution, an uprising
LAST CHAPTERS OF REVALUATIONS ARE COMING TRUE
And the word of the LORD came to me saying, “Son of man, set your face toward Gog of the land of Magog, the prince of Rosh, Meshech and Tubal, and prophesy against him and say, ‘Thus says the Lord God, “Behold, I am against you, O Gog, prince of Rosh, Meshech and Tubal. I will turn you about and put hooks into your jaws, and I will bring you out, and all your army, horses and horsemen, all of them splendidly attired, a great company with buckler and shield, all of them wielding swords; Persia, Ethiopia and Put with them, all of them with shield and helmet; Gomer with all its troops; Beth-togarmah from the remote parts of the north with all its troops – many peoples with you.
— Ezekiel 38:1–6


☢️ UUUU launch soon?Last month breakout of the multi-year base since 2015, retraced 0.382 today and bounce off immediately -- expect 🚀 in following months

Cameco break over top and playing with resistance OK setup right now for a move to 16. If we do get 15+, the next correction will be the best setup to buy if it presents and then we will start wave 3 of 3 of 3 not financial advice

CCJ Cameco: Channeling?Above it, followed by retest and resumption, will result in a parabolic move.
Still has that gap to fill, will result in some soiled underwear if it were to happen rapidly. Flagging out until April.... boring but... w/e
I haven't been charting for very long, but let me know if my comments below are stupid.
CCJ Daily Chart Divergences usually lead to a LT trend. (I'm very intrigued by this... when I find a stock that behaves like this)
2000: May-August. See the divergences and all three trending upward, especailly in July
2002: Summer to Fall. MACD like a slingshot, RSI ascending lows contradicting the two valleys in the candles
2010-2011: RSI and MACD pulling on the candles between November 10' and Feb 11' but specifically RSI and STOCH early FEb to Mid Feb. Then fundamentals kicked in: earthquake.
2020: Mid Oct to Early Nov (this is the divergence that I think sent CCJ up the channel for a long time)
Still learning.

Power Up WorldWith the Vaccine soon to be Online this Chart is looking Fantastic. Covid Has put a Hurting on mines and production is gonna be in Full demand The worlds Power plant are in Great need Uranium.
So with some Volume Short term and long term Macro Chart Look like they are Warming up double Bottom cup Formation Handel to Lift off like to enter somewhere near 12.60 on volume

Camejo (NYSE) daily chartprimed for a break out here. Cyclical uranium bull market forming. $CCO.CA $URA

Cameco (NYSE) Monthly chartbeen watching the uranium sector for a while. looks primed for another cyclical uptrend. $URA $URNM . no pos

Cameco CCJHit the top of my wave C target ~9 to ~8. Leaning bearish right now but can see bullish scenario if we take out ~10.5 and then a buying opportunity hopefully presents itself.


URA Medium term trade 45% profit targetPrices of Uranium equities are cheap in general, so its a good long term investment. For the medium term, im targeting 17.50 (my entry point was @10.8 but I still think 11.9 is a good price


Very bullish price action on this uranium stockThis stock is testing a 3 year trend line on the weekly time frame while building a strong 12 month base at the .15 cent level. That is bullish. Some may argue it has already broken out, but from my vantage point, it will sometime in the next week or two.


COLD WAR 2.0 / WW3 / NUCLEAR HOLOCAUST investingThis is what a market bottom could look like.
Currently some nice rsi bullish div. Looking like it is in a bull flag. Appear to have had our capitulatory move. Fundamentally speaking we are working our way to the end of the world so we can see a catalyst like a nuclear arms race or world war breaking out. Is this chart the hourglass for humanity?
If we break the green line and can close above $11.74 this is my buy signal and the hour glass will begin.
Stop loss will be if we break the low at $10.
10% risk for possible 10x reward IMO.
Significant levels are the white lines.
Doomsday clock in a chart.
Like and follow if you don't wanna die.
G-D HELP US
