Sonos - All about the Base (Pattern)US CPI NUMBER TODAY - EXPECT EXTREME VOLATILITY
Sonos Inc - Medium Term - We look to Buy a break of 18.33 (stop at 16.59)
Price action looks to be forming a bottom. Broken out of the Head and Shoulders formation to the upside. Bespoke resistance is located at 18.28. A break of 18.28 is needed to confirm follow-through bullish momentum. Although the anticipated move higher is corrective, it does offer ample risk/reward today.
Our profit targets will be 22.76 and 24.50
Resistance: 18.28 / 21.30 / 22.76
Support: 16.33 / 15.17 / 14.85
Please be advised that the information presented on TradingView is provided to Vantage (‘Vantage Global Limited’, ‘we’) by a third-party provider (‘Signal Centre’). Please be reminded that you are solely responsible for the trading decisions on your account. There is a very high degree of risk involved in trading. Any information and/or content is intended entirely for research, educational and informational purposes only and does not constitute investment or consultation advice or investment strategy. The information is not tailored to the investment needs of any specific person and therefore does not involve a consideration of any of the investment objectives, financial situation or needs of any viewer that may receive it. Kindly also note that past performance is not a reliable indicator of future results. Actual results may differ materially from those anticipated in forward-looking or past performance statements. We assume no liability as to the accuracy or completeness of any of the information and/or content provided herein and the Company cannot be held responsible for any omission, mistake nor for any loss or damage including without limitation to any loss of profit which may arise from reliance on any information supplied by Signal Centre.
US

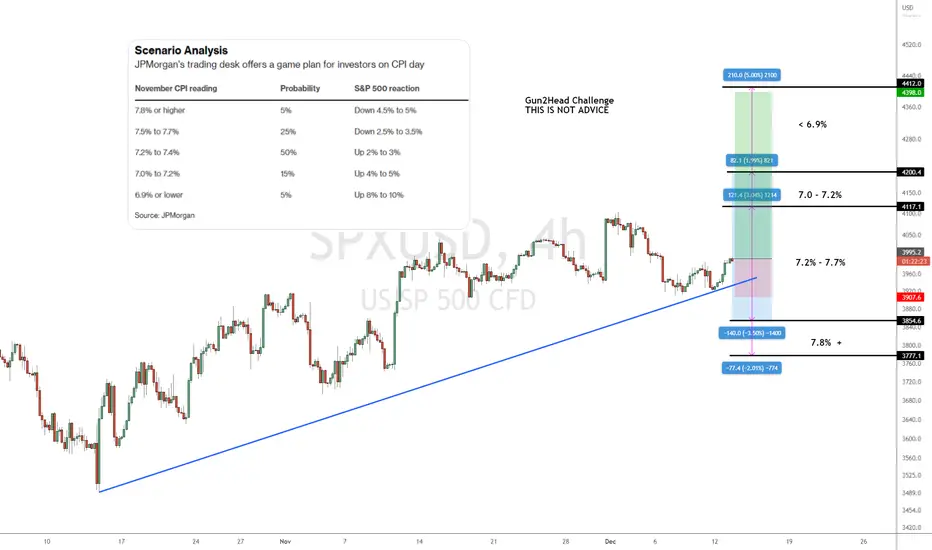
Joe Gun2Head Trade - Crazy move higher on a weaker CPI number?Trade Idea: Buying SPXUSD
Reasoning: Crazy move higher on a weaker CPI number?
Market expects 7.3%. JPMorgan suggesting a move of <6.9% could see stocks rally by 8-10%?"
Entry Level: 3993
Take Profit Level: 4398
Stop Loss: 3907
Risk/Reward: 4.6:1
Disclaimer – Signal Centre. Please be reminded – you alone are responsible for your trading – both gains and losses. There is a very high degree of risk involved in trading. The technical analysis , like all indicators, strategies, columns, articles and other features accessible on/though this site is for informational purposes only and should not be construed as investment advice by you. Your use of the technical analysis , as would also your use of all mentioned indicators, strategies, columns, articles and all other features, is entirely at your own risk and it is your sole responsibility to evaluate the accuracy, completeness and usefulness (including suitability) of the information. You should assess the risk of any trade with your financial adviser and make your own independent decision(s) regarding any tradable products which may be the subject matter of the technical analysis or any of the said indicators, strategies, columns, articles and all other features.
Footlocker - Stomping lower?Foot Locker - Medium Term - We look to Sell at 38.81 (stop at 40.86)
Trading within a Bearish Channel formation. Price action continued to range between key support & resistance (30.02 - 40.00) although we expect a break of this range soon. Short term momentum is bearish. Preferred trade is to sell into rallies.
Our profit targets will be 30.34 and 24.10
Resistance: 38.81 / 40.20 / 45.59
Support: 37.88 / 33.19 / 30.02
Please be advised that the information presented on TradingView is provided to Vantage (‘Vantage Global Limited’, ‘we’) by a third-party provider (‘Signal Centre’). Please be reminded that you are solely responsible for the trading decisions on your account. There is a very high degree of risk involved in trading. Any information and/or content is intended entirely for research, educational and informational purposes only and does not constitute investment or consultation advice or investment strategy. The information is not tailored to the investment needs of any specific person and therefore does not involve a consideration of any of the investment objectives, financial situation or needs of any viewer that may receive it. Kindly also note that past performance is not a reliable indicator of future results. Actual results may differ materially from those anticipated in forward-looking or past performance statements. We assume no liability as to the accuracy or completeness of any of the information and/or content provided herein and the Company cannot be held responsible for any omission, mistake nor for any loss or damage including without limitation to any loss of profit which may arise from reliance on any information supplied by Signal Centre.

Joe Gun2Head Trade - GBPUSD grinding higher?Trade Idea: Buying GBPUD
Reasoning: Grinding higher
Entry Level: 1.2239
Take Profit Level: 1.2334
Stop Loss: 1.2196
Risk/Reward: 2.19:1
Disclaimer – Signal Centre. Please be reminded – you alone are responsible for your trading – both gains and losses. There is a very high degree of risk involved in trading. The technical analysis , like all indicators, strategies, columns, articles and other features accessible on/though this site is for informational purposes only and should not be construed as investment advice by you. Your use of the technical analysis , as would also your use of all mentioned indicators, strategies, columns, articles and all other features, is entirely at your own risk and it is your sole responsibility to evaluate the accuracy, completeness and usefulness (including suitability) of the information. You should assess the risk of any trade with your financial adviser and make your own independent decision(s) regarding any tradable products which may be the subject matter of the technical analysis or any of the said indicators, strategies, columns, articles and all other features.

Downward Dollar Trend
The Dxy is following a downward channel, looking for the dxy to continue this trend and looking a short for this week.

LOOKS LIKE DXY IS READY TO REVERSEIt has appeared that a left shoulder has formed, as well as a head, wait for market to break in, close, retest then take the sell opportunity..

Time to pull the PLUG?Plug Power - Short Term - We look to Sell at 14.94 (stop at 16.92)
The medium term bias remains bearish. A break of the recent low at 13.68 should result in a further move lower. The sequence for trading is lower lows and highs. The continuation lower in prices through support has been impressive with strong momentum and shows no signs of slowing. Preferred trade is to sell into rallies.
Our profit targets will be 8.01 and 7.50
Resistance: 13.68 / 14.96 / 18.26
Support: 12.70 / 11.90 / 10.92
Please be advised that the information presented on TradingView is provided to Vantage (‘Vantage Global Limited’, ‘we’) by a third-party provider (‘Signal Centre’). Please be reminded that you are solely responsible for the trading decisions on your account. There is a very high degree of risk involved in trading. Any information and/or content is intended entirely for research, educational and informational purposes only and does not constitute investment or consultation advice or investment strategy. The information is not tailored to the investment needs of any specific person and therefore does not involve a consideration of any of the investment objectives, financial situation or needs of any viewer that may receive it. Kindly also note that past performance is not a reliable indicator of future results. Actual results may differ materially from those anticipated in forward-looking or past performance statements. We assume no liability as to the accuracy or completeness of any of the information and/or content provided herein and the Company cannot be held responsible for any omission, mistake nor for any loss or damage including without limitation to any loss of profit which may arise from reliance on any information supplied by Signal Centre.

DXY just need a little restDxy is backing down for a new pair of jordan. All is to run faster and jump higher. Here is the level I expected.

Bank of America - Extending higher from the bullish flagBank of America Corp - Short Term - We look to Buy at 37.17 (stop at 35.28)
Posted a Double Bottom formation. Prices are extending higher from the bullish flag/pennant formation. The formation has a measured move target of 44.30. Further upside is expected although we prefer to set longs at our bespoke support levels at 37.17, resulting in improved risk/reward.
Our profit targets will be 44.30 and 48.82
Resistance: 38.60 / 40.37 / 43.75
Support: 37.15 / 36.20 / 32.63
Please be advised that the information presented on TradingView is provided to Vantage (‘Vantage Global Limited’, ‘we’) by a third-party provider (‘Signal Centre’). Please be reminded that you are solely responsible for the trading decisions on your account. There is a very high degree of risk involved in trading. Any information and/or content is intended entirely for research, educational and informational purposes only and does not constitute investment or consultation advice or investment strategy. The information is not tailored to the investment needs of any specific person and therefore does not involve a consideration of any of the investment objectives, financial situation or needs of any viewer that may receive it. Kindly also note that past performance is not a reliable indicator of future results. Actual results may differ materially from those anticipated in forward-looking or past performance statements. We assume no liability as to the accuracy or completeness of any of the information and/or content provided herein and the Company cannot be held responsible for any omission, mistake nor for any loss or damage including without limitation to any loss of profit which may arise from reliance on any information supplied by Signal Centre.

US Dollar Currency Index (DXY)US Dollar Currency Index (DXY)
1W hollow candlesticks
After an ATH (All-Time High), the US Dollar Index appears to be finding its first major support area, which occurs from the golden ratio of the Fibonacci Retracement sequence.
Two triangles are formed, two ascending triangles.
In the first triangle, the breakout will occur at the end of 2022.
Certainly from the new year, it is most likely to break the Resistance area, located at 103.650, as it will then enter the second smaller triangle.
Towards the end of 2023 or even earlier, seems to be the next support area, which is clearly seen by the extension of a second Fibonacci Retracement.
The point is that the dollar is starting to lose value, while the euro is gaining, as also Forex market is starting to lose ground.
That's for now.
Good luck.
#CryptoHellas Team

Ford running out of gas?Ford - Short Term - We look to Sell at 13.89 (stop at 14.82)
The medium term bias remains bearish. Broken out of the channel formation to the downside. Selling continued from the 61.8% pullback level of 14.41. The gap open from 14.34 to 13.94 has now been closed. Preferred trade is to sell into rallies.
Our profit targets will be 11.01 and 10.40
Resistance: 14.20 / 14.41 / 15.33
Support: 13.55 / 12.50 / 11.01
Please be advised that the information presented on TradingView is provided to Vantage (‘Vantage Global Limited’, ‘we’) by a third-party provider (‘Signal Centre’). Please be reminded that you are solely responsible for the trading decisions on your account. There is a very high degree of risk involved in trading. Any information and/or content is intended entirely for research, educational and informational purposes only and does not constitute investment or consultation advice or investment strategy. The information is not tailored to the investment needs of any specific person and therefore does not involve a consideration of any of the investment objectives, financial situation or needs of any viewer that may receive it. Kindly also note that past performance is not a reliable indicator of future results. Actual results may differ materially from those anticipated in forward-looking or past performance statements. We assume no liability as to the accuracy or completeness of any of the information and/or content provided herein and the Company cannot be held responsible for any omission, mistake nor for any loss or damage including without limitation to any loss of profit which may arise from reliance on any information supplied by Signal Centre.

DXY - clear bull divs showing on HTFPotential bounce waiting for us next week, with SPX on decisive point, DXY looks like it might one last run to create lower low.
Target: 108-109

DXY MOVE NEXT WEEK The dollar is still resisting the rise and it has signs of weakness, and I expect the next movement to be downward, especially with the somewhat lower inflation and the comments of the Monetary Policy Committee from the Federal Reserve members to reduce interest rates on the US dollar during the coming months.
We wait and see what next week has in store for us.
What do you think of the strength of the dollar currently? Is it subject to more collapses, or will it have a word next week that contradicts all expectations?
The four golden rules of trading
1 Don't be greedy
2 Always use stop loss
3 Never add other positions to the losing positions
4 Use a suitable lot for your account
❤️Please, support our work with like & comment!❤️

Gold may continue to rise again.Gold is still in an upward trend until the opposite is proven, so the next move is likely to be towards levels above 1800.
Gold is inversely linked to the US dollar, so it is likely that the dollar is currently in a state of weakness, but the strength of the dollar is getting sick but not dying. Therefore, caution should be a friend of our trading when we trade in gold.
The four golden rules of trading
1 Don't be greedy
2 Always use stop loss
3 Never add other positions to the losing positions
4 Use a suitable lot for your account
❤️Please, support our work with like & comment!❤️

USDCAD Potential downsidesHey traders, in the coming week we are monitoring USDCAD for a selling opportunity around 1.345 zone, once we will receive any bearish confirmation the trade will be executed.
Trade safe, Joe.

Tesla - Breaking out of a wedgeTesla - Short Term - We look to Buy at 177.90 (stop at 163.33)
The medium term bias remains bearish. Broken out of the wedge formation to the upside. Bullish divergence can be seen on the daily (the chart makes a lower low while the oscillator makes a higher low), often a signal of exhausted bearish momentum, or at least a correction higher. Although the anticipated move higher is corrective, it does offer ample risk/reward today. Preferred trade is to buy on dips.
Our profit targets will be 237.00 and 262
Resistance: 200.82 / 237.40 / 265.25
Support: 169.91 / 166.19 / 150.83
Please be advised that the information presented on TradingView is provided to Vantage (‘Vantage Global Limited’, ‘we’) by a third-party provider (‘Signal Centre’). Please be reminded that you are solely responsible for the trading decisions on your account. There is a very high degree of risk involved in trading. Any information and/or content is intended entirely for research, educational and informational purposes only and does not constitute investment or consultation advice or investment strategy. The information is not tailored to the investment needs of any specific person and therefore does not involve a consideration of any of the investment objectives, financial situation or needs of any viewer that may receive it. Kindly also note that past performance is not a reliable indicator of future results. Actual results may differ materially from those anticipated in forward-looking or past performance statements. We assume no liability as to the accuracy or completeness of any of the information and/or content provided herein and the Company cannot be held responsible for any omission, mistake nor for any loss or damage including without limitation to any loss of profit which may arise from reliance on any information supplied by Signal Centre.

US dollar DXY sell strategyDXY weekly chart.
I find a great time to sell, is when the price breaks the Bollinger channel to the upside. An aggressive strategy for sure, but can nail the tops.
IMPORTANT
-price can keep climbing so I rebuy if it runs up past my sell.
None of this should be interpreted as financial advice, I am not a professional or certified financial adviser! all charts, and or analysis' are my personal opinions and observations only!

NKE - Just do itNike Inc - Intraday - We look to Buy at 99.72 (stop at 91.56)
Broken out of the channel formation to the upside. We have a Gap open at 99.72 from 10/11/2022 to 11/11/2022. Further upside is expected although we prefer to buy into dips close to the 99.72 level. Expect trading to remain mixed and volatile.
Our profit targets will be 118.44 and 139.00
Resistance: 109.31 / 113.36 / 118.47
Support: 99.72 / 92.10 / 82.22
Please be advised that the information presented on TradingView is provided to Vantage (‘Vantage Global Limited’, ‘we’) by a third-party provider (‘Signal Centre’). Please be reminded that you are solely responsible for the trading decisions on your account. There is a very high degree of risk involved in trading. Any information and/or content is intended entirely for research, educational and informational purposes only and does not constitute investment or consultation advice or investment strategy. The information is not tailored to the investment needs of any specific person and therefore does not involve a consideration of any of the investment objectives, financial situation or needs of any viewer that may receive it. Kindly also note that past performance is not a reliable indicator of future results. Actual results may differ materially from those anticipated in forward-looking or past performance statements. We assume no liability as to the accuracy or completeness of any of the information and/or content provided herein and the Company cannot be held responsible for any omission, mistake nor for any loss or damage including without limitation to any loss of profit which may arise from reliance on any information supplied by Signal Centre.

USDCAD 30min Analysis November 18th, 2022USDCAD Bearish Idea
Daily Trend: Bearish
4hour Trend: Bearish
1hour Trend: Bearish
Trade scenario 1: We are looking bearish on all higher timeframe.
Looking for continuation after a lower high forms at 1.33000.
Trade scenario 2: Price can break back above the resistance and continue upside. Look for long entries after higher low confirmation at 1.33000.


Target - Corporate earnings season resemblant of the bear marketYesterday, Target announced its earnings for the third quarter of 2022. The report outlined softening sales and profit trends with downgraded guidance going forward. Total revenue and cost of sales increased year over year, while net earnings and EPS fell dramatically for that same period. Subsequently, shares of Target fell more than 13% in the pre-market trading. Target is yet another company that fulfills our prediction about a weak corporate earnings season and progression into the second phase of the bear market. We expect this trend to worsen in the next earning season and further enforce our thesis.
Total revenue = $26.518 billion (+3.4% YoY)
Cost of sales = $19.680 billion (+8.1% YoY)
GAAP Earnings per share = $1.54 (-49.3% YoY)
Operating income = $1.022 billion (-49.2% YoY)
Net earnings = $712 million (-52.1% YoY)
Illustration 1.01
The image above shows the daily chart of Target. Yellow arrows indicate previous earnings reports and subsequent price action.
Technical analysis - daily time frame
RSI and Stochastic reversed to the downside. MACD flattens, and if it breaks below 0 points, it will bolster the bearish case. DM+ and DM- performed a bearish crossover. Overall, the daily time frame is bearish.
Technical analysis - weekly time frame
RSI, MACD, and Stochastic show signs of exhaustion. DM+ and DM- are bullish. Overall, the weekly time frame is bearish.
Please feel free to express your ideas and thoughts in the comment section.
DISCLAIMER: This analysis is not intended to encourage any buying or selling of any particular securities. Furthermore, it should not be a basis for taking any trade action by an individual investor. Therefore, your own due diligence is highly advised before entering a trade.

WTI OIL Bull is over now Bearish for NOW !!!Us oil has done the Bull trend and all targets has HIT..now going for short possible targets till next FCP zone.
trade what you see and manage your risk.

US DOLLAR CURRENCY INDEX Breackdown the chartUS Doller very log time this type of move i will see, This is good for the Indian and other currencey
