Yesterday's bullish candle bullish for S&P500 SPX500USD - Intraday - We look to Buy at 3927 (stop at 3871)
Following yesterday's bullish candle, the overall trend higher looks set to continue today. A weaker opening is expected to challenge bullish resolve. Support is located at 3920 and should stem dips to this area. Support could prove difficult to breakdown. Dip buying offers good risk/reward.
Our profit targets will be 4079 and 4120
Resistance: 4080 / 4200 / 4625
Support: 3920 / 3700 / 3210
Risk Disclaimer
The trade ideas beyond this page are for informational purposes only and do not constitute investment advice or a solicitation to trade. This information is provided by Signal Centre, a third-party unaffiliated with OANDA, and is intended for general circulation only. OANDA does not guarantee the accuracy of this information and assumes no responsibilities for the information provided by the third party. The information does not take into account the specific investment objectives, financial situation, or particular needs of any particular person. You should take into account your specific investment objectives, financial situation, and particular needs before making a commitment to trade, including seeking advice from an independent financial adviser regarding the suitability of the investment, under a separate engagement, as you deem fit.
You accept that you assume all risks in independently viewing the contents and selecting a chosen strategy.
Where the research is distributed in Singapore to a person who is not an Accredited Investor, Expert Investor or an Institutional Investor, Oanda Asia Pacific Pte Ltd (“OAP“) accepts legal responsibility for the contents of the report to such persons only to the extent required by law. Singapore customers should contact OAP at 6579 8289 for matters arising from, or in connection with, the information/research distributed.'
US

Block: Nothing Block-ing further gains?Block - Short Term - We look to Buy at 71.84 (stop at 61.55)
Price action has formed a bullish ending wedge formation. A move through bespoke resistance at 71.84 and we look for extended gains. The continuation higher in prices through resistance has been impressive with strong momentum and shows no signs of slowing. Preferred trade is to buy on dips. Expect trading to remain mixed and volatile.
Our profit targets will be 113.47 and 149.00
Resistance: 80.25 / 90.99 / 113.48
Support: 71.84 / 60.82 / 56.01
Disclaimer – Saxo Bank Group. Please be reminded – you alone are responsible for your trading – both gains and losses. There is a very high degree of risk involved in trading. The technical analysis, like any and all indicators, strategies, columns, articles and other features accessible on/though this site (including those from Signal Centre) are for informational purposes only and should not be construed as investment advice by you. Such technical analysis are believed to be obtained from sources believed to be reliable, but not warrant their respective completeness or accuracy, or warrant any results from the use of the information. Your use of the technical analysis, as would also your use of any and all mentioned indicators, strategies, columns, articles and all other features, is entirely at your own risk and it is your sole responsibility to evaluate the accuracy, completeness and usefulness (including suitability) of the information. You should assess the risk of any trade with your financial adviser and make your own independent decision(s) regarding any tradable products which may be the subject matter of the technical analysis or any of the said indicators, strategies, columns, articles and all other features.
Please also be reminded that if despite the above, any of the said technical analysis (or any of the said indicators, strategies, columns, articles and other features accessible on/through this site) is found to be advisory or a recommendation; and not merely informational in nature, the same is in any event provided with the intention of being for general circulation and availability only. As such it is not intended to and does not form part of any offer or recommendation directed at you specifically, or have any regard to the investment objectives, financial situation or needs of yourself or any other specific person. Before committing to a trade or investment therefore, please seek advice from a financial or other professional adviser regarding the suitability of the product for you and (where available) read the relevant product offer/description documents, including the risk disclosures. If you do not wish to seek such financial advice, please still exercise your mind and consider carefully whether the product is suitable for you because you alone remain responsible for your trading – both gains and losses.

Us 100Us 100 breaking out of channel pattern on the verge to give strong closing might give breakout with gapup keep an eye

NASDAQ price expected to stallNASDAQ - Intraday - We look to Sell at 12094 (stop at 12252)
Following yesterday's bearish candle, the overall trend lower looks set to continue today. We are assessed to be in a corrective mode higher. Prices expected to stall near trend line resistance. We therefore, prefer to fade into the rally with a tight stop in anticipation of a move back lower.
Our profit targets will be 11707 and 11600
Resistance: 12000 / 12970 / 13600
Support: 11700 / 11200 / 10500
Risk Disclaimer
The trade ideas beyond this page are for informational purposes only and do not constitute investment advice or a solicitation to trade. This information is provided by Signal Centre, a third-party unaffiliated with OANDA, and is intended for general circulation only. OANDA does not guarantee the accuracy of this information and assumes no responsibilities for the information provided by the third party. The information does not take into account the specific investment objectives, financial situation, or particular needs of any particular person. You should take into account your specific investment objectives, financial situation, and particular needs before making a commitment to trade, including seeking advice from an independent financial adviser regarding the suitability of the investment, under a separate engagement, as you deem fit.
You accept that you assume all risks in independently viewing the contents and selecting a chosen strategy.
Where the research is distributed in Singapore to a person who is not an Accredited Investor, Expert Investor or an Institutional Investor, Oanda Asia Pacific Pte Ltd (“OAP“) accepts legal responsibility for the contents of the report to such persons only to the extent required by law. Singapore customers should contact OAP at 6579 8289 for matters arising from, or in connection with, the information/research distributed.'

≈ 5% SWINGTRADE NDQ10012150 to 11550
5% Swing Trade
600 Points Trade Opportunity.
The bottom of this tremendous bear market could be in already. Nobody knows.
if this was a short squeeze, the market will decline, right?
If this was THE bottom or a temporary bottom, the likelihood that even if this was the start of a bull market, after a few days of straight upward movement, a correction would also be normal.
Having this mind, the wedge pattern, which could fulfill itself will underline this theory.
So, of course, anything can happen, but I think the odds are not too bad for this one.
This is no financial advice, only sharing thoughts to our community!
Let me know what ya´ll think
Best,
gqt

June OILGoodmorning people
we have missed some opportunity the last month because i decided to stay away for a while but i kept sharing the big pictures !
here's what i expect oil to be at this summer either cheap or high priced !
GL

Twitter: Musk abandons deal - Have the Bulls abandoned it too?Twitter - Short Term - We look to Sell at 38.32 (stop at 41.62)
This stock has recently been in the news headlines. This has resulted in the medium term bias being for lower levels. We have a Gap open at 38.32 from 07/07/2022 to 08/07/2022. There is scope for mild buying at the open but gains should be limited. Preferred trade is to sell into rallies.
Our profit targets will be 31.70 and 30.00
Resistance: 38.32 / 39.51 / 41.29
Support: 34.39 / 32.52 / 31.70
Disclaimer – Saxo Bank Group. Please be reminded – you alone are responsible for your trading – both gains and losses. There is a very high degree of risk involved in trading. The technical analysis, like any and all indicators, strategies, columns, articles and other features accessible on/though this site (including those from Signal Centre) are for informational purposes only and should not be construed as investment advice by you. Such technical analysis are believed to be obtained from sources believed to be reliable, but not warrant their respective completeness or accuracy, or warrant any results from the use of the information. Your use of the technical analysis, as would also your use of any and all mentioned indicators, strategies, columns, articles and all other features, is entirely at your own risk and it is your sole responsibility to evaluate the accuracy, completeness and usefulness (including suitability) of the information. You should assess the risk of any trade with your financial adviser and make your own independent decision(s) regarding any tradable products which may be the subject matter of the technical analysis or any of the said indicators, strategies, columns, articles and all other features.
Please also be reminded that if despite the above, any of the said technical analysis (or any of the said indicators, strategies, columns, articles and other features accessible on/through this site) is found to be advisory or a recommendation; and not merely informational in nature, the same is in any event provided with the intention of being for general circulation and availability only. As such it is not intended to and does not form part of any offer or recommendation directed at you specifically, or have any regard to the investment objectives, financial situation or needs of yourself or any other specific person. Before committing to a trade or investment therefore, please seek advice from a financial or other professional adviser regarding the suitability of the product for you and (where available) read the relevant product offer/description documents, including the risk disclosures. If you do not wish to seek such financial advice, please still exercise your mind and consider carefully whether the product is suitable for you because you alone remain responsible for your trading – both gains and losses.

BIDU Farewell?Baidu - Intraday - We look to Sell at 150.96 (stop at 159.81)
The medium term bias remains bearish. We have a Gap open at 150.96 from 08/07/2022 to 11/07/2022. There is scope for mild buying at the open but gains should be limited. Preferred trade is to sell into rallies.
Our profit targets will be 119.90 and 102.50
Resistance: 150.96 / 156.69 / 170.35
Support: 140.58 / 130.51 / 119.82
Disclaimer – Saxo Bank Group. Please be reminded – you alone are responsible for your trading – both gains and losses. There is a very high degree of risk involved in trading. The technical analysis, like any and all indicators, strategies, columns, articles and other features accessible on/though this site (including those from Signal Centre) are for informational purposes only and should not be construed as investment advice by you. Such technical analysis are believed to be obtained from sources believed to be reliable, but not warrant their respective completeness or accuracy, or warrant any results from the use of the information. Your use of the technical analysis, as would also your use of any and all mentioned indicators, strategies, columns, articles and all other features, is entirely at your own risk and it is your sole responsibility to evaluate the accuracy, completeness and usefulness (including suitability) of the information. You should assess the risk of any trade with your financial adviser and make your own independent decision(s) regarding any tradable products which may be the subject matter of the technical analysis or any of the said indicators, strategies, columns, articles and all other features.
Please also be reminded that if despite the above, any of the said technical analysis (or any of the said indicators, strategies, columns, articles and other features accessible on/through this site) is found to be advisory or a recommendation; and not merely informational in nature, the same is in any event provided with the intention of being for general circulation and availability only. As such it is not intended to and does not form part of any offer or recommendation directed at you specifically, or have any regard to the investment objectives, financial situation or needs of yourself or any other specific person. Before committing to a trade or investment therefore, please seek advice from a financial or other professional adviser regarding the suitability of the product for you and (where available) read the relevant product offer/description documents, including the risk disclosures. If you do not wish to seek such financial advice, please still exercise your mind and consider carefully whether the product is suitable for you because you alone remain responsible for your trading – both gains and losses.

Zoom: Breaking lower from a wedge formationZoom - Short Term - We look to Sell at 106.91 (stop at 126.13)
Broken out of the wedge to the downside. The medium term bias remains bearish. We have a Gap open at 106.91 from 12/07/2022 to 13/07/2022. Further downside is expected although we prefer to set shorts at our bespoke resistance levels at 106.91, resulting in improved risk/reward. Expect trading to remain mixed and volatile.
Our profit targets will be 61.07 and 50.00
Resistance: 106.91 / 124.05 / 127.37
Support: 97.09 / 79.03 / 60.97
Disclaimer – Saxo Bank Group. Please be reminded – you alone are responsible for your trading – both gains and losses. There is a very high degree of risk involved in trading. The technical analysis, like any and all indicators, strategies, columns, articles and other features accessible on/though this site (including those from Signal Centre) are for informational purposes only and should not be construed as investment advice by you. Such technical analysis are believed to be obtained from sources believed to be reliable, but not warrant their respective completeness or accuracy, or warrant any results from the use of the information. Your use of the technical analysis, as would also your use of any and all mentioned indicators, strategies, columns, articles and all other features, is entirely at your own risk and it is your sole responsibility to evaluate the accuracy, completeness and usefulness (including suitability) of the information. You should assess the risk of any trade with your financial adviser and make your own independent decision(s) regarding any tradable products which may be the subject matter of the technical analysis or any of the said indicators, strategies, columns, articles and all other features.
Please also be reminded that if despite the above, any of the said technical analysis (or any of the said indicators, strategies, columns, articles and other features accessible on/through this site) is found to be advisory or a recommendation; and not merely informational in nature, the same is in any event provided with the intention of being for general circulation and availability only. As such it is not intended to and does not form part of any offer or recommendation directed at you specifically, or have any regard to the investment objectives, financial situation or needs of yourself or any other specific person. Before committing to a trade or investment therefore, please seek advice from a financial or other professional adviser regarding the suitability of the product for you and (where available) read the relevant product offer/description documents, including the risk disclosures. If you do not wish to seek such financial advice, please still exercise your mind and consider carefully whether the product is suitable for you because you alone remain responsible for your trading – both gains and losses.

Now I know my ABC, next time will you sell with me?Alphabet - Short Term - We look to Sell at 2306.60 (stop at 2426.25)
The medium term bias remains bearish. The sideways consolidation continued although the market managed to post a significant low at 2037.69. Continued downward momentum from 2393 resulted in the pair posting net daily losses yesterday. Further downside is expected and we prefer to set shorts in early trade.
Our profit targets will be 2001 and 1949.50
Resistance: 2393.70 / 2457.09 / 2490.00
Support: 2114.63 / 2100.92 / 2037.69
Disclaimer – Saxo Bank Group. Please be reminded – you alone are responsible for your trading – both gains and losses. There is a very high degree of risk involved in trading. The technical analysis, like any and all indicators, strategies, columns, articles and other features accessible on/though this site (including those from Signal Centre) are for informational purposes only and should not be construed as investment advice by you. Such technical analysis are believed to be obtained from sources believed to be reliable, but not warrant their respective completeness or accuracy, or warrant any results from the use of the information. Your use of the technical analysis, as would also your use of any and all mentioned indicators, strategies, columns, articles and all other features, is entirely at your own risk and it is your sole responsibility to evaluate the accuracy, completeness and usefulness (including suitability) of the information. You should assess the risk of any trade with your financial adviser and make your own independent decision(s) regarding any tradable products which may be the subject matter of the technical analysis or any of the said indicators, strategies, columns, articles and all other features.
Please also be reminded that if despite the above, any of the said technical analysis (or any of the said indicators, strategies, columns, articles and other features accessible on/through this site) is found to be advisory or a recommendation; and not merely informational in nature, the same is in any event provided with the intention of being for general circulation and availability only. As such it is not intended to and does not form part of any offer or recommendation directed at you specifically, or have any regard to the investment objectives, financial situation or needs of yourself or any other specific person. Before committing to a trade or investment therefore, please seek advice from a financial or other professional adviser regarding the suitability of the product for you and (where available) read the relevant product offer/description documents, including the risk disclosures. If you do not wish to seek such financial advice, please still exercise your mind and consider carefully whether the product is suitable for you because you alone remain responsible for your trading – both gains and losses.

This is not photoshopped - Adobe heading lower?Adobe - Short Term - We look to Sell at 380.40 (stop at 401.40)
The medium term bias remains bearish. The gap open from 10/06/2022 to 13/06/2022 has now been closed. As this corrective sequence continues we look to set shorts on a rally at better risk/reward levels. Further downside is expected and we prefer to set shorts in early trade.
Our profit targets will be 321.30 and 256.00
Resistance: 392 / 426.42 / 441.90
Support: 357.56 / 338.00 / 320.90
Disclaimer – Saxo Bank Group. Please be reminded – you alone are responsible for your trading – both gains and losses. There is a very high degree of risk involved in trading. The technical analysis, like any and all indicators, strategies, columns, articles and other features accessible on/though this site (including those from Signal Centre) are for informational purposes only and should not be construed as investment advice by you. Such technical analysis are believed to be obtained from sources believed to be reliable, but not warrant their respective completeness or accuracy, or warrant any results from the use of the information. Your use of the technical analysis, as would also your use of any and all mentioned indicators, strategies, columns, articles and all other features, is entirely at your own risk and it is your sole responsibility to evaluate the accuracy, completeness and usefulness (including suitability) of the information. You should assess the risk of any trade with your financial adviser and make your own independent decision(s) regarding any tradable products which may be the subject matter of the technical analysis or any of the said indicators, strategies, columns, articles and all other features.
Please also be reminded that if despite the above, any of the said technical analysis (or any of the said indicators, strategies, columns, articles and other features accessible on/through this site) is found to be advisory or a recommendation; and not merely informational in nature, the same is in any event provided with the intention of being for general circulation and availability only. As such it is not intended to and does not form part of any offer or recommendation directed at you specifically, or have any regard to the investment objectives, financial situation or needs of yourself or any other specific person. Before committing to a trade or investment therefore, please seek advice from a financial or other professional adviser regarding the suitability of the product for you and (where available) read the relevant product offer/description documents, including the risk disclosures. If you do not wish to seek such financial advice, please still exercise your mind and consider carefully whether the product is suitable for you because you alone remain responsible for your trading – both gains and losses.

Time to pull the PLUG?Plug Power - Short Term - We look to Sell at 18.02 (stop at 20.64)
The medium term bias remains bearish. We have a 38.2% Fibonacci pullback level of 20.09 from 12.70 to 32.05. In line with resistance, selling has been posted from 20.09. Preferred trade is to sell into rallies.
Our profit targets will be 12.72 and 9.45
Resistance: 20.09 / 23.49 / 24.72
Support: 15.63 / 13.90 / 12.70
Disclaimer – Saxo Bank Group. Please be reminded – you alone are responsible for your trading – both gains and losses. There is a very high degree of risk involved in trading. The technical analysis, like any and all indicators, strategies, columns, articles and other features accessible on/though this site (including those from Signal Centre) are for informational purposes only and should not be construed as investment advice by you. Such technical analysis are believed to be obtained from sources believed to be reliable, but not warrant their respective completeness or accuracy, or warrant any results from the use of the information. Your use of the technical analysis, as would also your use of any and all mentioned indicators, strategies, columns, articles and all other features, is entirely at your own risk and it is your sole responsibility to evaluate the accuracy, completeness and usefulness (including suitability) of the information. You should assess the risk of any trade with your financial adviser and make your own independent decision(s) regarding any tradable products which may be the subject matter of the technical analysis or any of the said indicators, strategies, columns, articles and all other features.
Please also be reminded that if despite the above, any of the said technical analysis (or any of the said indicators, strategies, columns, articles and other features accessible on/through this site) is found to be advisory or a recommendation; and not merely informational in nature, the same is in any event provided with the intention of being for general circulation and availability only. As such it is not intended to and does not form part of any offer or recommendation directed at you specifically, or have any regard to the investment objectives, financial situation or needs of yourself or any other specific person. Before committing to a trade or investment therefore, please seek advice from a financial or other professional adviser regarding the suitability of the product for you and (where available) read the relevant product offer/description documents, including the risk disclosures. If you do not wish to seek such financial advice, please still exercise your mind and consider carefully whether the product is suitable for you because you alone remain responsible for your trading – both gains and losses.


$AERC air space filtration! 👁🗨*This is not financial advice, so trade at your own risks*
*My team digs deep and finds stocks that are expected to perform well based off multiple confluences*
*Experienced traders understand the uphill battle in timing the market, so instead my team focuses mainly on risk management
My team entered interior air space purification company Aeroclean Technologies $AERC on 7/5/22 at $12.40 per share. This wasn't intended to be a Trading view trade, but this play is developing smoothly, and we figured we would just show you guys what we're up to.
OUR ENTRY: $12.40
FIRST TAKE PROFIT: $18
STOP LOSS: $11
If you want to see more, please like and follow us @SimplyShowMeTheMoney

USDYUANSqueezing pattern, the breakout will determine the direction of the imbalance, a break lower will see price soar down to previous balance, a break up and price searches higher for a fair price.

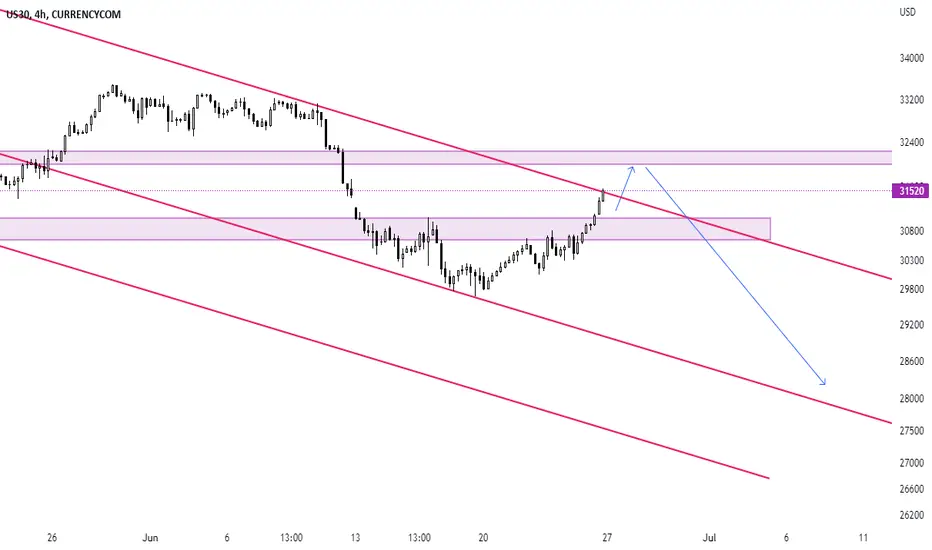
US30 Potential bullish bounce On the H4, with price moving above our ascending channel and ichimoku cloud, we have a bullish bias that price will rise from our entry at 30492 where the 61.8% Fibonacci retracement is to our take profit area of 31932 in line with the horizontal swing high resistance and 61.8% fibonacci retracement. Alternatively, price may break structure and head for our stop loss at 29674 where the horizontal swing low support and 61.8% fibonacci projection are.
Please be advised that the information presented on TradingView is provided to Vantage (‘Vantage Global Limited’, ‘we’) by a third-party provider (‘Everest Fortune Group’). Please be reminded that you are solely responsible for the trading decisions on your account. There is a very high degree of risk involved in trading. Any information and/or content is intended entirely for research, educational and informational purposes only and does not constitute investment or consultation advice or investment strategy. The information is not tailored to the investment needs of any specific person and therefore does not involve a consideration of any of the investment objectives, financial situation or needs of any viewer that may receive it. Kindly also note that past performance is not a reliable indicator of future results. Actual results may differ materially from those anticipated in forward-looking or past performance statements. We assume no liability as to the accuracy or completeness of any of the information and/or content provided herein and the Company cannot be held responsible for any omission, mistake nor for any loss or damage including without limitation to any loss of profit which may arise from reliance on any information supplied by Everest Fortune Group.

🔥USDMXN Buying Opportunity🔥Hello traders, how are you?
Since last week I have been looking for a buying opportunity for the USDMXN pair, the price approached a very strong support, a support that has not been broken since the eighth of December 2020.
There is also a divergence on the 4h frame for CMF, VWMACD and MOM , this gives a strong indication of the price reversal from the current price or from about 19.55.
Of course, it is better for you to follow the price on Monday and decide to enter on Tuesday to see the price behavior, or you can enter from the current price with a SMALL lots and the consolidation will be from the price of 19.55.
.
.
.
❤️ Please, support our work with like & comment! ❤️
.
.
.
Important rules:
1: Use a small lot
2: Don't be greedy
3: Stick to the goals
4: Don't add deals to losing trades
5: Stick to your stop loss
Good Luck To Everyone .

US30 - DOW JONES MORE SHOR IN 4H The Dow Jones and the rest of the indices' performance last week was positive and beautiful, but I see that the decline has not ended yet, especially with the risks of recession and the weakness of the dollar next week. They are all thoughts and expectations. This is a market of expectations, where nothing is certain.
.
.
Important rules:
1: Use a small lot
2: Don't be greedy
3: Stick to the goals
4: Don't add deals to losing trades
5: Stick to your stop loss
Good Luck To Everyone .
GOLD - XAUUSD Hello traders?
As I expect the dollar to fall this week, it is natural that gold, with its reverse movement with the dollar, will be an ideal rise, and the news supports its rise, as the G7 decides to ban the import of Russian gold to increase restrictions on Moscow with the continuation of the Russian-Ukrainian war and • Britain, America, Japan and Canada ban the import of Russian gold. This is likely to open the week with a large gap for gold. As for the movement of gold this week, it will be positive to support the price's rise.
.
.
Important rules:
1: Use a small lot
2: Don't be greedy
3: Stick to the goals
4: Don't add deals to losing trades
5: Stick to your stop loss
Good Luck To Everyone .

DXY- USD INDEX Hello traders!
The movement of the dollar for this week, we all know that the market these days is moving in an incomprehensible movement. We are now in a downside direction for all markets, including forex, stocks and even digital currencies.
The dollar's movement against a basket of currencies this week will be mostly in a bearish direction, as shown in the above chart.
Important rules:
1: Use a small lot
2: Don't be greedy
3: Stick to the goals
4: Don't add deals to losing trades
5: Stick to your stop loss
Good Luck To Everyone .

Joe Gun2Head Trade - Gap fill on NASDAQTrade Idea: NASDAQ
Reasoning: Gap fill on NASDAQ
Entry Level: 11797
Take Profit Level: 11035
Stop Loss: 11905
Risk/Reward: 6.83:1
Disclaimer – Signal Centre. Please be reminded – you alone are responsible for your trading – both gains and losses. There is a very high degree of risk involved in trading. The technical analysis , like all indicators, strategies, columns, articles and other features accessible on/though this site is for informational purposes only and should not be construed as investment advice by you. Your use of the technical analysis , as would also your use of all mentioned indicators, strategies, columns, articles and all other features, is entirely at your own risk and it is your sole responsibility to evaluate the accuracy, completeness and usefulness (including suitability) of the information. You should assess the risk of any trade with your financial adviser and make your own independent decision(s) regarding any tradable products which may be the subject matter of the technical analysis or any of the said indicators, strategies, columns, articles and all other features.

US 2YR yeild consolidationThe US 2YR has paused its upside momentum giving stonks a chance to have a small rally. Most likely short covering since quad witch caused a gamma unwind. The 2YR would have to break down meaningfully for stocks to have any chance of a decent rally which I don't see happening with the Fed's current rate hike projections.

Bershire hathway going away.....Very clean head and shoulders breakdown....details on chart....
NYSE:BRK.B
