CFD on WTI CRUDEOIL (US OIL)ITS A T4HR TRADE FOR USOIL
1. Got Activated.
2. Stop loss @ 69.65 and resp. Target 1 @ 69.65 and Target 2 @ 67.59
3. Its a swing trade for 1 week trade working days duration.
4. Kindly make your orders accordingly to the duration period mentioned.
God bless. Happy trading Days
US

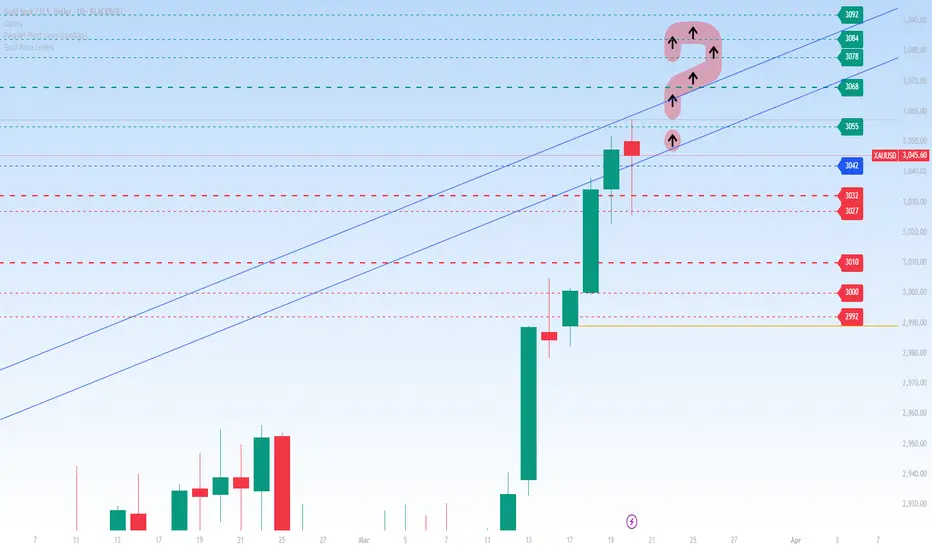
2 more reasons to buy gold? Israel is sending a delegation to Washington for strategic talks on Iran, while Trump has reportedly given Tehran a two-month deadline for a nuclear deal—so far, Iran isn’t engaging.
So, the question is: Are we headed towards military conflict or a significant wave of sanctions?
Meanwhile, protests erupted after Erdoğan’s main rival was arrested, triggering a sharp selloff in Turkish markets. The lira hit record lows, forcing the central bank to intervene with nearly $10 billion in currency sales.
Turkey’s inflation remains elevated at 39%, with interest rates at 42.5%. Continued lira weakness could push inflation higher, forcing further rate hikes and adding to the country’s economic instability.
the Head and Shoulders of the Month!Hello TradingView Family / Fellow Traders. This is Richard, also known as theSignalyst.
📈 This week, XRP rejected the $2 support level and has been trading higher.
Today, XRP formed an inverse head and shoulders pattern and broke its green neckline upward.
🏹 As long as the bulls hold, a movement towards the upper bound of the falling red channel would be expected.
📚 Always follow your trading plan regarding entry, risk management, and trade management.
Good luck!
All Strategies Are Good; If Managed Properly!
~Rich

The Big ReloadI anticipate a significant pullback on the daily timeframe, targeting the $15,000 level before resuming the upward trend.
Following a substantial break in the bullish trend, a robust retracement is expected. This correction should trigger considerable buying momentum around the $15,000 to $16,000 range, presenting opportunities for long-term positions to the upside.

Omnichart presents - NIFTY/(USDINR) long term trend Nifty's performance when compared to US dollar (vs its base currency i.e. Indian Rupee) broke above a long term since 2007 resistance through Dec 2020. As you can see it broke above the blue line in Dec 2020 and has been outperforming the dollar - to -rupee. What this means is that investing US dollars to buy Nifty started becoming more profitable in Dec 2020 vs just keeping the wealth in US Dollars (not converting to INR). This is in a long term uptrend - what this means is that investing US dollars in NIFTY long term is a profitable strategy.

Treasury Secretary Bessent: Make Iran broke again Treasury Secretary Scott Bessent, speaking at the Economic Club of New York, said the U.S. is enforcing sanctions on Iran for “immediate maximum impact,” warning that Iranians should move their money out of the rial.
The goal is to cut Iran’s oil exports from 1.5 million barrels per day to near zero.
His comments came as oil prices fell to multiyear lows on Wednesday, driven by concerns that tariffs on Canada, Mexico, and China could slow economic growth and weaken crude demand.
Following Bessent’s remarks, both U.S. crude and Brent prices turned positive, with JP Morgan analysts noting that a decline in Iranian supply is currently the only bullish factor for oil prices.
Bessent also signaled that the administration is prepared to impose full-scale sanctions on Russian energy if it helps lead to a ceasefire in Ukraine. This is a welcome shift from the Trump administration, who so far has only been pressuring the victim of the war rather than the perpetrator.

Trump's Golden RatioTrump has launched his own personal token that he will use solely for his own benefit for bribes and money laundering. He's not a politician, he's a businessman who knows how to make money. Creating his own cryptocurrencies is direct proof of that. The $TRUMP token plays a role as the president's personal token for the Republicans to donate to him and a legal way to get money from other politicians. The whole saga with his token is just beginning, it is one of the few steps in building the Trump family the greatest business ever.
As far as the chart is concerned, we should wait for a bounce into the golden section area. Now there was a FUD regarding the ByBit hack, it's like a fake attempt to panic the crowd, but it didn't work with smart people. Only the strongest are left here, who have survived everything they can.
Horban Brothers.

$FWOG ANALYSIS! If price reaches the green support zone 🟩, there is a potential long entry 📈 as buyers could step in and push the price up again.
⚠️ Waiting for confirmation before entering a long position from this zone.

TSLA ANALYSIS!Tesla stock is approaching the green support zone 🟩. There is a potential bounce up 📈 as buyers could step in again with increasing trading volume.

Can Soybeans Survive the Global Trade Chessboard?In the intricate game of international trade politics, soybeans have emerged as pivotal pieces on the global economic chessboard. The soybean industry faces a critical juncture as nations like the European Union and China implement protectionist strategies in response to US policies. This article delves into how these geopolitical moves are reshaping the future of one of America's most significant agricultural exports, challenging readers to consider the resilience and adaptability required in today's volatile trade environment.
The European Union's decision to restrict US soybean imports due to the use of banned pesticides highlights a growing trend towards sustainability and consumer health in global trade. This move impacts American farmers and invites us to ponder the broader implications of agricultural practices on international commerce. As we witness these shifts, the question arises: How can the soybean industry innovate to meet global standards while maintaining its economic stronghold?
China's strategic response, which targets influential American companies like PVH Corp., adds complexity to the global trade narrative. The placement of a major U.S. brand on China's 'unreliable entity' list highlights the power dynamics involved in international commerce. This situation prompts us to consider the interconnectedness of economies and the potential for unforeseen alliances or conflicts. What strategies can businesses implement to navigate these challenging circumstances?
Ultimately, the soybean saga is more than a tale of trade disputes; it's a call to action for innovation, sustainability, and strategic foresight in the agricultural sector. As we watch this unfold, we are inspired to question not just the survival of soybeans but the very nature of global economic relationships in an era where every move on the trade chessboard can alter the game. How will the soybean industry, and indeed, international trade, evolve in response to these challenges?

Critical 4.50% level being tested ahead of Trump speech and FOMCThe US10-year yield closed the week marginally higher at 4.48% after a busy week of events which saw the DXY stumble by 1.2% despite US CPI rising for the 4th consecutive month coupled with a rather hawkish yet upbeat testimony before congress from Fed chair Powell, which in my opinion was all dollar positive. US CPI for the month of January came in hotter than expected at 3.0% yoy, up from 2.9% in December. Additionally, on top of Powell’s comments regarding the strength of the US economy, the ISM Manufacturing PMI completely shattered expectations after coming in stronger than expected at 50.9 for the month of January.
The US10-year yield is currently testing the 50-day MA level of 4.52% as well as the blue support range between 4.45% and 4.50%. A break below 4.40% will however force me to invalidate my series of ideas on the US10-year yield calling for a move higher towards 5.00%. A break below 4.40% will allow bond bulls to pull the yield lower onto the 61.8% Fibo retracement at 4.30% and the 200-day MA at 3.69%.

SHORT! US Dollar.....For nowUSD is in a clear wave 2 down for many reasons.
- Tariffs speculation
- Inflation data higher than expected
- US M2 money supply increase
- US manufacturing output drops and Retail sales drop
Moreover, the dollar for now is bearish until reversals in the aforementioned list of causes for its recent decline. Primarily, look for the FED to hold off on any future rate cuts until later in the year. Treasury Yields(Bond Sell off) rising recently is an indication that the market does not expect any FED rate cuts happening anytime soon. This could spur demand for the US Dollar as other Central Banks globally look to continue to cut rates (i.e. ECB and BOE).

Hot Inflation & What to Watch Next - 14/02/2514th of February 2025
•XRP and BNB leading, as Bitcoin trades flat in the last seven days.
•Headline inflation metrics in the US land above expectations.
•Impactful data point to watch heading into the end of February.
---
A big week of headlines and events, particularly out of the US, have netted very little change in Bitcoin’s price.
Bitcoin is down 0.1% at the time of writing in the last seven-days, while altcoins such as XRP and BNB are showing double-digit gains.
Bitcoin has struggled to make new year-to-date highs in the current state of global conditions. In contrast, global indices in the UK (FTSE100) and China (CSI300) have continued to make new year-to-date highs
Mixed Messages & Above Expected Results
Fed Chair Jerome Powell mentioned earlier this week at a senate banking enquiry that the current state of monetary policy does not require easing conditions, as the economy remains strong and the 2% target for inflation is key.
However, he has referenced that unexpected moves in the labour market or a significant cooling of inflation could change the committee’s mind.
“If the labor market were to weaken unexpectedly or inflation were to fall more quickly than anticipated, we can ease policy accordingly.”
On this point, headline metrics for inflation land above expectations this week.
On Tuesday, Consumer Price Index (CPI) landed above expectations at 3.0%, rising 0.1% from the previous month.
Overnight the Producers Price Index (PPI) landed above expectations at 3.5% year-on-year. This figure remains unchanged from the previous month and represents the inflation burden on producers in the US.
Key data to come
On the last day of February the US Personal Consumption Expenditures (PCE) data will provide further clarity towards the state of monetary policy heading into next month.
PCE is the leading indicator used by the policy committee to measure inflation.
Fear and greed currently reads 40 – neutral.
Bitcoin Analysis
The price of Bitcoin is currently trading within the January high and low range, and on the Bollinger band we are entering a period where the upper and bottom channel is compressing.
Bullish Scenario
In the coming days, price may see a sharp move higher as the Bollinger Bands tighten. If bulls regain control and reclaim the monthly open, they could push toward last month’s high.
Bearish Scenario
We could also with this compression in the Bollinger Bands, see volatility moving price to the downside. This may result in prices heading towards the January low.
DISCLAIMER: The information is for general information purposes only. It is not intended as legal, financial or investment advice and should not be construed or relied on as such. Before making any commitment of a legal or financial nature you should seek advice from a qualified and registered legal practitioner or financial or investment adviser. No material contained within this website should be construed or relied upon as providing recommendations in relation to any legal or financial product.

US30 - Make or Break zone!Hello TradingView Family / Fellow Traders. This is Richard, also known as theSignalyst.
📈 US30 is currently retesting its all-time high at $45,000.
🏹For US30 to enter the price discovery phase and reach new ATHs, an 4H candle close above $45,000 is required.
📉On the other hand, if the last major low marked in red is broken downward, a deep correction towards the orange support would in play.
For now, we wait! ⏱️
📚 Always follow your trading plan regarding entry, risk management, and trade management.
Good luck!
All Strategies Are Good; If Managed Properly!
~Rich
Disclosure: I am part of Trade Nation's Influencer program and receive a monthly fee for using their TradingView charts in my analysis. This helps me cover the cost of providing regular insights.

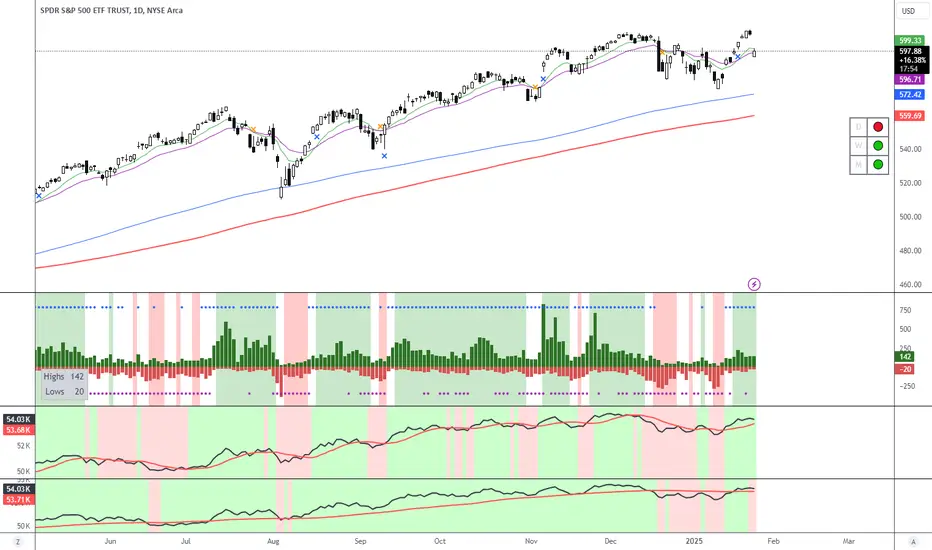
Nothing bad happendThe US markets fell sharply today. The S&P500 lost almost 2%. Many investors, especially on social media, are wondering whether the “Trump Rally” is now over. I think this is extremely unlikely. As is so often the case, markets tend to exaggerate, both upwards and downwards.
The price slide was triggered by news from China. Th AMEX:SPY ere, the start-up “DeepSeek” has announced that it has AI models that work just as well as their US counterparts at a much lower price and with less data.
This will certainly not have a lasting impact, but it should make us aware that the AI party will be over at some point.
Can Turkey's Lira Dance with the Dollar?Turkey stands at a pivotal moment in its economic journey, navigating through the complexities of fiscal management and monetary policy to stabilize the Turkish Lira against the US Dollar. The nation has embarked on a strategic pivot towards domestic funding, significantly increasing the issuance of Turkish Government Bonds to manage soaring inflation and debt service costs. This approach, while stabilizing in relative terms, challenges Turkey to balance between stimulating growth and controlling inflation, a dance that requires both precision and foresight.
The Central Bank of Turkey's decision to cut rates amidst rising inflation paints a picture of calculated risk and strategic optimism. The bank is threading a needle between fostering economic activity and maintaining price stability by targeting a reduction in inflation over the medium term while allowing short-term increases. This policy shift, coupled with a focus on local funding, not only aims to reduce external vulnerabilities but also tests the resilience of Turkey's economy against global economic currents, including the impact of international political changes like the US election.
Globally, the economic landscape is fraught with uncertainties, and Turkey's strategy of maintaining a stable credit rating while forecasting a decrease in inflation sets an intriguing stage. The country's ability to attract investment while managing its debt profile, especially in light of global monetary policy shifts by major players like the Federal Reserve and the ECB, will be a testament to its economic stewardship. This narrative invites readers to delve deeper into how Turkey might leverage its economic policies to not only survive but thrive in a fluctuating global market.
The enigma of the USD/TRY exchange rate thus becomes a compelling study of economic strategy, where every policy decision is a move in a larger game of financial chess. Turkey's attempt to balance its books while dancing with the dollar challenges conventional economic wisdom and invites observers to ponder: Can a nation truly master its currency's fate in the global marketplace?

Can the Yuan Dance to a New Tune?In the intricate ballet of global finance, the Chinese yuan performs a delicate maneuver. As Donald Trump's presidency introduces new variables with potential tariff hikes, the yuan faces depreciation pressures against a strengthening U.S. dollar. This dynamic challenges Beijing's economic strategists, who must balance the benefits of a weaker currency for exports against the risks of domestic economic instability and inflation.
The People's Bank of China (PBOC) is navigating this complex scenario with a focus on maintaining currency stability rather than aggressively stimulating growth through monetary policy easing. This cautious approach reflects a broader strategy to manage expectations and market reactions in an era where geopolitical shifts could dictate economic outcomes. The PBOC's recent moves, like suspending bond purchases and issuing warnings against speculative trades, illustrate a proactive stance in controlling the yuan's descent, aiming for an orderly adjustment rather than a chaotic fall.
This situation provokes thought on the resilience and adaptability of China's economic framework. How will Beijing reconcile its growth ambitions with the currency's stability, especially under the looming shadow of U.S. trade policies? The interplay between these two economic giants will shape their bilateral relations and influence global trade patterns, investment flows, and perhaps even the future of monetary policy worldwide. As we watch this economic dance unfold, one must ponder the implications for international markets and the strategic responses from other global players.

Today analysis for Nasdaq, Oil, and GoldNASDAQ
The NASDAQ closed higher, digesting the release of the CPI data. On the weekly chart, it faced resistance at the 5-week moving average, forming an upper wick. After a downtrend early this week, the market rebounded significantly. On the daily chart, the index rose to around the 20-day moving average but has yet to see the MACD cross above the signal line, making it premature to confirm a buying signal. Even if the uptrend continues, it would be prudent to wait for a golden cross in the MACD before committing to a buy position. Moreover, there is significant resistance from prior supply zones, making a sell strategy around higher levels valid.
On the 240-minute chart, as mentioned previously, a failed dead cross led to a rebound, forming an inverse head-and-shoulders pattern. The MACD is trending upwards and diverging from the signal line. However, since the signal line is still below the zero line, a sideways consolidation phase may be necessary before a sustained move higher. Today, it is advisable to focus on range-bound trading within a box, managing risks carefully with sell strategies at higher levels.
OIL
Crude oil closed higher as it absorbed inventory data and the pipeline shutdown news. On the daily chart, it found support at the 5-day moving average and broke strongly above $78 (March futures), the upper boundary of the monthly chart. However, the sharp upward move has created significant gaps between the moving averages, suggesting the potential for a corrective phase today.
On the 240-minute chart, a buy signal has triggered a sharp rise, but the MACD has not yet surpassed its previous high. A failure to rally further could create bearish divergence. A significant correction and support at previous resistance levels, such as the $74–$75 range, could present a buying opportunity. Meanwhile, profit-taking may dominate as the market digests the recent rally. A box range approach with buy strategies on dips and sell strategies at higher levels is recommended.
GOLD
Gold closed higher after digesting the CPI data. On the daily chart, both the MACD and the signal line have moved above the zero line, signaling a confirmed buy trend. Further upside is expected, as it has also broken above the resistance line of a triangular consolidation pattern. A buy-focused strategy remains valid.
On the 240-minute chart, a buy signal preceded continued gains. Should the MACD and signal line diverge further, this would increase confidence in the uptrend. Even if gold consolidates instead of continuing to rally, the signal line above the zero line indicates a neutral-to-positive outlook. Considering that the 10-year U.S. Treasury yield is showing signs of peaking and pulling back, gold’s strong upward trend is worth monitoring closely. As numerous data releases are expected today, stay cautious and trade wisely.
■Trading Strategies for Today
NASDAQ - Range-bound Market
-Buy: 21325 / 21270 / 21190 / 21140
-Sell: 21440 / 21500 / 21550 / 21590
Crude Oil - Bullish Market (March futures)
-Buy: 78.10 / 77.50 / 76.90 / 76.30
-Sell: 79.70 / 80.10 / 80.80 / 81.30
Gold - Bullish Market
-Buy: 2717 / 2709 / 2700 / 2696 / 2690
-Sell: 2726 / 2732 / 2738 / 2745 / 2754
These strategies apply only during pre-market hours. Profit-taking and stop-loss levels are as follows: Nasdaq: 15 points, Oil and Gold: 20 ticks.
If you liked this analysis, please follow me and give it a boost!

Nasdaq composite index projected to reach previous peak To put it simple:
1. Change of Administration together with future Economic Policy and Priorities
1. Monday the 20th D.Trump is going to be inaugurated at the President of the USA. What we have learned from his election is that he is Nationalist (for his country only) and he is very close with Elon Musk. Therefore we can assume he is obligated to act accordingly to benefit these Tech and Crypto elites.
Currently the state of California is burning. Company headquarters in the valley are burning and Trump is obligated to be the hero t save them a with quick and cheap bailout money thus inject money into the market.
2. Technical Analysis
Ever since Nasdaq reach its peak during election week it has since retraced its value back to the initial price breakout forming a descending triangle with a support around the 21 100 /21 200 denomination. Using the total length of the triangle we have calculated a 1600 point move (3/4%) to the upside.
Remember this is not advise rather an objective opinion
Trade responsibility

USDOLLAR /JPY Long Dollar Ralley is strongThe US dollar has strengthened further since Friday’s strong jobs report showed far better payrolls growth than expected
The US dollar is broadly firmer, though the Japanese yen is proving a resilient ahead of the BOJ deputy governor's speech

EURUSD 5/1/25Heading into the First Trading Week of the Year
We’re ready to dominate as always, with Orion leading the way and providing a clear bias. This week, we continue with our bearish outlook, looking to trade from the highs into the lows outlined here, with the target clearly defined.
Before diving in headfirst, let’s cover a few key points:
There’s currently a large gap between the highs and the current price.
Based on this, we need to be mindful of the following scenarios:
A short-term high could form before reaching the main highs shown here.
A new low might be created, giving us an additional target low.
These scenarios suggest we could see some form of manipulation before a move higher. For example, the price could create new highs, sweep them, and then form a new short-term low.
While this wouldn’t invalidate the larger bearish move, it could shake out many lower time frame traders.
Please also take note of the heavy liquid we have stored above the current highs we are looking at.
Trade safe and stick to your plan.

A short-term rally for BRK.B to get to the weekly FVG and fadeBRK.B has been falling for the last two weeks.
On the weekly interval, there is a bearish fair value gap. We saw an up-close bar on Friday. I believe price will continue to go lower and it will do that from the weekly FVG. The ultimate target is the intermediate term low at 437.90.

US30 - Once A Castle, Always A Castle!Hello TradingView Family / Fellow Traders. This is Richard, also known as theSignalyst.
📈US30 has been bullish , trading within the rising channel in blue.
After rejecting the $45,000, has been in a correction phase and approaching the lower bound of the channel.
Moreover, the zone marked in green is a strong structure.
🏹 Thus, the highlighted blue circle is a strong area to look for buy setups as it is the intersection of the structure and lower trendline acting as non-horizontal support.
📚 As per my trading style:
As #US30 approaches the blue circle, I will be looking for bullish reversal setups (like a double bottom pattern, trendline break , and so on...)
📚 Always follow your trading plan regarding entry, risk management, and trade management.
Good luck!
All Strategies Are Good; If Managed Properly!
~Rich
