GOLD - WHAT TO DO AND WHAT NOT? 1. Election result in uncertainty will fuel the bulls.
2. Stimulus package is obvious with Baiden will push the metal lower.
3. Stable and predictable economic policies, Paris accord and china deal will make the economic outlook better.
So blue is red for Gold. Stay updated with us.
US

EURUSD: Daily Time Frame Analysis & Key Levels
hey traders,
due to uncertainty with elections, it is quite hard to find a decent trading opportunity.
the instruments are quite volatile and chaotic at the moment so I am waiting until it settles.
On eurusd after a bounce from the current structure low, the price is currently attempting to break above a major falling trend line that served as the resistance.
depending on the reaction of the market on that,
here are the key daily levels to consider:
Support 1 - 1.16 - 1.162 current daily structure low
Resistance 1 - 1.185 - 1.187 last daily lower high
Resistance 2 - 1.195 - 1.20
remember that if daily candle closes above the trend line, if it serve us support.
key levels are used as goals for our trades and as points from where we open them!

US Elections - My thoughtsHi Guys - Do not take this as trading advice, Its only my thoughts on the market and what I see pre-results for the elections.
Remember to follow me if you like the content
Cheers

Ridethemacro |XAU/USD Trade of the week (Elections) Tarde Analsysis absed on Price action and fundamnetals:
WIth Risk Management you will never loss.
Thank you

EURUSD: Multi Time Frame Analysis & Scenarios for This Week
Daily/4h time frame analysis.
Price action & potential scenarios.
Trading recommendations.
Please, support this video with like and comment! thank you!

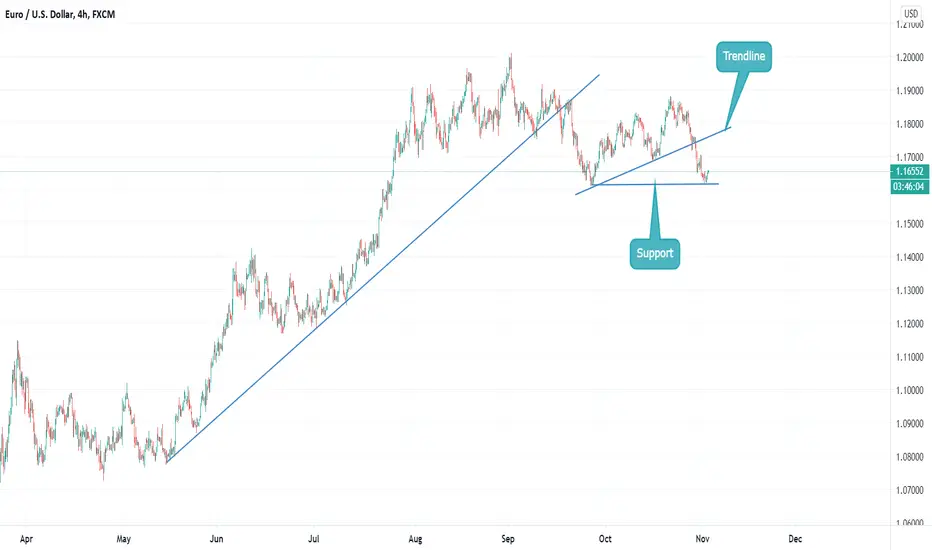
ANALYSIS ON EURUSDHello, my fellow traders hope you all are making some profits. We are here with our new analysis so that we can increase those profits for you. Let’s get into it.
As we can see, the price broke from its trendline and went down till its support. As per our analysis it will retrace.
Let us know your views on this in the comment section. Thank you all.
There is good news for our followers. We will be analyzing on-demand. So, let us know which pair you want our analysis on, and we will get it for you. Do like and follow us.
USD/CAD Shows Signs of Confirmation on Horizontal SupportIn this idea I explain how to leverage the S/R flip principle to find support in an area where previously resistance was found. I then use this level to suggest a long trade set-up towards the resistance trendline.

USDMXN IDEAUSDMXN pulled back with @20.84508 which we could consider this level as a critical zone , for now my expectation for that pair is rising @21.85864

GBPUSD SHORT TRADE IDEAHELLO EVERYONE,
Coming to Analysis of GBPUSD , here are a few points to be considered :
--Price Has broken out of the channel and we have a clear "break and retest" .
--Price has broken a 4Hr structure and retested the low .
--Currently I am looking for a nice move to the downside .
--The Targets have been defined over Critical Demand/ Supply zone to ensure accuracy over the targets


GBPUSD: Bear Flag Breakout
GBPUSD broke and closed below the support line of a bearish flag pattern on a daily.
it is a strong bearish signal and now the price will most likely keep falling.
next goal - 1.2775
if you missed the entry, I would recommend looking for a retest.


You can be in these trades too, without spending hours analysingVery rarely can anyone 'really' back up their solution and trading strategy like this. They advertise hopes and dreams with profit shots without showing you 'how' and you see no proof.
I know; so we were committed to provided proof.
Now imagine trading in a way where you can live your normal life without being sat in front of the screen for hours a day or in your evenings or on a Sunday afternoon, just when your better half wants you to walk the dog, cook the tea or watch 'netflix and chil' with him/her.
A way that removes subjectivity, discretion, emotion and ego from your trading...
There is no need for the market to prove you right to make you feel more 'intellectually capable' or 'clever' ; you can be wrong more than you're right and still make profit.
Imagine a way of trading where you find consistency, belief and confidence in your trading and you achieve the consistency you are looking for. A way of trading where you can be present, where you can live your life and trading just happens in the background without you worrying or getting angry or depressed about it; being able to have a coffee with friends and listen and participate in a conversation without your right hand grabbing your phone to check your MT4 screen.
What if you were also the right side of the trend not trying to catch the top of the move for sell; or the low of a move for a buy, that's quite refreshing right? Not fighting the market BUT in fact going with it.
Have you also not thought that, yes 90% of traders fail; we read about it everywhere.
Why though? Probably because they are all trading the same way and doing the same thing? Drawing pretty lines on their charts instead of trading in a 'mechanical way'.
You need to stop following the herd, it will lead you to the 90% section.
Why listen to me, here the why.....
Back when the coronavirus hit at the start of the year I was continually the wrong side of the market. Using my technical analysis I was trying to predict when the market would reverse from an area of support or resistance or a trend line break, etc.
I would wait for confirmation of this in price action (yes visible rejection, pin bar, engulfing candle - all that BS) and convince myself that this was a solid trade and that my analysis was correct.... WRONG!
Only to hit stop loss and for the market trend to continue. You think 'it cant keep going up' right? So you sell again, guess what?
Yes it keeps going up. You're pretty pissed off and now chasing this loss.....
It let me thinking there must be a better way. So I saught out to create one and had the idea of creating a strategy and a program or software that enabled anybody to trade even with no experience AND to be the right side of the market in these trends.
I wanted to be in this big move, not desperately trying to find the 'sniper' entry for a rejection - don't even get me started on when I would then exit....
I tried many things and failed however through persistence and perseverance we created a trend trading strategy that worked....
Initially this was just a buy and sell strategy where are you follow the trend but I wasn't content with that, I couldn't PROOVE it worked.
We continued to increase functionality and back testing so this could be achieved.
I looked at money management techniques for stop loss placement and various different ways to manage the exit of the strategy to find the most profitable methods.
We created something that works across all instruments that enables you to be the right side of the market by following the trend with integrated risk management.
The ability to set your lot sizes with ease, instead of either guessing or using a 3rd party app to ensure you are really risking your 1%.
Substantial back testing data to back up our edge was achieved. Eureka right?
Your pain in blowing accounts, being angry and frustrated and impatient is now long gone as long as you take action
Watch the video where I demonstrate how we enter a trade, how it shows on your screen, and the PROOF that you are desperately seeking to enable you to make an informed decision.
Do this resonate? Take a look at our other trade ideas too and if you leave us a 'like' you will get a virtual high five from me.
Regards
Darren

USDJPY: Pullback From Key Level
hey traders,
I guess you noticed this major strong daily support level on USDJPY.
the price has reached that yesterday and on 4H it went immediately rejected.
on hourly, after a steady bearish continuation, the price has set a higher low
and broke above the resistance line of a falling channel.
now the area between the last lower high and broken resistance serves as the local demand zone.
I will buy usdjpy from there.
goals:
104.6
104.8

Ridethemacro | DXY Volatility into the elections 2020.Analysis Based on Fundamentals and Price Action.
With Risk management You Will Never loss.
Thank you.


NZDUSD: Important Breakout
NZDUSD broke below a support line of a rising parallel channel.
the breakout is matches with a violation of a horizontal minor support of a double top formation.
now the price will most likely drop low.
because the breakout candle was quite strong, I recommend retest entry.
first goal: 0.665


Berkshire Hathaway Good Idea Buy I am a consultant for anyone who needs a consultant, I see that Berkshire Hathaway will GO UP IN FEW days when the market open
1, When you decide to use my ideas in your trading, please contact me to inform you of some things and monitor the position together without specifying a take profit or stop loss, we will decide when to open and close the position
2 (When I set the take profit and stop loss in a number that does not mean that the price will reach it, I gave a buy or sell signal only according to the analyzes I made in the chart and delete it later, in the order to share it with you so that you have a clear picture and read it clearly, thank you!)
3, you can try me for one or two weeks to decide to work with you and give you signals about buying or selling


EURUSD: Weekly Update & Multi Time Frame Analysis
Daily/4H time frame analysis on EURUSD.
Price action and potential scenarios.
Important bearish clues discussed.
Please, support this video with like and comment. Thank you!

US10Y Bonds range for next several months !10 year US bonds price reached all time
low at 0.349%. Based on mathematical
analysis new range for next several
months can be 0.349-1.037

USDCAD Retesting the downtrend +70 PipsWelcome Back.
Please support this idea with LIKE if you find it useful.
***
It may head to the downside after breaking the downtrend, and then return to the upside with the same scenario that you set.
***
Here is the full analysis for this pair, let me know in the comment section below if you have any questions, the entry will be taken only if all rules of the strategies will be satisfied. I suggest you keep this pair on your watchlist and see if the rules of your strategy are satisfied.
Remember this analysis is not 100% accurate No single analysis is To make a decision follow your own thoughts.
***
The information given is not a Financial Advice.
