US

US Government Bonds 10 YR YieldDaily chart on 10-year rates, be careful, we have just crossed the line above the 200-period simple moving average.
Make your opinion, before placing an order.
► Please boost, comment, subscribe!

US30: Seize the Opportunity - Buy Signal Active!US30: Seize this buying opportunity on the US30, as market conditions indicate a potential upward trend. The US30 is currently in a reversal phase, making it an ideal time to enter the market. Pay close attention to technical signals and indicators, as the US30 could soon experience a strong rise. Don't miss this buying opportunity on the US30 to maximize your gains.

Bullish bounce?US Dollar Index (DXY) is falling towards the pivot which has been identified as a pullback support and could bounce to the 1st resistance level which acts as a pullback resistance.
Pivot: 103.33
1st Support: 102.83
1st Resistance: 103.98
Risk Warning:
Trading Forex and CFDs carries a high level of risk to your capital and you should only trade with money you can afford to lose. Trading Forex and CFDs may not be suitable for all investors, so please ensure that you fully understand the risks involved and seek independent advice if necessary.
Disclaimer:
The above opinions given constitute general market commentary, and do not constitute the opinion or advice of IC Markets or any form of personal or investment advice.
Any opinions, news, research, analyses, prices, other information, or links to third-party sites contained on this website are provided on an "as-is" basis, are intended only to be informative, is not an advice nor a recommendation, nor research, or a record of our trading prices, or an offer of, or solicitation for a transaction in any financial instrument and thus should not be treated as such. The information provided does not involve any specific investment objectives, financial situation and needs of any specific person who may receive it. Please be aware, that past performance is not a reliable indicator of future performance and/or results. Past Performance or Forward-looking scenarios based upon the reasonable beliefs of the third-party provider are not a guarantee of future performance. Actual results may differ materially from those anticipated in forward-looking or past performance statements. IC Markets makes no representation or warranty and assumes no liability as to the accuracy or completeness of the information provided, nor any loss arising from any investment based on a recommendation, forecast or any information supplied by any third-party.

XAUUSD | Market outlookGold Reserve Diversification: At the LBMA conference, central bank representatives shared that gold purchases are driven by financial and strategic goals.
US Election Impact:
Uncertainty over the upcoming presidential elections, with Trump and Harris closely tied in polls, is prompting banks to hedge risks.
Geopolitical Risks: Tensions in the Middle East are also boosting gold, with Israel expressing readiness to target Iran's military infrastructure.
Price Trends:
Long-term trend: Upward, aiming to break the historical high of 2685.00 . Potential targets: 2750.00 and 2810.00 if consolidation succeeds.
Support and Correction: If the price drops to 2602.00 , long positions toward 2685.00 are favourable. A breakout below 2602.00 could trigger a correction targeting 2546.00 and 2471.00 .
Medium-term trend:
Correction: Last week’s correction did not reach key support at 2575.61–2564.61 . If a reversal occurs, the price could rise to 2685.61 and potentially 2712.70–2701.70 .
Correction Scenario: If another correction develops, the price may revisit 2575.61–2564.61 , followed by growth toward 2625.00 and 2685.00 .

US 100 - LONG
Break out point US100 at 20310 with first target at 20420, I think it will go up to 20925 before seeing a reversal. CAPITALCOM:US100

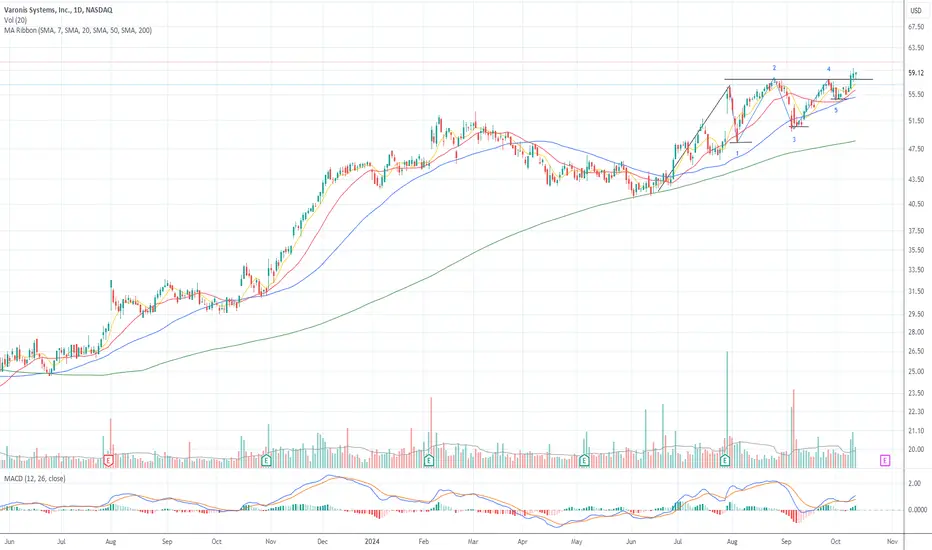
VRNS - VARONISVRNS - No Breakout yet
This is a leader +168% from 2023, a long cup & handle.
A recent consolidation with higher lows and volatility contraction (VCP).
It is just missing a big breakout that did not happen yesterday, will be cautious about that
Entry 57.15
Stop loss 55.55
TP1 30-50%: after 4-5 days
Stop follow up (visual) with EMA 10 or EMA 20
US100 - Cup of Handle LONG Long on US100. Cut of handle pattern, small lateral decline with resistance and entry point 20190, break out of the entire structure at 20310 with second entry. Target and take profit at 20754. CAPITALCOM:US100

US100 LONG - Cup and Handle
Retracement on descending channel with estimated support in the 20066 area, probable break of resistance at 1310. BUY 20325 - TAKE PROFIT 20756.

Will geopolitical tension support oil prices?
Kazakhstan planned to cut its oil output, while Russia reported lower production in Sep, restricting the supply.
Meanwhile, the heightened geopolitical tension in the Middle East increases concerns over oil production and transport.
At the same time, market participants remain optimistic about the US economy, which could support oil demand. Today's NFP release may provide insights regarding the US job markets.
USOIL has significantly recovered from its low last month. The price retested its support at 67.50 USD per barrel before closing above its psychological support at 70.00 USD per barrel.
If USOIL sustains its upward momentum, the price may retest the following resistance at 75.00 USD per barrel.
On the contrary, USOIL may return to 70.00 USD per barrel if the price retraces before its continuation.

US DOLLAR TASharing a us dollar chart here
if we lose 100$ and test it as resistance the next target would be the bottom of the range ( 89 dollars)

USDJPY Analysis: Potential Bullish Bias for the Upcoming Week!USDJPY Analysis: Potential Bullish Bias for the Upcoming Week (Sept 23-29, 2024)
As we look ahead to the coming week, USDJPY appears poised for a potential slightly bullish bias. This outlook is based on a confluence of fundamental factors and current market conditions that favor USD strength relative to the Japanese yen. Below is a breakdown of key drivers supporting this outlook, along with insights that could influence price action.
1. Federal Reserve's Hawkish Stance
One of the key drivers for a potential bullish bias in USDJPY next week is the persistent hawkish tone from the Federal Reserve. Although the Fed opted to pause rate hikes in September, policymakers have indicated that they are open to further tightening if inflationary pressures persist. Recent inflation data in the U.S. showed a slight uptick in the Consumer Price Index (CPI), suggesting that the Fed may still consider additional rate hikes in 2024. Higher U.S. interest rates would continue to bolster the U.S. dollar, driving demand for USDJPY as traders seek yield differentials.
2. Bank of Japan's Dovish Policy
In stark contrast to the Fed, the Bank of Japan (BoJ) remains committed to its ultra-loose monetary policy, including negative interest rates and yield curve control. The BoJ's dovish approach continues to weigh on the Japanese yen, especially in an environment where other major central banks are tightening monetary policy. While some market participants expect the BoJ to consider policy changes in the future, there have been no concrete signals indicating a shift in the near term. This widening policy divergence between the Fed and BoJ is a key factor supporting a bullish outlook for USDJPY.
3. Safe Haven Demand Waning
The yen is traditionally viewed as a safe-haven asset, particularly during periods of global market volatility. However, recent market stability, coupled with optimism surrounding global growth prospects, has reduced demand for the yen as a haven. As risk sentiment improves, investors are more likely to allocate capital into higher-yielding assets, which could further weaken the yen.
Moreover, geopolitical tensions that previously supported yen demand have eased slightly, making USDJPY more likely to drift higher in a low-risk environment.
4. U.S. Treasury Yields Rising
Another factor contributing to the bullish bias in USDJPY is the rise in U.S. Treasury yields. Higher yields on U.S. government bonds make the dollar more attractive to foreign investors, adding upward pressure to USDJPY. The correlation between USDJPY and U.S. Treasury yields is well-documented, and as yields rise, so too does the currency pair. Traders will be closely monitoring U.S. economic data next week, including durable goods orders and GDP figures, to gauge the potential for further yield increases.
5. Technical Analysis: Key Support and Resistance Levels
From a technical perspective, USDJPY is trading within a well-defined range, but with a slight bullish bias as long as it holds above key support at the 147.50 level. A break above the psychological 150.00 level could open the door to further upside, with resistance seen at 151.50. On the downside, failure to hold above 147.50 could lead to a test of lower levels around 146.00. Momentum indicators, including the Relative Strength Index (RSI), are currently neutral but leaning slightly toward overbought territory, suggesting room for further gains before a pullback.
6. U.S. Economic Data Next Week
Next week, market participants will pay close attention to several high-impact economic reports out of the U.S., including the Durable Goods Orders on Tuesday and GDP Growth on Thursday. Positive readings on these metrics could fuel further gains in USDJPY, reinforcing the bullish bias. Conversely, any disappointing data could dampen USD strength and lead to some consolidation in the pair.
Conclusion
Given the combination of hawkish signals from the Fed, the BoJ's ongoing dovish stance, rising U.S. Treasury yields, and waning safe-haven demand, USDJPY appears to have a slightly bullish bias heading into next week. Traders should watch for any shifts in risk sentiment or unexpected economic data that could alter this outlook. The key levels to watch are 147.50 for support and 150.00 for resistance.
Keywords: USDJPY forecast, USDJPY bullish, USDJPY analysis, Bank of Japan policy, Federal Reserve rate hikes, U.S. Treasury yields, Japanese yen, safe-haven demand, forex trading, USDJPY technical analysis, USDJPY key levels, USDJPY next week, trading USDJPY.

Isn't if funny how NVDA is converging on the election?long term wedge pattern playing out...appears to point to the day before the American election. Coincidence?

USD/JPY Forecast: Bullish Bias Expected – Key Factors to Watch.USD/JPY Forecast: Bullish Bias Expected – Key Factors to Watch (20/09/2024)
As we analyze the USD/JPY pair on 20/09/2024, the outlook appears to be slightly bullish for this week and next. Several key drivers are pushing the U.S. dollar higher against the Japanese yen, creating an attractive opportunity for traders. In this article, we’ll break down the fundamental factors behind this forecast and highlight the elements influencing USD/JPY price action in the coming days.
1. US Dollar Strength Bolsters USD/JPY
The strength of the U.S. dollar is a critical factor contributing to the bullish bias in USD/JPY. With the Federal Reserve signaling a commitment to maintaining high interest rates for an extended period, the greenback remains in demand. Fed officials have recently emphasized their concerns about persistent inflation, leading markets to believe that U.S. interest rates will stay elevated for longer than previously expected.
This hawkish monetary stance, coupled with strong economic data, has made the U.S. dollar more attractive to investors. As a result, USD/JPY has been moving higher, with the strong dollar likely to continue exerting upward pressure on the pair.
Key SEO keywords: USD/JPY forecast, US dollar strength, Federal Reserve policy, interest rate hike, USD/JPY price action.
2. Dovish Bank of Japan Keeps the Yen Weak
On the other side of the equation, the Japanese yen remains under pressure due to the Bank of Japan’s (BoJ) ultra-loose monetary policy. The BoJ has shown no signs of tightening monetary policy in the near term, despite global inflationary trends. Japan’s central bank continues to prioritize economic support, maintaining low interest rates while avoiding any drastic policy shifts.
This dovish stance contrasts sharply with the Federal Reserve’s hawkish policy, widening the interest rate differential between the U.S. and Japan. This is a major driver of USD/JPY’s bullish outlook, as investors gravitate towards the higher-yielding U.S. dollar over the lower-yielding yen.
Key SEO keywords: Bank of Japan policy, Japanese yen weakness, dovish BoJ, USD/JPY interest rate differential, yen depreciation.
3. Interest Rate Differentials Favor USD/JPY Upside
One of the most important factors pushing USD/JPY higher is the widening interest rate differential between the U.S. and Japan. While U.S. Treasury yields remain attractive, the yield on Japanese government bonds remains low due to the BoJ’s dovish policy stance. This gap in yields makes the U.S. dollar more appealing for investors seeking better returns.
The widening interest rate gap is a key bullish signal for USD/JPY, as capital continues to flow into U.S. dollar-denominated assets. As long as the Federal Reserve maintains its hawkish tone, and the BoJ remains accommodative, this dynamic will likely support the bullish bias for USD/JPY.
Key SEO keywords: Interest rate differentials, U.S. Treasury yields, Japanese bond yields, USD/JPY bullish outlook, capital flows into USD.
4. Japanese Economic Weakness Adding Pressure on the Yen
Another factor supporting the bullish bias for USD/JPY is the ongoing weakness in the Japanese economy. Japan has struggled with slow economic growth and weak inflation, further justifying the BoJ’s cautious approach to monetary policy. Domestic consumption remains low, and Japan’s economic recovery has been uneven.
As a result, the Japanese yen continues to face downside pressure, while the U.S. dollar benefits from stronger economic fundamentals. This divergence between the U.S. and Japanese economies adds to the case for a stronger USD/JPY in the coming weeks.
Key SEO keywords: Japanese economic weakness, low inflation in Japan, weak yen, Bank of Japan policy, USD/JPY forecast.
5. USD/JPY Technical Analysis Suggests Further Upside Potential
From a technical standpoint, USD/JPY is showing signs of further upside. The pair has been testing key resistance levels, and if these levels are broken, we could see a more significant bullish move. The recent price action has shown strength, with USD/JPY consistently finding support at higher lows.
Traders should watch for a potential breakout above these resistance zones, as it could signal further gains for USD/JPY. With strong fundamentals supporting the pair, the technical outlook aligns with the overall bullish bias.
Key SEO keywords: USD/JPY technical analysis, key resistance levels, USD/JPY price action, bullish trend, support and resistance.
Conclusion: Bullish Bias Expected for USD/JPY
In conclusion, several fundamental and technical factors support a slightly bullish bias for USD/JPY over the next couple of weeks. The ongoing strength of the U.S. dollar, the dovish stance of the Bank of Japan, favorable interest rate differentials, and Japan’s economic challenges all point towards further upside potential for USD/JPY.
Traders and investors should closely monitor these key drivers as they make their trading decisions. As always, staying updated on central bank policies, economic data, and technical signals will be crucial in navigating the USD/JPY price action during this period.
Key SEO keywords: USD/JPY forecast, bullish bias, USD/JPY key drivers, US dollar strength, Bank of Japan policy, interest rate differential, USD/JPY technical analysis.

Bearish drop off pullback resistance?USO/USD is reacting off the resistance level which is a pullback resistance and could drop from this level to our take profit.
Entry: 72.19
Why we like it:
There is a pullback resistance level.
Stop loss: 74.66
Why we like it:
There is an overlap resistance level that is slightly below the 78.6% Fibonacci retracement.
Take profit: 69.80
Why we like it:
There is a pullback support level that lines up with the 38.2% Fibonacci retracement.
Enjoying your TradingView experience? Review us!
Please be advised that the information presented on TradingView is provided to Vantage (‘Vantage Global Limited’, ‘we’) by a third-party provider (‘Everest Fortune Group’). Please be reminded that you are solely responsible for the trading decisions on your account. There is a very high degree of risk involved in trading. Any information and/or content is intended entirely for research, educational and informational purposes only and does not constitute investment or consultation advice or investment strategy. The information is not tailored to the investment needs of any specific person and therefore does not involve a consideration of any of the investment objectives, financial situation or needs of any viewer that may receive it. Kindly also note that past performance is not a reliable indicator of future results. Actual results may differ materially from those anticipated in forward-looking or past performance statements. We assume no liability as to the accuracy or completeness of any of the information and/or content provided herein and the Company cannot be held responsible for any omission, mistake nor for any loss or damage including without limitation to any loss of profit which may arise from reliance on any information supplied by Everest Fortune Group.

Could price bounce from here?US Dollar Index (DXY) is falling towards the pivot which has been identified as a pullback support and could bounce to the 1st resistance that acts as a pullback resistance.
Pivot: 100.54
1st Support: 100.21
1st Resistance: 101.25
Risk Warning:
Trading Forex and CFDs carries a high level of risk to your capital and you should only trade with money you can afford to lose. Trading Forex and CFDs may not be suitable for all investors, so please ensure that you fully understand the risks involved and seek independent advice if necessary.
Disclaimer:
The above opinions given constitute general market commentary, and do not constitute the opinion or advice of IC Markets or any form of personal or investment advice.
Any opinions, news, research, analyses, prices, other information, or links to third-party sites contained on this website are provided on an "as-is" basis, are intended only to be informative, is not an advice nor a recommendation, nor research, or a record of our trading prices, or an offer of, or solicitation for a transaction in any financial instrument and thus should not be treated as such. The information provided does not involve any specific investment objectives, financial situation and needs of any specific person who may receive it. Please be aware, that past performance is not a reliable indicator of future performance and/or results. Past Performance or Forward-looking scenarios based upon the reasonable beliefs of the third-party provider are not a guarantee of future performance. Actual results may differ materially from those anticipated in forward-looking or past performance statements. IC Markets makes no representation or warranty and assumes no liability as to the accuracy or completeness of the information provided, nor any loss arising from any investment based on a recommendation, forecast or any information supplied by any third-party.

Falling towards 50% Fibonacci support?USOUSD is falling towards the support level that is an overlap support that lines up with the 50% Fibonacci retracement and could reverse from this level to our take profit.
Entry: 67.83
Why we like it:
There is an overlap support level that lines up with the 50% Fibonacci retracement.
Stop loss: 66.26
Why we like it:
There is a pullback support level.
Take profit: 70.43
Why we like it:
There is a pullback resistance level.
Enjoying your TradingView experience? Review us!
Please be advised that the information presented on TradingView is provided to Vantage (‘Vantage Global Limited’, ‘we’) by a third-party provider (‘Everest Fortune Group’). Please be reminded that you are solely responsible for the trading decisions on your account. There is a very high degree of risk involved in trading. Any information and/or content is intended entirely for research, educational and informational purposes only and does not constitute investment or consultation advice or investment strategy. The information is not tailored to the investment needs of any specific person and therefore does not involve a consideration of any of the investment objectives, financial situation or needs of any viewer that may receive it. Kindly also note that past performance is not a reliable indicator of future results. Actual results may differ materially from those anticipated in forward-looking or past performance statements. We assume no liability as to the accuracy or completeness of any of the information and/or content provided herein and the Company cannot be held responsible for any omission, mistake nor for any loss or damage including without limitation to any loss of profit which may arise from reliance on any information supplied by Everest Fortune Group.

SPX & Bitcoin Correlation & US presidential election #Spx 1D chart;
Let me first talk about the importance of the S&P 500 chart;
They are positively correlated (i.e. they move together):
*#Nasdaq100
*#Oil
*#Bitcoin (sometimes)
Now, what I want to draw your attention to is that just before the presidential elections, in September and October, there was always a decline. After the elections, there has been a continuous upward trend in the first 100 days.
Not counting the 2008 world economic crisis, this has never changed in the last 3 elections. Even after the 2008 crisis, after falling for a while, it started to rise immediately afterwards. The data we are evaluating here is the first 100 days.
In September 2024, I indicated the decline with an orange circle
With a decline in October, a long-term uptrend may begin.
If Bitcoin also shows a correlation here, which is my expectation as in the #Btc chart I drew earlier, we will start a permanent uptrend after suffering for another 1 month.
SP500 end of first 100 days data after the US Presidential election:
Post 2020 Election (Joe Biden): +17%
Post 2016 Election (Donald Trump): +10%
After 2012 Election (Barack Obama - Second Term): +10%
After 2008 Election (Barack Obama - First Term): -19%

US30 | Trade ideaKey Points:
Tesla: Shares fell 1.6% after a report that the company plans to produce a six-seat Model Y in China by late 2025.
Boeing: Dropped 7.3% following a downgrade from Wells Fargo to "underweight" from "equal weight."
Nvidia: Slumped nearly 10%, wiping out a record $279 billion in market value, marking the largest single-day decline for a U.S. company.
U.S. Manufacturing: Edged up in August from an eight-month low but remained subdued, according to ISM data.
Market Performance:
S&P 500 fell 2.1%
Nasdaq dropped 3.3%
Dow declined 1.5%
This marks the biggest daily percentage decline for these indexes since early August.
Nine out of 11 S&P 500 sectors fell, with technology, energy, communication services, and materials leading the decline.
Market Sentiment: Weakened amid concerns about the Federal Reserve’s interest rate decisions, with September being historically one of the worst months for stock market performance.
Volatility: The CBOE Volatility Index (VIX) jumped 33.2% to 20.72, the highest close since early August.
Trading Volume: Totaled 12.14 billion shares across U.S. exchanges, above the 20-day moving average of nearly 11 billion.
Labor Market: Traders are awaiting labor market reports ahead of the August non-farm payrolls data.
Fed Meeting: Scheduled for Sept. 17-18, with a 63% chance of a 25-basis point rate cut and a 37% chance of a 50-basis point cut, according to the CME FedWatch Tool.
Market Breadth: On the NYSE, declining issues outnumbered advancers by 2.52-to-1, while on the Nasdaq, decliners outnumbered advancers by 3.5-to-1.

Navigating the Nasdaq's Turbulence: A Peek into the Week AheadAs we head into the trading week, let’s zero in on some critical levels on the CME_MINI:NQ1! Nasdaq that are making the rounds in savvy financial circles. With a bit of a bearish vibe from the get-go, understanding these might just set the stage for some strategic plays.
Top Tier: 19,300 to 19,400
Keep your eyes peeled on this upper bracket. It's where the ceiling might just come crashing down with selling pressure. A lot hinges on how prices react here—will they retreat or break through unexpectedly?
Middle Ground: Around 19,200
Here lies the Fair Value Gap, a zone that often acts as a decision-making hub for the bulls and bears alike. If prices struggle to push past this, it might just reinforce the gloomy outlook for the week.
Entry Alert: Near 19,100
Thinking of going short? This could be your spot. The Optimal Trade Entry point around 19,100 is where the action could heat up, signaling a strong entry if bearish momentum continues.
Watch Your Step: Around 18,730
This level has history. It's served as a balance point before and could either prop up prices for a rebound or give way under bearish pressure, leading to further declines.
Base Camp: 18,300 to 18,550
Down here, if the floor gives way, expect the bears to rush in even stronger. It's a critical zone to gauge just how far the current sentiment could drag the market down.
___________________
Abbreviations
D FVG - Daily Fair Value Gap
D OTE - Daily Optimal Trade Entry
Eq 4h - Equilibrium 4 hours
OTE 4h - Optimal Trade Entry 4 hours
NDOG - New Day/Week Opening Gap

NASDAQ100US100 may find support here, I am expecting a continuation of bull move from here, I would be happy to see new highs before USA election day, 06 November 2024. This is a swing trade, use proper risk management, sniper entry or nothing. Lets Download Success .

#Bitcoin to US Narrow Money Supply (M1) ratio 1W chart;#Bitcoin to US Narrow Money Supply (M1) ratio 1W chart;
I suggest you read it to the end.
This type of chart is used to understand how much Bitcoin has gained or lost in value relative to the Narrow Money Supply in the US.
In the chart, the total market capitalization of Bitcoin is plotted against the US Narrow Money Supply (M1). M1 includes money in circulation (cash) and demand deposits at banks. This type of ratio can help to understand how valuable Bitcoin is in the macroeconomic environment.
In a nutshell;
If the chart is rising : Bitcoin is rising.
If the chart is falling : The US money supply is increasing.
If the US money supply increases and Bitcoin's market capitalization remains the same, then the chart will fall again. It means that Bitcoin is losing value against the US dollar.
In short, we need to look more carefully at what is causing the decline.
When does the US Narrow Money Supply (M1) appreciate?
- Raising interest rates
- Economic empowerment
- Liquidity reduction
The first 2 points above are not hard to guess, but let's elaborate on point 3;
The FED may implement monetary tightening policies to reduce the amount of dollars in the market. In this case, the money supply may contract and the value of the dollar may rise. This is called illiquidity.
To summarize;
An appreciation of the US money supply often puts pressure on risky assets such as Bitcoin and can depress their prices.
There are also important historical notes above the chart
The white trend line is important . Because every time it comes here, we see that it experiences strong price movements with important news.
Therefore, it may be necessary to follow the agenda closely when it comes to this trend line again.

US500 - Roadmap to 6kHello TradingView Family / Fellow Traders. This is Richard, also known as theSignalyst.
📈 US500 has been overall bullish, trading within the rising channel marked in red.
As long as the $5000 round number holds, I expect further bullish continuation towards the upper bound of the channel and $6000 round number.
📚 Always follow your trading plan regarding entry, risk management, and trade management.
Good luck!
