USD JPY ANALYSIS FOR TODAY - PULLBACKWe miht have a very strong rejection toward the red trendline and have a strong pullback,
US

Dollar Index REVERSEHello, Traders!
With the beginning of the new week, DXY shows some reversal signs. For the past 2 weeks, this index has found solid support above 93.
On a local 4H Timeframe Support and Resistance zones are created, so we need to pay close attention when index is near those levels.
If the breakout occurs, the FIRST target is 94.5 level.
Good Luck!

correction setup my last idea AB = CD for DXY still valid this is the bullish correction in general view
for lower time frame we expect bull back as shown on the chart hit support

POTENTIAL CUP AND HANDLE PATTERN ON MSFTProjecting a Potential Breakout MSFT, Forming CUP AND HANDLE PATTERN, after a Good Run from 195 to 217, the stocks consolidate since JUlY 17, If It managed to Break 217 with Volume, 230's Level in sight

USDCAD: Multi Time Frame Analysis & Trading Plan
USDCAD is currently trading in a strong bearish trend .
during the last few days, we saw a nice pullback though.
friday's candle closed on a resistance line of a falling channel .
matching with fib.levels of the last legs and a horizontal structure on the left,
the price is now clearly trading within a strong structure resistance area.
to catch a bearish continuation I would suggest being focused on a bearish flag formation on 1H.
we need a 1H candle close below its support to initiate short.
target levels:
1.332
1.326
stop will be above the last flag's high.
in case of a bullish continuation above the underlined resistance cluster,
setup will be invalid.

USDCAD: Multi Time Frame Analysis & Trading Plan
USDCAD is currently trading in a strong bearish trend.
during the last few days, we saw a nice pullback though.
friday's candle closed on a resistance line of a falling channel.
matching with fib.levels of the last legs and a horizontal structure on the left,
the price is now clearly trading within a strong structure resistance area.
to catch a bearish continuation I would suggest being focused on a bearish flag formation on 1H.
we need a 1H candle close below its support to initiate short.
target levels:
1.332
1.326
stop will be above the last flag's high.
in case of a bullish continuation above the underlined resistance cluster,
setup will be invalid.

March '18, Oct '18, May '19, Feb '20, Now, Correction or Crash?The 2hr chart shows the Hull above BOTH the EMA 21 and the SMA 50. When this happens (rarely), downward pressure on price occurs rather soon. Correction or Crash? Seeing how this plays out, especially with the Fed meeting, Congress' Tech Hearing, AMZN/AAPL earnings, GDP, all before end of week= Fireworks.

EUR USD LONG STRONG IMPACT ON USD and FURTHER INFLATION of $Hi guys.
Today i'm going to post TA regarding LONG on EUR/USD ratio which will continue with increment EURO OVER US Dollar for several reasons.
Impact on US economy starting from Jan.30th was 40.000 billion USD (as SPX index fell from 3400--->2200) index points.
Then FED started to print and print money which (as we all know doesn't have coverage in gold since 1971).
FED pumped money in order to stop further collision of S&P 500, but with several trillions few times which basically just slowed down the drop and nothing but that.
We are witnessing the collapse of the United States economy, because they were supposed to enter the recession of 2015 to 2016 when the index of their economy was at a maximum of 1867 index points, which is the mathematical maximum of the price and the beginning of the recession, which is a normal thing in the economy. and are called "economic cycles"
Then came the so-called trend reversal.
Instead, bankers pumped in extra money by creating a so-called "hype" and artificial continuous growth until January 30, 2020 inflated the stock exchange index from 1867 to 3300 index points, which is 76.7% of artificial pumping of the economic index.
This is an obvious manipulation and any somewhat objective and competent stock market expert can substantiate my claim about the US recession.
On January 30, 2020, the US economy experienced a dizzying decline in less than 45 days in the form of: 3300 ----> 2400 index points, which is 37.5% of the nominal loss in dollars, ie 25,000 billion dollars.
The total amount of money on the stock market is 67.5 trillion dollars. (67.5x10 ^ 12) $.
So we now have $ 67.5 trillion x 0.375 (nominal loss caused by a fall of 3300-2400) = $ 67.5 trillion ($ 67.5x10 ^ 12) - $ 25 trillion ($ 25X10 ^ 12) = 67.5T-25T = $ 42.5 trillion at 2400 index points.
The decline is continuous and unstoppable!
We are now "at" 2,400 points on the S&P500, (the backbone of the US economy), and "going to 1867" (which is actually the mathematical maximum) and the "beginning" of the recession, which is actually 33% less than the current position (2400 points) and further devaluation of the dollar continues (since in the meantime there has been a jump of 10%. But the bankers want MORE !!!
They can print as much as they want, but have no cover in gold since ’72 .we
Now we are moving towards a new fall, and with further calculations we are going to 2700/1867 = 44% of the new blow to the dollar on the other 42.5T + 10% jump, ie 47 trillion dollars.
That's 47T X 0.44 (44%) devaluation = 20.6 trillion "stock money".
We go further down due to the yo-yo effect of an additional 77.67% of artificial pumping by banks, ie. CALCULATIONS THAT ARE DEADLY PER DOLLAR, which is 20.6 trillion x 0.77 (76.7%) of artificial pumping by banks), then the yo-yo effect comes to the fore and is reflected in the already volatile price, creating panic sales and complete collapse.
That's $ 20.6 trillion - $ 15.87 trillion yo-yo effect = $ 4.73 trillion.
That’s $ 4.73 trillion versus the original $ 67.5 trillion.
THIS IS A COMPLETE COLLAPSE OF THE DOLLAR AND THEREFORE THE END OF US DOMINATION !!!
Then, the United States has two choices: an "implosion" (which is unlikely) or a large-scale war that is the only thing that can "pull" them out of the inevitable orchestrated catastrophe and the fall of the American empire that lived on someone else's history. built the economy on kidnapping, classically cowboy.
Only 8 years of truce since its inception in 1776. during the 244th history of the then exiled bandits, rapists and perpetrators of the worst crimes ended in the US where millions of Indians were killed to conquer America and 100 years of war against the Indians because there were simply too many and the British could not so much they “press” across the ocean.
The Indians made a truce with the British 138 times and the British broke it the same number of times.
Elem, let's go back to the downfall of the USA (which is horrible, because it will be reflected on the whole world, because they are:
US GDP: $ 22 trillion.
CHINA GDP $ 14 trillion
It is followed by Germany, Russia, France and Italy:
Although the strongest in the EU, Germany has 1/5 of China's GDP, which is not so significant compared to Chinese and US GDP (almost $ 40 trillion)
Who can have that much money to sell $ 25,000 billion worth of stocks, stocks and bonds at once?
Only the state and the strongest "hedge funds in the world:
Black Rock 6.5T $ + 14 T $ "supervised"
Vanguard 5.5T $ + 11.5 T $ "supervises"
After that come JP Morgan with $ 2.6T ($ 1.1T cash, $ 1.6T invested) and Goldman Sachs as the two largest US banks.
The total amount of dollars in circulation is $ 86.5 trillion (86.5x10 ^ 12)
The current value of the stock index is 2700 points (re-entry of people and "price reversal", ie price reversal, given that it is more and more expensive (mathematically speaking) to maintain an artificially continuous price level that is unsustainable at 50% above the mathematical maximum .
It is getting more and more expensive and leads to implosion, that is. collapsing into itself like a tower of cards.
I note that the phenomenon of the corona has also reigned ever since, since the stock market started to sink on January 30, 2020, and the Corona has been mentioned since 2 months ago.
The corona phenomenon leads us to complete isolation, closure, total lockdown of individual cities and states.
Whether it is a coincidence or not is your view and a matter of personal interpretation.
The technology reached its 2017 maximum with 7nm technology.
One technological year is roughly equivalent to 4-5 calendar years (which supports the analysis of the pumping of the American economy).
Who can have that much money to sell 25T worth of stocks, stocks, bonds?
Just the state.
Go LONG ON EUR/USD or CHF/USD
Good luck and thanks for reading.
If you find this artice useful and interesting, feel free to upvote.

EUR/USD SHORT OPPORTUNITY: MASSIVE PROFIT?Technical
The price has touched the major resistance level just recently. Should the levels hit the 1.19 resistance level again we may possibly see a pullback to the downside. This also means a decent chunk of profits we can expect. Please wait for the price to retest and give us more information before actually shorting a position.
Fundamental
We have seen the recent low GDP, high unemployment, and COVID cases continue to rise in the States. Which also means the dollar will continue to weaken. Fundamentally it should be a long call. Do take note of its fundamental aspect.
Do your own due diligence
For more content follow me on TradingView

NZD/USD Heads & Shoulders Forming? (Updated)Looking at the weekly (and monthly) we notice a forming a possible Heads & Shoulders. Assuming the H&S forms with confirmation, we can prepare a long order after its completion of the pattern. As of now, I will be short on this one based on price action.
Do note on the fundamental side of things that the Dollar (U.S.) is weakening. Recent low GDP statements, rising COVID cases as well as high-unemployment are factors we should consider before executing a trade.
Do your own due diligence, don't take me word for word I'm only a newbie with a passion for trading!
For more analysis follow me on TradingView. If you are feeling generous, donate some TradingView coins! It motivates me to keep posting daily.


USDCAD: Fib.Analysis & Key Levels
it looks like USDCAD finally broke below the major rising trend line.
sellers show their willingness to push lower.
here are the next goals:
1.30 - 1.31 zone is the first support.
it is based on structure and 618 of the major bullish weekly leg.
1.28 - 1.29 zone is the second support.
it is purely based on structure.
it looks like the market will soon reach one of these supports so we keep being bearish biased here.
1.33 - 1.34 is the closest resistance cluster.
it is based on a broken trendline, horizontal structure and 50 of the major bullish impulse.
because our key levels are quite wide, trade them only with confirmation on a lower time frame.


EURUSD: Candlesticks & Scenario For Next Week
after 1 month long bullish rally on EURUSD,
it looks like we finally see a strong reversal signal.
on a daily, the price went rejected after an attempt to violate a key weekly resistance
and the previous daily bullish candle was eaten by a strong bearish engulfing candle.
in conjunction with rsi divergence, it looks like the market is ready for a pullback.
for now, the first goal is 1.1625. it's based on the 382 retracement of the last bullish leg.
I guess the price will need at least one week to reach that goal.
please note, that it is not a sell signal.
I would suggest looking for a safe entry on a lower time frame.

SPX to Close -3.5% off Highs; 107% of GDP is Debt..SPX to Close -3.5% off of highs while the debt to GDP ratio remains at all time highs. What a great time to have risk-management in check, and not speculate with money we can't afford to lose. If you're outlook is that we've made a true recovery, feel free to post some charts and supporting dialogue below. I would love to hear both bullish and bearish opinions of the current macroeconomic situation as of Jul ending.

EURUSD Weekly Downtrend Breakoutlast week closed slightly above the trendline, this week is barrelling up and looks like it will close above too.

USDJPY On Key Level! What's Next???
USDJPY has reached a very strong major key level.
the chances that the market will retrace from that level are very high.
to catch a bullish move pay attention to a completed head and shoulders pattern on 1H.
105.15 is its neckline. this level must be broken to the upside first,
only then we can buy the market.
initial target:
106.6
in case of a bearish violation of the head level, setup will be invalid.

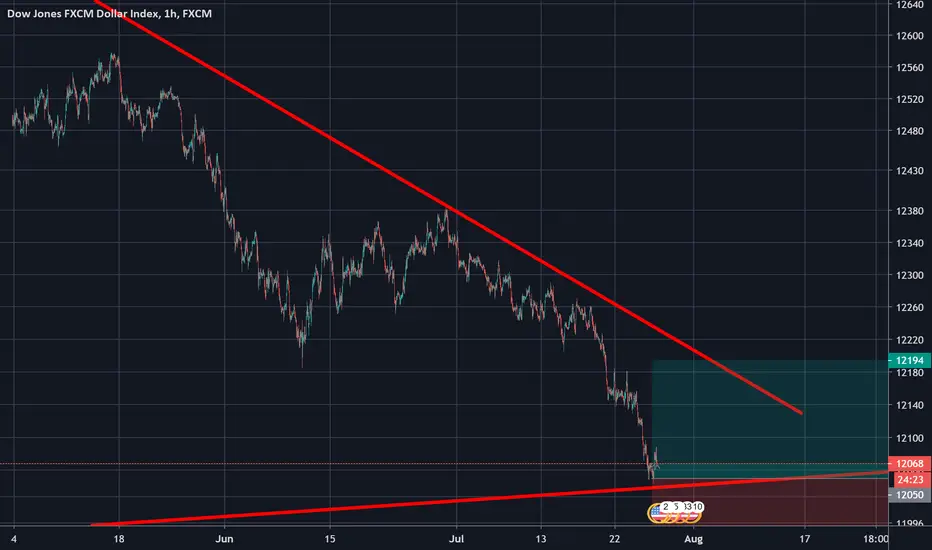
Before Breakout The Fed announcement at 9:30 p.m. can bounce sharply once the resistance diagonal line breaks up

US DOLLAR BUY ANALYSIS US DOLLAR IS AT A 2 YEAR LOW. THE TECHNICAL ANALYSIS IS SHOWING A REVERSAL INTO THE UP SIDE. BUY US DOLLAR
DXY ShortAs of now I don't see momentum on the U.S. Dollar to turn bullish. If you've been selling you have been doing a great thing. With the health crisis and what is going on in the U.S. alot of its pairs are also bearish for the most part.


rejection setup we have strong resistance area we expect rejection to support levels as shown on the chart
