DOW JONES SHORT. Good Morning traders i am looking to go short on DJ provided that we break a major support and we get a retest and a rejection.
US

GBPUSD: Where are we going?
hey guys,
confirmed daily candle close above the previous June's structure high.
now bulls will most likely push higher.
next strong resistances:
1.294 - 1.302 area based on a projected harmonic movement, fib.extension confluence and structure
1.315 - 1.322 area based on a fib.extension confluence and structure
to short wisely from these levels, always look for confirmation on lower time frames.

still having some space to going down before jumping up sharpUS index gonna have deeper consolidate before getting ready for long. maybe we need to wait for reaching $93 price. then we can look for big long trade.


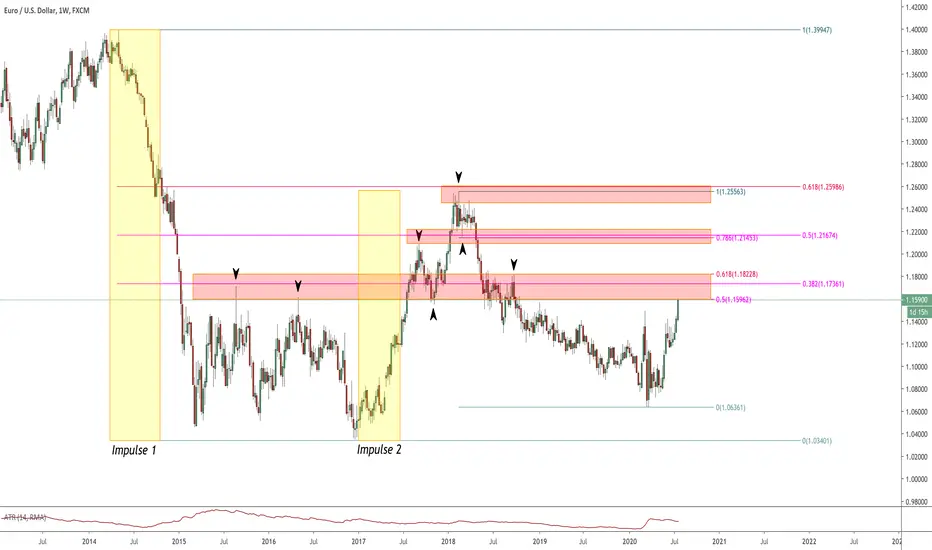
EURUSD: Fib.Analysis & Major Weekly Levels
hey guys,
EURUSD is now very volatile and easily breaks daily structure resistances.
you may wonder when the market will stop.
here just by the means of fibs. and structure I found key resistance clusters to look at.
for drawing fib.levels I took major 2014-2015's bearish rally and 2017-2018's bullish rally.
1.16 - 1.18 is the first strong resistance cluster.
it is based on a price action of 2015/2016/2017/2018 and fib. levels of the above-mentioned impulses.
1.21 - 1.22 is the second resistance cluster.
it is based on a price action of 2017/2018 and fib.confluence of 0.5 and 0.786
1.245 - 1.26 is the third resistance cluster.
it is based on a 5 year's high and 618 of the major leg.
the market should at least stop within these levels and retracements will be highly probable.
trade only with a confirmation on lower time frames.
USD CHF ANALYSIS FOR TODAY We should enter the market when we will see a doji with an important green volume to confirm our opinion and for sure there will be a great profit at the end of the day

Short is comeingHi traders
This worked out very well
and we r in PRZ (potential Reverse Zone)
TP's are in
but watch for sell signal like double top with slow rsi on the 2nd top and so on
like in 9 june high
Drive Safe

USD CNH | 1W | Technical AnalysisHelicopter view of USDCNH currency pair, and some ideas on how to act upon the recent price movements.

EURUSD: Price Action & Scenario for Next Week
EURUSD is trading within a rising parallel channel on 4H.
the resistance of the channel was reached on Wednesday and the market set it's last higher high there.
during the next two days the pair started to consolidate:
with a sequence of three equal highs and two equal lows, the price is stuck in a narrow horizontal trading range.
next week, with a high probability the price will retrace one more time from the horizontal resistance.
then sellers will face with a buying pressure from a channel's and range's supports.
consider this range for potential quick trades next week.
to catch the next wave, I would suggest waiting for a violation of the range.
we can not estimate how long the market will trade there, so it would be better to just wait.
have a great weekend!!!

DOLLAR INDEX (DXY) Update & Important Decision Ahead!!!
DXY is retesting summer's structure low.
the price is currently consolidating within a narrow horizontal decision range.
because the current trend is bearish, I am bearish biased on greenback.
in case of a violation of the range to the downside, bearish rally will most likely continue.
next goals will be:
95.4 - daily resistance
94.8 - year's low
in case of a bullish violation of the range, USD may start recovering.
96.9 will be the first goal.
for now it is hard to predict with high accuracy the next usd move, so let the market decide first and then just act accordingly.


EURUSD: Year's High AHEAD!!! Key Levels & Scenarios
EURUSD is approaching a key daily structure resistance.
1.15 is year's high, short rally from that level was just crazy in march.
we don't know how the market will react this time, so we must be prepared for both scenarios:
in case of a bullish violation of the underlined resistance (daily higher high higher close)
the pair will most likely keep growing.
next midterm resistances will be:
1.155
1.160
if the structure will be respected (some reversal formation on lower timeframes)
the market may retrace.
closest midterm supports will be:
1.137
1.130
of course, bias right now is bullish, but it is too late to jump in.
let's patiently wait and see whats gonna happen.


NZDUSD: Channel Breakout & Bearish Continuation
hey guys,
NZDUSD has broken below a rising parallel channel.
setting a lower high, the price broke below a minor horizontal support as well.
now I am planning to short the market on retest.
sell zone will be between a broken support of the channel and minor horizontal support.
target levels:
0.6509
0.6485

EURUSD REVERSAL??!?This is not one of my favorite patterns but it's there for your viewing. It makes sense and coincides with my call of last week's GBPUSD sell off.
Let me know what you think.

