USOIL | Long ideaUSOIL big support zone coming up!
Will be looking for long positions when price reverses!
Let me know what you think!
Trade with patients and manage your risk at all times!
US

XAUUSD US GDP) ANALYSIS🤷hello traders what do you think about this analysis trading ideas 💡😁💡
Gold rallies toward 'golden cross' after defying bearish signal
Nov 29, 202316:08 GMT+5
By Myra P. Saefong
Precious metal trades near highest since May
Gold futures have climbed to their highest prices since May, just eight weeks after a death cross in prices signaled the potential for further weakness.
That marks a shift in the market toward a bullish indicator known as a "golden cross," which happens when a short-term moving average climbs past a long-term moving average.
Gold futures were on track to soon reach that technical milestone. As of Tuesday, most-active futures (GC00) saw the 50-day moving average at $1,947.82 and its 200-day moving average at $1,952.17, according to Dow Jones Market Data. The December gold futures contract (GCZ23) settled at $2,040 an ounce on Comex, the highest finish since May 9.
The gold-backed SPDR Gold Shares exchange-traded fund GLD, however, is much closer to reaching its golden cross. In Tuesday trading, the ETF's 50-day moving average was at $179.70 and its 200-day moving average climbed to $180.12.
"Whether or not gold enters the golden cross, the investment case for gold is strong," said Joy Yang, head of product management and marketing at index provider MarketVector.

Gold Next Move ? (XAUUSD)Investors in Asia, meanwhile, took comments from erstwhile Federal Reserve hawk Christopher Waller as perhaps a signal of another era-shift, as he flagged that U.S. interest rates could be cut in the months ahead.
A rally in bonds and slide in the dollar that has run for weeks in the afterglow of a benign U.S. inflation report extended in Asia in the wake of Waller's remarks.
Two-year Treasury yields fell to a four-month low just below 4.70%. Ten-year Treasury yields hit a two-month low of 4.28%.
Interest rate futures price more than 100 basis points of cuts next year and a 40% chance they begin as soon a March.
The dollar's slide led to multi-month highs for the yen, euro, sterling and Swiss franc against the greenback and sent spot gold, in dollars, to its highest since May.

GBP/USD Reaches New Peak Amid Strong Economic Signals from UKThe GBP/USD exchange rate surged to a twelve-week peak recently, riding on improved consumer confidence and a positive business outlook, despite persistent recessionary pressures. This upward movement, with the pound sterling hitting 1.2615 against the US dollar, reflects a favorable response to the latest S&P Global/CIPS data. Additionally, a sell-off in Gilts bolstered bond yields, contributing to the market's optimistic stance.
Amidst mixed economic signals from both the UK and the US, the GBP/USD pair maintained its strength, trading at 1.2606. In the UK, while inflation displayed signs of cooling down, it remained notably higher than the Bank of England's target rate, registering at 4.6%. The recent Chancellor’s Autumn Statement offered a balanced perspective on growth and inflation, steering a path of cautious optimism. BoE Chief Economist Huw Pill's reiteration of the central bank's commitment to combatting inflation further solidified market sentiments.
Looking forward, market players are eagerly anticipating further insights and crucial US economic reports, including Consumer Confidence and ISM Manufacturing PMI and how will they compare from the ones from UK These upcoming factors are anticipated to wield significant influence on the future movements of the GBP/USD exchange rate.
In technical terms, indicators such as RSI and MACD are signaling Buy, reinforcing the ongoing trend. If the current trajectory persists, the price could potentially ascend to levels around 1.2733, with a probable pivot point at 1.2583. However, there might be a downside risk, with potential drops to support levels at 1.2458, indicative of a cautious market sentiment amid the evolving economic landscape.
Risk Disclosure: Trading Foreign Exchange (Forex) and Contracts of Difference (CFD's) carries a high level of risk. By registering and signing up, any client affirms their understanding of their own personal accountability for all transactions performed within their account and recognizes the risks associated with trading on such markets and on such sites. Furthermore, one understands that the company carries zero influence over transactions, markets, and trading signals, therefore, cannot be held liable nor guarantee any profits or losses.

US & Headline CPI - October Release/Overview US CPI
US Headline and Core CPI for October both came in lower than expected (decrease).
US Headline CPI:
YoY – Actual 3.24% / Exp. 3.3% / Prev. 3.7% (Green on chart)
US Core CPI:
YoY – Actual 4.02% / Exp. 4.2% / Prev. 4.13% (Blue on chart)
The chart below illustrates the direction of the current YoY down trend for both Headline and Core CPI however we are still not at the historical moderate levels of inflation desired. You can see these moderate levels of inflation between 1 – 3% from 2002 – 2020 below.
Nice to see the Core CPI come down, almost down, into the moderate historical averages
PUKA

USDX - BULLISH SCENARIOThe US Dollar index is currently positioned near crucial support levels, including the 38% retracement from July 2023 lows to October 2023 highs, alongside the previous descending channel trend line and support from the 50% retracement, 200-day moving average (DMA), and a potential bull flag pattern.
Despite recent declines due to factors like a slightly weaker Consumer Price Index (CPI), reduced yields, and a general stock market rally, these support levels might prove stronger than anticipated. With the stock market vulnerable to a near-term pullback and upcoming European Purchasing Managers' Index (PMI) releases, the narrative of "USA exceptionalism" could persist.
A significant bullish signal for the US Dollar index would be a rally above the 50-day moving average (DMA) at approximately the 105.75 level.

USD/CAD Toward 1.39 after US Data?The USD/CAD pair has attracted buying interest, maintaining modest gains just below the 1.3700 level. Declining crude oil prices and the strengthening of the US dollar contribute to this dynamic. From a technical perspective, the 50-day Simple Moving Average (SMA) support has been defended, but the lack of sustained support requires caution. A break below the support could lead to deeper losses. Conversely, sustained strength beyond 1.3710 could trigger a short-covering move, but further upward movements may be seen as selling opportunities. The key level of 1.3800 will be crucial; surpassing it will shift the short-term bias in favor of bulls, with the goal of reaching 1.3900, the highest level since May 2020.
In fact, on a daily basis, the price is moving in a resistance zone at the 1.37 level, supported by an uptrend channel. My current bias is long since the price is bouncing off the intersection of two daily trendlines. However, before entering, I will wait for US data before the opening of the American market. Subsequently, if my view is supported by the data, I will evaluate and look for a long entry with a target of around 1.39-1.40. Comment and leave a like, greetings from Nicola, the CEO of Forex48 Trading Academy.

DXY - (very!) Long; Welcome to the "new" American Century!Globalization is dead.
The fat lady has sang, the dirt is piled high next to the hole in the ground, obituaries read, notices had been long mailed to all the parties concerned. All there is left to do now is to show up at the funeral - provided you are not too busy starving or freezing to death, or otherwise engaged with similarly pressing diversions.
This IS the end of the world, as far as those currently alive came to know it.
How could one tell? ... By simply doing the math - while reflecting on the known laws of physics.
The following is more of a brief recap, rather than short term trading advise. Nevertheless, if in doubt, this is a USD Long call, the size of Montana!
1) "Things" are 10-30 times cheaper to "float" (energy-/cost-wise) than any possible form of land transport.
E.g. if you are Germany (the EU) or China, and are fully dependent on external food and energy sources, and have zero (0) effective long-range navy to protect any essential shipping lines ... Digg up your heirloom calendars from the previous century because they will come very handy, once again. (Not to mention that purchasing a new calendar will not be within your means.) That quintessential and necessarily socialist - arguably fascist - EU slant will make matters even worse, if that'd be any way possible. [France is the only likely winner in Europe, or rather in this case, the lone escapee. That nation's healthy pessimism - the deepest in the world, according to surveys - is also likely to be a notable plus, right about now.]
2) The "Green (renewable) Revolution" is a fantasy - Including the "EV Revolution"
Yes, lithium is light and plenty BUT it is also one of the least energy dense metals in the periodic table of elements. (I.e. it can't move "things"! - By itself, it'd be like pissing in the wind.) One needs to mix it with "something" - like Cadmium, the ONLY source of which is literarily one of the most remote places on earth, in the Democratic Republic of ____ ___, which is neither democratic nor a republic - nor a state or a country.
E.g. No on demand availability = No renewable energy. Not to mention the energy costs - like aluminium, etc. - just in the production of the necessary infrastructure.
In short, no technology exists, at present, which would have a chance to make the whole idea viable, by any tangible means, measure, or foresight.
3) China - is "dead".
It is already in the process of passing that proverbial water buffalo which the Chinese Dragon has swallowed a little ways back and as of this year (2023) it is in a full fledged, unmitigated demographic collapse. Ain't no fixin' that, ya'll!
To make things even more inconvenient, China has the longest (food + energy) supply lines, possible on this planet. (Some of those even longer than the other side of the world .) Count on a - once again - rural China with 800 million subsistence gardeners by 2035, starting now!
4) Russia
That 1/6th of dry land on this globe has got everything! Except all the good stuff is well over a 1000 miles inland - and still in the ground! -, not to mention all of it being totally land locked. (Refer to "1") E.g. Potential issues with reliance on Russian supply lines has similar connotations to the overpopulation issue on Mars.
5) Africa
For real? ... Not!
6) South America
They have everything , pretty much. Just as most of it is also land-locked. But since that whole chunk of the planet is squarely in the N. American zone of interests, simply chuck it up as an integral part of NAFTA.
... leaving only one, single country /block that posses ample domestic food and energy resources, combined with incomparable industrial and military strength and reach, not to mention a sufficiently large internal market, including a (still) favorable demographic - that is also optimally dispersed -, to do as it pleases, as long as it pleases, to/for whom it pleases: "Fortress America".

US30US30 analysis will witness a noticeable rise. The bearish channel has been broken. We are waiting for a correction to level 33720. Good luck.

sell limit in us 100a probability of scalp sell in the US100 with risk benefit of 1/5 managing following my trading plan, if for more information do not hesitate to ask

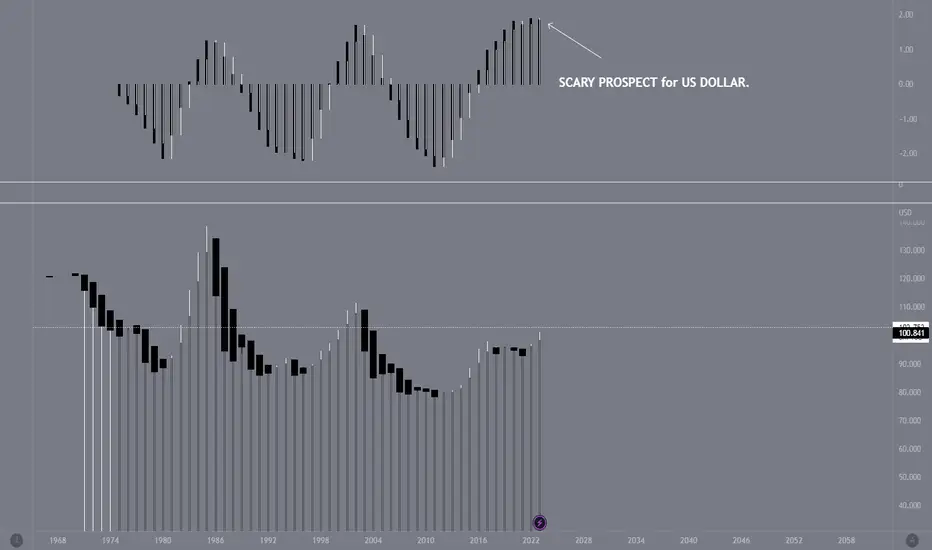
US DOLLAR 12MONTH CHART -- SCARY PROSPECT.Here's a look at DXY US DOLLAR INDEX on a 12 month chart. This year, it's the second time it signalled a big shift on the upper histogram, last time it did was 2021. Is this the start of the big fall for the USD.
This may last for a few years -- worse a decade.
Again it may or it may not happen, but the 12-month chart doesn't change mind often. I guess we'll see..
Travelers: On an excursion 🗺️ 🚎The Travelers stock could once again honor its name and undertake a volatile journey. We now locate the stock in the magenta wave (y), which should undercut the support at $157.33 and then bring the superior wave (4) in green to its end. It should be noted that it is also 39% likely that the stock has already established the low of the larger correction with wave alt.(4) and will next break out directly above resistance at $173.47. Following the deposited wave (4) low - whether by primary or alternative means - we expect significant price gains

BULLISH NASDAQHere is the trick, one way or the other this pair daily candle will close bullish. Entry at 14263.2 stops below 14158.3 targets 14634.5
Icrackedthealgo

sell in sp 500We have sp500 with a sell signal after eating all the liquidity from the previous sessions of last week now we can go down to other points of interest It is the same as the Nasdaq in that movement

sells zone in nasdaq -us100 we have the nasdaq with a sell signal after eating all the liquidity from the previous sessions of last week now we can go down to other points of interest

DXY US INDEX LONGhi traders as i can see a very simple view on Dxy chart
that the bullish move is still going to complete the given level
if we watch deeply in the chart the DXY holding a strong support zone with a strong data of CPI & NFP with FOMC meeting minutes then its an easy target for incoming days
Kindly share ur thoughts via comment session...
stay tuned for new updates

intel - analysis - inside 💻Hello TradingView Family / Fellow Traders. This is Richard, also known as theSignalyst.
📉 INTC has been overall bullish trading inside the rising wedge pattern in blue and it is currently approaching the lower bound / blue trendline.
Moreover, the 31-32 is a strong support zone.
🏹 So the highlighted red circle is a strong area to look for buy setups as it is the intersection of the green support and lower blue trendline acting as a non-horizontal support.
📚 As per my trading style:
As INTC approaches the lower purple circle zone, I will be looking for bullish reversal setups (like a double bottom pattern, trendline break , and so on...)
📚 Always follow your trading plan regarding entry, risk management, and trade management.
Good luck!
All Strategies Are Good; If Managed Properly!
~Rich

Soft landing calls for tough choices2023 has been a tough year for stock pickers. The gap between equity factor styles has been vast over H1. Growth, riskier in nature, posted the best performance up 24% year-to-date (YTD) followed closely behind by quality up 20% YTD1. The excitement around artificial intelligence (AI) reached a fever pitch in H1 2023, supporting growth-oriented technology stocks.
As we enter H2 2023, we remain constructive on select areas of global equity markets. The resilience of the US economy has defied all odds. The strength of the US consumer (accounting for 70% of GDP), alongside the fiscal impulse, has been the cornerstone of the US’ extraordinary resilience. While inflation has shown encouraging signs of decline in the US, strong economic momentum alongside a rebound in commodities raises the risk of a re-acceleration of inflation. In turn, rates could remain higher for longer, resulting in Federal Reserve (Fed) rate cuts being delayed until Q1 2024. In such an environment, an enhanced equity income approach could fit well. Even if the earnings outlook weakens in China, proactive policy support via rate cuts could support its stock multiples.
In Europe, where we are likely to witness a mild recession, we believe adopting a more cautious and defensive approach is warranted. Earnings revision ratios remain the strongest in Japan while they are the weakest in emerging markets.
US equities are the belle of the ball
It was the narrowest market in history, with just 25% of stocks outperforming the S&P 500. Expectations of cooling inflation aiding the Fed to end its current tightening cycle supported the performance of higher-duration growth stocks. For investors calling for a soft landing, rates are likely to remain at current levels or higher for a longer duration of time. A tight US labour market, with unemployment at historic lows and rising wages, is likely to slow the downward pricing momentum in the service sector. As the market regime transitions, it should provide a ripe opportunity for market breadth2 to improve. Markets may begin to favour value and dividend-paying stocks. History has shown us that breadth tends to improve as the economy recovers from a downturn.
Peak pessimism towards China
China’s reopening rebound has faded. The transition to a less debt-fuelled, less property-reliant and more consumer-driven economy is an important adjustment. We expect government stimulus policies to be aimed at enhancing the efficiency of the private sector. Further iterations of policy rate cuts by the People’s Bank of China (PBOC) are likely to follow; however, outright quantitative easing won’t be on the cards, as it is likely to further weaken the yuan, which the PBOC would like to avoid. With a low correlation to US equities (at 20x P/E)3 coupled with a high valuation discount, pockets of China continue to provide good investment prospects.
Pockets of opportunity in non-state-owned enterprises
Non-state-owned enterprises, particularly within the Technology, Communication Services and Health Care sectors, faced the brunt of China’s regulatory crackdown. These regulatory interventions stifled growth in key sectors such as e-commerce, mobile payment, ride-hailing, and online education. It also resulted in the suspension of initial public offerings (IPOs) and delisting of Chinese internet companies. Growing political frictions in supply chains are incentivising China to regain independence in the semiconductor and hardware space. Chinese technology companies are trading at a significant discount compared to US peers, offering plenty of room to catch up.
Prefer defensives over cyclicals as Europe runs out of steam
Nearly six months back, investors marvelled at how the euro-area economy had emerged from the energy crisis. That momentum appears to be fading as China’s recovery slows down, consumer confidence declines, and the impact of tighter monetary policy gains a stronghold on the economy. Higher inflation over the past year is holding back demand from households, which is hurting growth.
The monetary tightening over the past year not only triggered an increase in real rates, it also impacted borrowers’ credit metrics. Owing to this, eurozone banks have tightened their lending standards.4 Banks remain the primary source of corporate funding in Europe. The credit impulse—that is, the annual change in the growth of credit relative to GDP—in the euro area reached its lowest point since 2010.
TINA is alive in Japan
There is no alternative (TINA) to equities is still alive in Japan. This is evident from higher equity risk premiums of 2.97% for Japan compared to 0.41% in the US.5 While the rest of the world has been busy trying to quell the inflation fires, Japan has emerged from the COVID-19 lockdowns with a faster pace of growth and higher inflation. A combination of higher equity risk premiums, a weaker yen supportive of the Japanese export market, corporate reforms, and attractive valuations have been important catalysts for equities.
Policy shift still remains loose
The Bank of Japan (BOJ) took a significant step towards normalisation in July by announcing a further adjustment to its yield curve control (YCC) regime. The BOJ formally changing its course constitutes an acknowledgement that inflation is returning to the Japanese economy. Yet the BOJ lowered its (median) inflation forecast for fiscal year (FY) 2024 to +1.9% and left its FY 2025 projection unchanged at +1.6%, in effect justifying ongoing easing by the BOJ. With Japan’s nominal growth rising over the coming years, the revised policy by the BOJ still remains loose, supporting the case for Japanese equities. Historically, a weaker yen has benefitted the performance of Japanese exporters as it enhances their competitive advantage. Adopting a tilt towards dividend-paying Japanese equities is likely to reap the benefits of not only a weaker yen but also corporate governance reforms.
Conclusion
As we progress into year-end, the outlook remains more nuanced. In the US, we favour value and dividend stocks as equity market breadth improves. While China’s problems in the housing sector are likely to remain a drag on domestic demand, we do see pockets of opportunity in undervalued sectors – technology and healthcare. Given the strong manufacturing headwinds facing Europe, we expect weak growth in the eurozone for the remainder of 2023, potentially favouring a tilt towards defensive stocks.
Sources
1 Bloomberg as of 11 October 2023.
2 Breadth is measured by comparing the equal weighted performance versus the market cap-weighted performance of the US stocks listed on the S&P 500 Index.
3 P/E = price to earnings ratio.
4 Euro area Bank Lending Survey (BLS), April 2023.
5 Bloomberg, WisdomTree, as of 29 September 2023. Equity risk premium is the difference between the earnings yield and the respective 10-Year Government Bond Yield.
This material is prepared by WisdomTree and its affiliates and is not intended to be relied upon as a forecast, research or investment advice, and is not a recommendation, offer or solicitation to buy or sell any securities or to adopt any investment strategy. The opinions expressed are as of the date of production and may change as subsequent conditions vary. The information and opinions contained in this material are derived from proprietary and non-proprietary sources. As such, no warranty of accuracy or reliability is given and no responsibility arising in any other way for errors and omissions (including responsibility to any person by reason of negligence) is accepted by WisdomTree, nor any affiliate, nor any of their officers, employees or agents. Reliance upon information in this material is at the sole discretion of the reader. Past performance is not a reliable indicator of future performance.

US YIELD 10Y SELL FROM RESISTANCE ZONE HELLO TRADERS ,
As i can the chart is going to reach at a strong resistance zone and 10Y already our bought
so i am looking to let it complete this move and then we will get in trade with a very low risk and higher rewards ....
kindly share Ur trade ideas and stay tunes for new updates on these charts

$DXYCAPITALCOM:DXY
good dayAccording to the chart of the financial markets, the dollar index has the potential to grow up to the range of 104
At the same time, all stocks will fallWatch the news
According to what I said, my prediction is the increase of interest rates and the strength of the dollar in the above time frame.

3M: Not far now! 🦅The 3M stock was able to undershoot the support at $92.38 in the past weeks. Now it is not far to the green target zone between $83.82 and $74.28, where we expect the low of the white wave (II). To capitalize on the expected change in direction, long positions can be opened within the zone. Stops should be placed about 1% below the zone, as a 36% likely alternative would still see a lower white wave alt.(II) low.

In uncertain environments, Quality Dividend Growers the answer2023 saw one of the narrowest bull markets in history, with only 10 stocks contributing 14.3% out of the 20.6% rally during the first 7 months of the year. Since then, markets have turned with the S&P 500 and the MSCI World dropping around -7% since their top1.
Looking forward to the rest of 2023 and beyond, uncertainty is high:
The Federal Reserve (Fed) has reached or is nearing the end of its rate hike cycle, but the easing cycle is still distant and its speed is unknown.
The US may avoid a full-blown recession but a recessionary environment with below-average growth is still on the table.
Further disinflation may be slower as we get closer to target, and energy prices continue to put pressure on core CPI.
In such uncertain times, investors could be contemplating reducing risk in their portfolios. However, many of them have been caught with an underweight in equities early in 2023 and missed out on the rally, leading to underperformance. To avoid a repeat, remaining invested but shifting equity exposures toward higher quality, dividend growing companies could help protect the downside while maintaining exposure to the upside.
Quality stocks tend to outperform at the end of rate hike cycles
With the rate hike cycle reaching its end, it is interesting to see what happened historically to equities in the 12 months following the end of rate hike cycles. The absolute performance of US equities has been quite dispersed following the end of the last 7 rate hike cycles by the Fed. US equities returned 24% in the best period and -18.8% in the worst. Looking at high-quality companies, we observe some consistency, though, since they outperformed the market in 6 out of those seven periods. The only period of outperformance was in 1998, when quality companies returned ‘only’ 23.3% versus 24.3% for the market. In the two periods when equities posted negative returns, quality companies cushioned the loss well, reducing the drawdown significantly.
When investors get picky, quality companies benefit
On observing the performance of high- and low-quality stocks depending on the level of growth in the economy. We split quarters into 4 quartiles, from low-growth quartiles to high-growth quartiles, and then calculate the outperformance or underperformance of those stocks in the quarter following the growth observation.
We first observe the resilience of high-quality companies. While low-quality companies only outperform when the economy is firing on all cylinders, high-quality companies outperform in all 4 environments. High-quality stocks outperform more when growth is either low or below average.
The style that doesn’t go out of style
Investment factors ebb and flow between periods of relative under- and outperformance, depending on where we are in the cycle. One big exception is quality which is, in our view, the most consistent of all factors. Sure, quality can lag in the sharp risk-on rallies that typically mark the start of an early cycle snapback; but those environments don’t tend to last, and neither does quality’s underperformance. In fact, there hasn’t been a rolling 10-year period when quality underperformed since the late 1980s.
The rolling outperformance of different US equity factors versus the market over 10-year periods since the 1970s based on the data from a famous academic: Kenneth French. On average, over periods of 10 years, quality is the factor that has historically delivered outperformance the most, often by a significant margin (90% of the time, the second best only hit 78%). It is also the factor that exhibited the smallest worst performance.
Conclusion
Overall, high-quality companies have exhibited outperformance in periods of low growth, in periods following rate hikes and, more generally, across many parts of the business cycle. With economic uncertainty remaining elevated, and an equity rally that is faltering, investors could consider quality as their portfolio anchor.
Sources
1 WisdomTree, Bloomberg. As of 27 September 2023.
2 WisdomTree, Bloomberg, Morningstar, June 2016 to June 2023.
This material is prepared by WisdomTree and its affiliates and is not intended to be relied upon as a forecast, research or investment advice, and is not a recommendation, offer or solicitation to buy or sell any securities or to adopt any investment strategy. The opinions expressed are as of the date of production and may change as subsequent conditions vary. The information and opinions contained in this material are derived from proprietary and non-proprietary sources. As such, no warranty of accuracy or reliability is given and no responsibility arising in any other way for errors and omissions (including responsibility to any person by reason of negligence) is accepted by WisdomTree, nor any affiliate, nor any of their officers, employees or agents. Reliance upon information in this material is at the sole discretion of the reader. Past performance is not a reliable indicator of future performance.

US 10 Year - When does Powell puke?Caption says enough, 4.8% incoming within a month or two. Powell my guy, you are stuck.
