UPDATE: Did Trump spark a bear steepener build out you watchlistHi guys, thank you for the support! I will have this analysis out each weekend as well as daily updates throughout the week, if you guys like what I'm doing hit the "follow" button and you will get a notification each time I post a video or chart!
Have a great day everyone!
US02Y

US02Y isn't playingDo not forget Yields are nothing other than yield to maturity and pre-tax based on the ask side of the market and is not messing around!
Learn how to beat the market as Professional Trader with an ex-insider!
Have a good Trading Week!
Cream Live Trading, Best Regards!

The 2y yield at 3% is more important than the 10y yield at 3%...Charting the LOG of the US 2y yield (blue line) compared to that of the US 10y yield (red line) here shows the heavy move up in the 2y compared to the 10y. This, in my opinion, is very important because a 2y yield at or above 3% will likely drive short-medium term market reaction.
Some of my thoughts on the 2y, 5y, and 10y points of the curve for context:
• The timing of a hike primarily drives the 2y yield (or 1y spot compounded by 1y1y) while the pace of hikes drives the 3y yield (2y spot compounded by 2y1y) and 5y yield (3y yield compounded by 3y1y and 4y1y).
• If you hike sooner then you don’t need such a fast pace of hiking (flatter 2y5y). Conversely, if you wait too long, then you have to increase the pace to catch up (steeper 2y5y)
• The 10 year yield is the ultimate benchmark for the bond market or anyone quoting or looking at rates. Key drivers such as inflation, wages, GDP and market risk on/off sentiment drive this part of the curve.
While we have certainly seen a decent back up in US 10y yields, looking at the trajectory of the US 2y is probably more important. Why? The short-end has immediate effects on borrowing and lending and when the 2y level is currently near 2.5% that has to be a cause for some concern for tighter financial conditions and more expensive credit.
Looking at the LOG trend-line for both the 2y and 10y, if the current momentum and pace continues, then the 2y yield should likely meet the 10y yield sometime towards fall of 2018 i.e. a flat 2s10s curve and a 2y yield above 3% - my point is the 10y above 3% won't be the risk-off indicator, the 2y above 3% will be.

German 2y Yield to go higher (US2Y vs GE2Y yield sprd too wide?)US 2y yield (blue line) vs GER 2y yield (red line)...The spread is immensely wide as the FED has been in a hiking phase wile the ECB still continues to apply a "whatever-it-takes policy".
Eventually the ECB policy will have to roll back and front-end yields will react by backing up.
I believe the German 2y yield will eventually move higher and lead the narrowing of the US-GER 2y spread gap.
This also makes the case for a Eurozone (i.e. German) curve flattener attractive at these levels.

Yield Curve Below 1%, Racing to the BottomThe yield curve (spread between the 30 year and 2 year spread) just broke below 1%. All indicators suggest this trend to continue. It has been encroaching the lower Bollinger Band of the Kovach Reversals Indicator, with no retracement in sight. A retracement will be confirmed by a green triangle, if an when it happens. The Federal reserve should be very mindful of this in their December meeting.
If you're interested in the Kovach Reversals Indicator and more, sign up for access at quantguy.net!


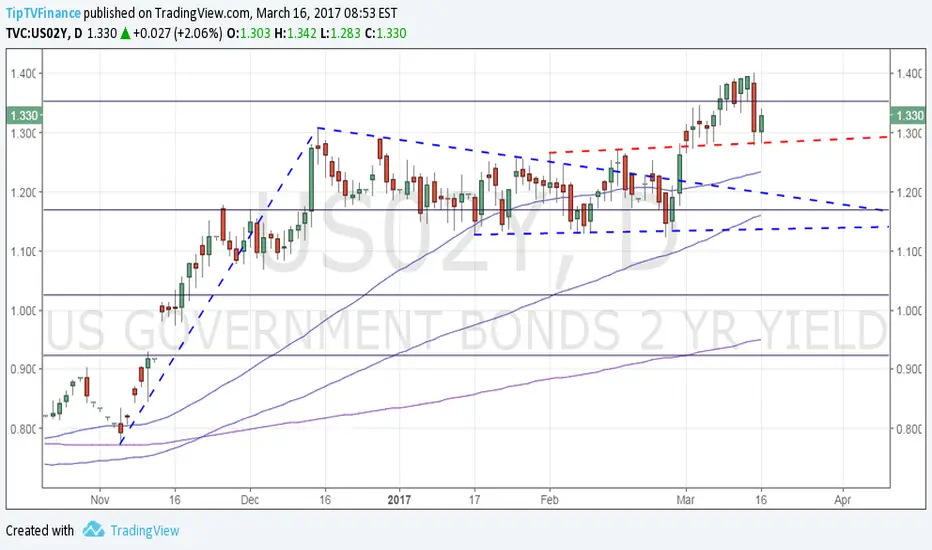
US 2-year yield: Former resistance offering supportThe yield found support at 1.28% (former channel resistance) yesterday and has staged a rebound to 1.33%.
The major averages - 50-DMA, 100-DMA and 200-MA are all sloping upwards and nicely aligned (one below the other) suggesting the long-run view remains bullish.