Nasdaq: Analyzing Recent Trends and Potential ResurgenceIn the most recent trading session, the Nasdaq, mirroring the broader trend observed across major US indices, underwent a significant retracement following an extended period of bullish momentum throughout the year. The Nasdaq's price descended to a demand zone situated approximately at the 50% level from the preceding swing on the daily timeframe. Subsequently, following a rebound around the $17,000 mark, indications suggest a potential for a renewed pullback, signaling a possible resurgence in the uptrend. We are currently considering a long position, having already initiated one, and are also contemplating a buy limit order should the retracement deepen further.
Us100

Dow Jones (US30): Pullback From Key Level
After a test of a strong horizontal resistance,
Dow Jones broke and closed below a support line of a rising parallel channel
on a 4h time frame.
We can expect a retracement to 38230 / 38066
❤️Please, support my work with like, thank you!❤️

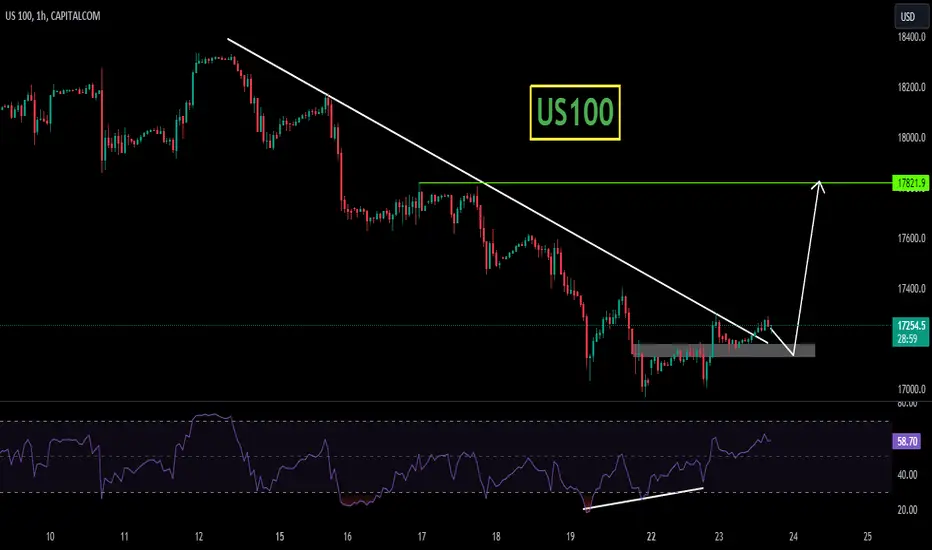
US100US100 is trading in falling wedge pattern. The price was reacting well the support and resistance of wedge.
Currently the price has given the massive breakout from falling wedge and after successful retest of the level will be bullish signal and seems like the price may go for another leg higher.
If the breakout sustain to upside the optimum target could be 17850
What you guys think of this idea?
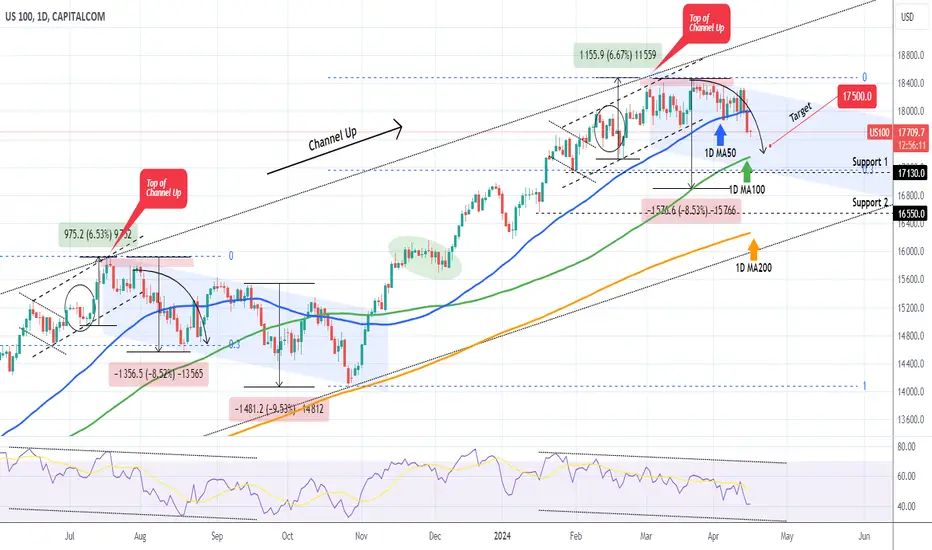
NASDAQ Relief rally to 18000 ahead?Nasdaq (NDX) finally hit yesterday our long-term bearish Target (17130), which we called a while ago (March 12, see chart below) but was postponed due to the Double Top formation:
The index is now on a mixed sentiment as even though it is on a correction sequence below the 1D MA100 (green trend-line), the 1D RSI hit the 30.00 oversold limit as this Bearish Leg almost completed a -8.50% decline.
During the previous Bearish Leg of the multi-month Channel Up pattern, the index had a relief rally towards the 0.786 Fib, after an initial -8.50% decline. We can see that this took place on the 0.3 Fib (blue) from the top.
As a result we expect a short-term (at least) bounce to 18000. As long as the index doesn't break above the (blue) Channel Down and in particularly close a 1D candle above the 0.786 Fib (18150), we can expect a Lower Low after this relief rally. If it does close above it, we will resume most likely the long-term bullish trend earlier and we will update our position.
-------------------------------------------------------------------------------
** Please LIKE 👍, FOLLOW ✅, SHARE 🙌 and COMMENT ✍ if you enjoy this idea! Also share your ideas and charts in the comments section below! This is best way to keep it relevant, support us, keep the content here free and allow the idea to reach as many people as possible. **
-------------------------------------------------------------------------------
💸💸💸💸💸💸
👇 👇 👇 👇 👇 👇

⭐️ Nasdaq’s 430-Pip Profit Play & Forecast : More Fall Ahead ? By checking the #Nasdaq chart in 4-h time frame, we can see that the price was exactly as we expected, after it entered the Bearish BB supply range, it was accompanied by selling pressure and was able to hit the main target with more than 430 pips profit! In the coming week, we will probably have a short upward movement first, and then with the right trigger, we can come back with a SELL position! I hope you have used it!
Please support me with your likes and comments to motivate me to share more analysis with you and share your opinion about the possible trend of this chart with me !
Best Regards , Arman Shaban

❌A bearish MTR setup has been formed❌Considering the breaking of the upward trend line and the formation of the descending MTR, it is likely that it can continue to fall until the first target, 17500

US100 Will Fall! Sell!
Take a look at our analysis for US100.
Time Frame: 9h
Current Trend: Bearish
Sentiment: Overbought (based on 7-period RSI)
Forecast: Bearish
The price is testing a key resistance 17330.1.
Taking into consideration the current market trend & overbought RSI, chances will be high to see a bearish movement to the downside at least to 16972.3 level.
P.S
Overbought describes a period of time where there has been a significant and consistent upward move in price over a period of time without much pullback.
Like and subscribe and comment my ideas if you enjoy them!

Liquidity Crisis may happen, Market TOPPED OUTLiquidity Crisis may happen
most of hedgefund did buying treasury bond and then treasury bond margin loan ,
so they made almost 50x leverage on bond market
times over and over now only t-bill s gonna be recognized as collateral
so t-bill market happend this method
But NFP is too strong, FED didn't do Rate Cut now
So t-bill is bubbled now, we are gonna kill it
and stock market just knew there's plenty of liquidity until today
Only when the tide goes out do you discover who's been swimming naked.
So market topped out

Nasdaq: Analyzing Converging Signals - ScalpNasdaq has entered an intriguing supply zone following its recent decline, where we've identified a convergence of signals hinting at a potential price rebound and value appreciation. These signals include a divergence on the Stochastic indicator coupled with the presence of the 78.6% Fibonacci level.
One potential scenario could involve a Local Double Bottom formation, suggesting a potential opportunity for a long scalping position. Our strategy anticipates setting a target at the Point of Control (POC) volume, with the stop-loss positioned just below the identified pattern.

NASDAQ: This is a short term correction leading to 21,500.Nasdaq is bearish on its 1D technical outlook (RSI = 37.414, MACD = -64.490, ADX = 50.187) but the 1W RSI is still bullish (RSI = 56.510). You can see the reason on this chart. The long term pattern is a Channel Up that is supported by the 1W MA50 for the past 13 months. The current pullback can be seen as a phase similar to the consolidation of August-November 2020 that resumed the uptrend afterwards almost as high as the 4.0 Fibonacci extension level. The RSIs are very much alike as well, under LH trendlines. Consequently our long term target is slightly under the 4.0 Fib (TP = 21,500).
See how our prior idea has worked out:
## If you like our free content follow our profile to get more daily ideas. ##
## Comments and likes are greatly appreciated. ##

Nasdaq : Possible Scenario After CPIAs the global economic landscape continues to evolve, forex traders are constantly seeking insights to inform their strategies. The upcoming release of key indicators for the US economy provides a valuable opportunity for analysis and projection.
Forecasting the US Consumer Price Index (CPI) for March reveals anticipated increases of 0.3% monthly and 3.4% annually. This data follows a comparable uptick in February, with a 0.4% monthly rise and 3.2% annualized growth. Additionally, projections for the US Core CPI in March suggest a 0.3% monthly expansion and a 3.7% annualized rate. This contrasts slightly with February's figures, showing a 0.4% monthly increase and a 3.8% annualized trend.
Another crucial indicator to watch is the US Preliminary Wholesale Inventories for February, with predictions indicating a 0.5% monthly rise. This stands in contrast to January's data, which revealed a 0.3% monthly decrease.
Furthermore, market attention is drawn to the US Crude Oil Inventories Change for the week ending April 5th, forecasted at 0.900M. Similarly, expectations for US Gasoline Inventories Change and US Distillate Stocks Change for the same week are -1.320M and -1.153M, respectively. These figures will be compared to the previous week's data, which reported 3.210M for crude oil, -4.256M for gasoline, and -1.268M for distillate stocks.
Additionally, the US Monthly Budget Statement for March is projected at -$209.4B, deviating from February's reported figure of -$296.0B.
Today's release of the US CPI data will undoubtedly influence trading sessions. An upside surprise akin to previous reports may result in a decline of US equity markets by over 1%, while lower-than-expected inflation could lead to a 1%+ spike. Furthermore, the outlook for interest rate cuts remains uncertain, with markets possibly reconciling with no cuts in 2024. However, escalating inflation could necessitate further interest rate hikes.
Amidst these developments, the forecast for the NASDAQ100 remains cautiously bearish. The equity index's stagnation at its horizontal resistance area, coupled with decreasing upside momentum, underscores the need for vigilance in trading strategies.
In conclusion, the forthcoming economic indicators offer valuable insights for forex traders navigating the complexities of today's markets. By staying informed and adaptable, traders can better position themselves to capitalize on emerging opportunities and mitigate potential risks.
✅ My Previous Winning Idea

NASDAQ INDEX (US100): Technical Outlook & Trading Plan
Daily/4h time frames analysis for US100.
Price action & key levels.
Directional bias.
Thoughts.
Trading plan.
❤️Please, support this video with like and comment!❤️

US30 - Sell SignalUS30
We saw some nice rejections from this 38,000 region yesterday, hoping for the same type of play, we rejected very close to that 38,000 price. Pushing a high on the retest of just 38,030.
Still bullish for the dollar and therefore looking for US30 and US100 to pull south until sentiment changes. Order details as detailed below. Plenty more mileage beyond 37,800 if this starts to play out.

NASDAQ INDEX (US100): Correction Continues
After quite a long consolidation within a wide horizontal range
on a daily, US100 index violated its support.
That violation is an important sign of strength of the sellers.
It may trigger a correction lower, at least to 17500.
❤️Please, support my work with like, thank you!❤️

NASDAQ Emphatically below its 1D MA50 after +5 months!Nasdaq (NDX) is on the pull-back process, a correction that we called on our March 12 idea (see chart below) when the index reached the top of its 1 year Channel Up:
Even as recently as last week (see chart below) we called for the ideal sell entry and set a 17500 Target:
As you can see, the index emphatically broke and closed below the 1D MA50 (blue trend-line) yesterday for the first time in more than 5 months (April 04 also closed below it but only marginally). That is technically as strong bearish break-out signal.
The idea now is that we want the index to hit the 1D MA100 (green trend-line), which has been intact since November 06 2023, see how the market reacts and then determine if that is a low or not. Technically if it replicates the August 18 2023 Low, we should be expecting a Low on the 0.3 Fibonacci retracement level at 17,150 at least, which also happens to be just above Support 1.
The decline on the Aug 18 2023 Low was of the -8.52% magnitude, so that gives us a 16900 downside limit. We don't expect the pull-back to go that low though this time. A fair bottom signal can be when the 1D RSI hits 35.00 or the bottom of its Channel Down, similar to what took place on August 18 2023.
-------------------------------------------------------------------------------
** Please LIKE 👍, FOLLOW ✅, SHARE 🙌 and COMMENT ✍ if you enjoy this idea! Also share your ideas and charts in the comments section below! This is best way to keep it relevant, support us, keep the content here free and allow the idea to reach as many people as possible. **
-------------------------------------------------------------------------------
💸💸💸💸💸💸
👇 👇 👇 👇 👇 👇

🔥 #NASDAQ - More Fall Ahead ? (READ THE CAPTION)By checking the Nasdaq index chart in the 4-hour time frame, we can see that exactly as we expected, the first price was accompanied by a slight growth and filled the specified FVG, And after that, the price faced a heavy fall and corrected it by more than 400 pips to 17860! As you know, this is a demand range, and for this reason, the price reaction to this range is positive! If the price can penetrate below 17760 in the short term, we can expect starting a Bearish trend in the medium term!
Please support me with your likes and comments to motivate me to share more analysis with you and share your opinion about the possible trend of this chart with me !
Best Regards , Arman Shaban

US100 BULLISH ROBBERY PLANHigh risk Heist Plan,
Ola Chicos Chicas,
This is our Day Trade master plan to Heist Bullish side of US100. my dear Looters U can enter at the any point above my entered area of Green zone, Our target is Red Zone that is Dangerous area. We can escape near the Target area. There is a chance to move opposite direction. Be careful & be rich

N1DAILY
Just watch, the current sideways movement has me in a daze, previous similar price dropped and melted.
4H
Let it move more before any judgements. Rejection of price from 18200 and candles direct us to look for sells.
1H
17900, our target price. Just waiting for entry prerequisites.
15Min
The impulsive bear candle just gave us the first confirmation wait for 2 more before even attempting to enter.

NASDAQ Will the 1D MA50 hold or break and start a correction?Nasdaq (NDX) marginally broke and closed a 1D candle below the 1D MA50 (blue trend-line) last week but quickly recovered on Friday and this week has established its price action above it. Still it is under Lower Highs following the March 21 Double Top.
It is a fact that the 1D MA50 hasn't been broken in 5 months (since November 03 2023) so last week is the first bearish sign after much time, but the quick recovery leaves a neutral, to say the least, tone. However, the (dashed) Channel Up is already broken downwards, so we will wait for a final bearish confirmation, with the condition being another 1D candle closing below the 1D MA50.
If that happens, we expect a Channel Down to emerge similar to July - October 2023. In that case, we will be looking on the short-term for a 1D MA100 (green trend-line) test, with a minimum Target at 17500.
-------------------------------------------------------------------------------
** Please LIKE 👍, FOLLOW ✅, SHARE 🙌 and COMMENT ✍ if you enjoy this idea! Also share your ideas and charts in the comments section below! This is best way to keep it relevant, support us, keep the content here free and allow the idea to reach as many people as possible. **
-------------------------------------------------------------------------------
💸💸💸💸💸💸
👇 👇 👇 👇 👇 👇

BUYERS CONTINUE TO SHOW THEIR RESILIENCE IN US100Buyers keep dominating the market after price dropped lower to 17977. A buy opportunity is envisaged from the current market price.
Technically, we also identify the formation of symmetrical triangle structure which Indicate a possible buy opportunity after the retest is completed.

🔥 #NASDAQ - First LONG , Then SHORT (READ THE CAPTION)By checking the Nasdaq index chart in the 4-hour time frame, we can see that the price started to move exactly as we expected and it grew with more than 330 pips of yield to the range of the previous supply zone! After entering the supply range of 18360 again, the price faced a heavy drop and corrected to the demand range of 17800 to 17970! Now the price is trading in the range of 18130 and is trying to fill the previous FVG! Probably we will see a growth first and then fall again!
Please support me with your likes and comments to motivate me to share more analysis with you and share your opinion about the possible trend of this chart with me !
Best Regards , Arman Shaban

N1DAILY
Mid trend, so stay the fxxk away
4H
Impulsive bearish candlestick currently forming, which will keep the drive going down to find support. 18000 will give us a point of interest for price, where we will look for patterns before using candles for confirmation.
1H
Current candle is bearishly engulfing and giving more signs of bears killing momentum of the bears.
15Min
18050 we'll wait for this touch.
