NASDAQ, expect a top to be built at 18kHello everyone,
I've been watching NASDAQ closely as I expect to end an elliot wave count around the 18k area.
If the level will be reached soon the chance for a correctional move is high, where we could anticipate in.
To make it short, the psychological level of 18.000 will be very interesting, but there is also the channel trendline above, that should form strong resistance. I usually work with several positions, the cyan tringle area will be used for shorting.
I will keep you updated about further actions.
Us100

NASDAQ(US100):🟢Possible scenarios🟢(Details on Caption)
Hello Traders
Outlook:
Daily Chart Summary:
NASDAQ's recent action:
Cleared sell-side liquidity in the daily Fair Value Gap (FVG).
Activated bearish breaker block by closing below 18233.50.
Bullish Scenario:
4-hour chart insights:
Trend line liquidity intact.
Buy-side liquidity remains untouched.
SMT with S&P500 and Dow Jones trend supports upward potential.
Bearish Scenario:
Concerns:
Activation of daily bearish breaker block.
Presence of order block with Fair Value Gap (FVG) on the 4-hour chart.
Explore
By examining the NASDAQ daily chart we can figure out, that the price purged the sell-side liquidity that formed inside the daily FVG. On the other hand, the price activated the bearish breaker block by closing the daily candle body below 18233.50.
Up to this point, I mentioned the primary characteristics of bullish and bearish scenarios, Let's go deeper and continue.
The first scenario (I follow this scenario) is bullish, Here in the NASDAQ (US100) 4-hour chart we can see the created trend line liquidity and left buy-side liquidity untouched. In addition, there is an SMT with S&P500 and Dow Jones. This alignment gives us added confidence in the potential for the price to target the buy-side liquidity.
The second scenario is bearish. As I mentioned the price activated the daily bearish breaker block and also there is an order block with FVG that may push the price lower. The bullish FVG above sell-side liquidity can be our first target in this scenario.
💡Wait for the update!
🗓️17/03/2024
🔎 DYOR
💌It is my honor to share your comments with me💌

QQQ bearish Head-and-Shoulders pattern confirmedNASDAQ:QQQ has shaped Head-and-Shoulders formation on the daily chart. Daily downtrend confirmed, weekly consolidation has started.
Please note that broad SP500 market is still technically in an uptrend, meaning that buyers are still strong. So if you plan entering SHORT on QQQ I would wait for a pullback to increase risk-reward. An example of possible trade is shown on the chart. Of course, it is important to monitor how things develop and make corrections if needed.
Disclaimer
I don't give trading or investing advice, just sharing my thoughts.

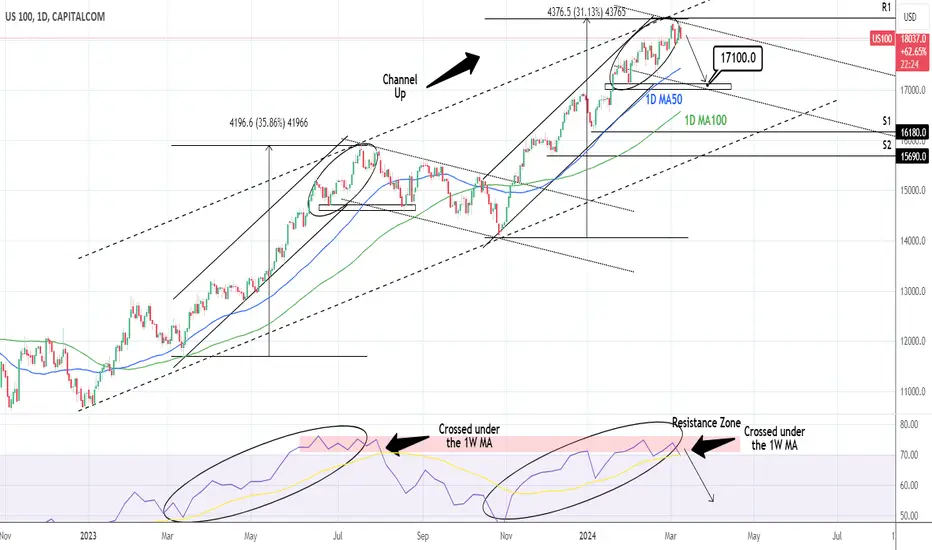
NASDAQ Correction not over yet but won't be a big one either.Nasdaq (NDX) started a correction last week (see our March 12 idea below) which was after a rejection at the top of the multi-month Channel Up that transitioned into a Head and Shoulders (H&S) on the lower time-frames (4H) and broke below February's Channel:
Despite the early bounce today, we don't expect this correction to be over, but won't be a lengthy one either. On the 1D time-frame we set a 17130 Target and that seems to be almost in perfect sync with what the 1W time-frame shows us, which is at most a test of the 17,000 - 16,850 range.
What's the importance of this? Well that is the horizontal level of the previous November 2021 All Time High (ATH), i.e. a Resistance, that may now turn into a Support. As this 1W analysis shows us, since NDX started trading inside a log Channel Up since 2010 (that later broke upwards thus is best viewed here by the Fibonacci Channel levels), the prior Resistance has been tested and held 9 times (with the exceptions being the March 2020 COVID flash crash and of course more recently the 2022 inflation Bear Cycle).
The key on those sequences has been the formation of Lower Highs on the 1W RSI when done above the overbought barrier (70.00). The 2nd Lower High has basically been the technical sell signal that called for the formation of the medium-term Top.
At the same time though keep in mind that on all those medium-term corrections, the index touched the 1W MA50 (blue trend-line), with the only exception being the September 2020 pull-back. The 1W MA50 is currently at 15500 (but rising aggressively), considerably lower than the 17,000 - 16,850 Support Zone. The difference maker in any case would be the Fed's outlook towards potential rate cuts this year. The slightest mention of potential cuts either this Wednesday or later, would be enough not to let the index free fall to the 1W MA50.
In any case, this chart shows long-term investors when to consider to take some profits (RSI Lower Highs) and then when to have the patience to wait a few weeks - 2 months before entering again. On the long-term we expect a minimum repeat of the September 2020 - November 2021 rally towards the 2.0 Fibonacci extension. As a result our long-term target on Nasdaq is 27000.
-------------------------------------------------------------------------------
** Please LIKE 👍, FOLLOW ✅, SHARE 🙌 and COMMENT ✍ if you enjoy this idea! Also share your ideas and charts in the comments section below! This is best way to keep it relevant, support us, keep the content here free and allow the idea to reach as many people as possible. **
-------------------------------------------------------------------------------
💸💸💸💸💸💸
👇 👇 👇 👇 👇 👇

US100 Bearish SetupI see a H&S pattern forming on the 4H timeframe, price has broken previous support and broken the neckline, currently waiting for the retest of the neckline (resistance) to enter the trade with short positions down to TP. Please be sure to move your stop loss while you are 50 pips in profits. Hope you like the idea, if you did please comment or put a like.

NASDAQ Channel up transitioning to a Head and Shoulders.Nasdaq broke and closed today a (4h) candle under the MA200 (4h) for the first time January 8th.
By doing so it completed a Head and Shoulders formation, which is a bearish reversal pattern.
Its target is technically the 2.0 Fibonacci extension.
Trading Plan:
1. Sell on the current market price.
Targets:
1. 17200 (the 2.0 Fibonacci extension, located between Supports 1 and 2).
Tips:
1. The RSI (1d) is inside a Channel Down since the start of Nasdaq's Channel Up, which is a technical Bearish Divergence. It shows that the bullish momentum has lost its strength.
Please like, follow and comment!!


NASDAQ Top of the 1year Channel Up. Needs to correct.Nasdaq (NDX) is almost at the top of the long-term Channel Up that started back in January 2023 and the 1D MA50 (blue trend-line) has been supporting the current Bullish Leg since November 03 2023.
That is a very aggressive wave that is most likely coming to an and as technically it resembles the previous Bullish Leg that peaked on July 18 2023 on a similar (as you can see) structure, which then corrected initially by -8.50% to the 0.3 Fibonacci retracement level just above the 1D MA100 (green trend-line).
As a result, we are turning bearish and our target is 17130, which is Support 1 and where most likely contact can be made with the 1D MA100 on a marginally less fall than -8.50%.
-------------------------------------------------------------------------------
** Please LIKE 👍, FOLLOW ✅, SHARE 🙌 and COMMENT ✍ if you enjoy this idea! Also share your ideas and charts in the comments section below! This is best way to keep it relevant, support us, keep the content here free and allow the idea to reach as many people as possible. **
-------------------------------------------------------------------------------
💸💸💸💸💸💸
👇 👇 👇 👇 👇 👇

Indices:🔴Is it the major market structure shift?🔴
Well As you can see, we can see the SMT here so we can expect a downtrend.
The first condition is, that we see the price close the candle body below the bullish FVG, only then can we expect the price to go lower to collect the sell-side liquidity.
After that, If the first condition occurs, we need the candle closure below the sell side liquidity, then the price activates the bearish breaker block and the breaker can act as a strong resistance and pull the price down.
💡Wait for the update!
🗓️10/03/2024
🔎 DYOR
💌It is my honor to share your comments with me💌

NASDAQ: Pullback towards the Fed Rate day has started.Nasdaq flashed a strong bearish signal this week as the 1W RSI crossed under the MA trendline for the first time since November 7th 2023. While at it, the price hit the top of the 2023 Channel Up. The last timw we saw those taking place was on August 3rd 2023, a little after the HH top. A Channel Down may now emerge as the correcting wave to the 1D MA100 and possibly beyond. But for the time being, we want to time a Low on the Fed Rate Decision date on March 21st. Its bottom is our target (TP = 17,100), a potential contact with the 1D MA100, lower Support Zone.
## If you like our free content follow our profile to get more daily ideas. ##
## Comments and likes are greatly appreciated. ##
NASDAQ Correction is starting, at least to 17350.Nasdaq / US100 is near the top of its 14 month Channel Up.
As you can see, the patterns between the only two bullish legs of the Channel Up are similar and when the July 19th 2023 top was formed, the index fell on its first bearish wave by -8.75% on its 0.236 Fibonacci level.
Sell now and target 17350 (0.236 Fibonacci) and if it closes a 1W candle under it, resell and target 16800 (-8.75% decline).
Follow us, like the idea and leave a comment below!!

NAS100 Trade IdeaThe US100 index has retraced, entering a bullish 1D order block. Analysis of the prevailing trend on this timeframe indicates a clear bullish trajectory. I am eyeing a potential buy entry opportunity within at 61.8% Fibonacci retracement levels. Employing a risk management strategy, stops will be placed below the preceding low, while targeting the previous high and potentially beyond with the implementation of a trailing stop. However, it's imperative to note that trading carries inherent risks, and past performance is not indicative of future results. Therefore, traders should conduct thorough research and exercise caution before making any financial decisions.

NQ SellsMarket Maker Sell Model
We're In 2nd Stage Distribution ,
And we have Sellside Liquidity Resting.
Would like to take a short from that FVG .

NASDAQ MID TERM VIEW | 1hWhat do you think?
DBR = Drop Base Rally Demand Zone
LQP = Liquidity Pool
Arrows = inducement points
HTF = Higher Time Frame

NAS100 - Interesting buy zone!Hello everyone!
After the SL of yesterday, we are turning bearish on NAS100.
Also because we are having rumors that start confirm itself, rumor about the US debt, but also about the NFP that gonna be bad !
Technically, I've entered a buy position due to:
- 2 major liquidity uptakes.
- Buy zone created through accumulation.
- Strong reactions at the buy zone (Accu).
Now we just wait!
🚀 If you liked it and want more, don't hesitate to subscribe and boost the post!
