NASDAQBearish structure has formed, Waiting for further confirmation before looking for short positions.
SolarFX
Us100

US500 potential buyUS500 is setting up for a classic Wyckoff spring. This is a high probability set up with high risk to reward (5R+)
Here is what needs to happen
For situations 1 and 2,
a. price should break blue support (traps sellers and shakes out weak hands)
b. price should then close above any of the 2 blue supports with high volume
c. enter at the close of that bar or retest of the blue line
d. T.P @ recent high.
What do you think? how would you approach this better?

NASDAQ at Weekly Supply Zone – Bearish Breakdown Ahead? (READ)By examining the #Nasdaq chart on the weekly timeframe, we can see that the price is currently trading within the supply zone around 21,400. If it manages to close and stabilize below 21,100, we can expect further downside for this index. The potential bearish targets are 21,000, 20,700, 20,200, and 19,150. The key supply zone ranges from 21,400 to 22,200.
Please support me with your likes and comments to motivate me to share more analysis with you and share your opinion about the possible trend of this chart with me !
Best Regards , Arman Shaban

S&P500 Index (US500): Bullish Accumulation Pattern
I spotted a nice example of an ascending triangle pattern on a daily time frame.
To confirm a bullish continuation, we will need a bullish breakout
of its neckline.
A daily candle close above 5996 will provide a reliable confirmation.
A rise will be anticipated at least to 6080 resistance then.
❤️Please, support my work with like, thank you!❤️
I am part of Trade Nation's Influencer program and receive a monthly fee for using their TradingView charts in my analysis.

NASDAQ INDEX (US100): More Growth Ahead
For some unknown reason, I was asked by a dozen
of my subscribers to provide the update for US100.
Since early May, the index successfully updates the highs on a daily.
Such a tendency will remain at least till a test of a current ATH.
I think that the market is going to grow and reach at least 22100 level soon.
❤️Please, support my work with like, thank you!❤️

NASDAQ: Initiated bullish wave to 22,150.Nasdaq remains heavily bullish on its 1D technical outlook (RSI = 67.266, MACD = 427.500, ADX = 25.384) and just formed a 4H MACD Bullish Cross. This validates the extension of the current Bullish Wave, second inside the short term Channel Up. We anticipate again a +5.40% rise, TP = 22,150.
## If you like our free content follow our profile to get more daily ideas. ##
## Comments and likes are greatly appreciated. ##

NASDAQ Outlook: Waiting for a Catalyst in a Range-Bound Market!The NASDAQ NAS100 has shown impressive gains recently 📈, but overall sentiment remains cautious 😐 as the market consolidates and trades sideways in the short term 🔄. Investors seem to be waiting for a new catalyst—such as major economic data or policy announcements 📰—before committing to a clear direction.
Ongoing political and economic uncertainties, including trade negotiations 🤝, interest rate outlooks 💸, and valuation concerns 💰, are keeping market participants on edge. Given these factors, the near-term environment is likely to remain choppy and range-bound 🌊. As traders, it’s important to approach the markets with caution ⚠️, especially as equities approach key resistance areas 🚧. This uncertainty may also impact currency and other financial markets 💱. While tech stocks could eventually break out of the current range 💻, the direction is still unclear. Prioritize risk management and protect your capital during this period of heightened uncertainty 🛡️.
Political and economic uncertainties—like ongoing trade negotiations, interest rate expectations, and concerns about valuations—are keeping investors on edge.
The near-term outlook for the US100 is for choppy, range-bound trading as the market works through these uncertainties.

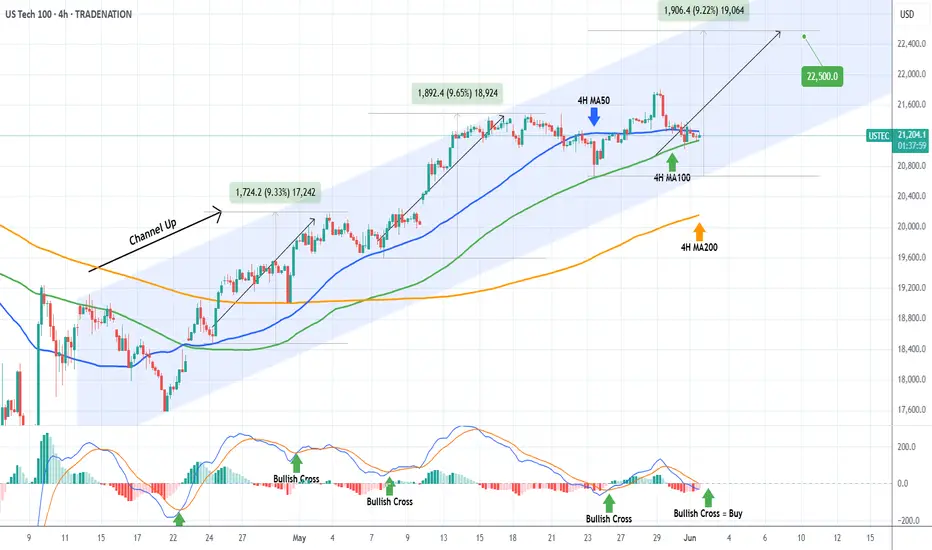
NASDAQ Will the 4H MA100 come to the rescue?Nasdaq (NDX) is trading within a 3-week Channel Up, which is currently supported by the 4H MA100 (green trend-line). In fact, the price is being squeezed in the last three 4H candles within the 4H MA100 and the 4H MA50 (blue trend-line).
This tight compression technically tends to cause violent break-outs either way. As long as the Channel Up holds, we expect that to be upwards and it should be confirmed by the formation of a 4H MACD Bullish Cross.
With the last two major rallies being around +9.50%, we expect to see 22500 on the next Leg Up.
-------------------------------------------------------------------------------
** Please LIKE 👍, FOLLOW ✅, SHARE 🙌 and COMMENT ✍ if you enjoy this idea! Also share your ideas and charts in the comments section below! This is best way to keep it relevant, support us, keep the content here free and allow the idea to reach as many people as possible. **
-------------------------------------------------------------------------------
Disclosure: I am part of Trade Nation's Influencer program and receive a monthly fee for using their TradingView charts in my analysis.
💸💸💸💸💸💸
👇 👇 👇 👇 👇 👇
NAS100 - Will the stock market continue to rise!?The index is above the EMA200 and EMA50 on the four-hour timeframe and is trading within the specified range. In case of a valid break of this range, I expect a new trend to form. In case of corrective movements towards the demand zone, we can buy Nasdaq in that range with an appropriate reward for the risk.
A recent report from Bank of America reveals that investors are actively repositioning in global markets. For the second consecutive week, U.S.equities experienced capital outflows, while European stocks saw inflows for the seventh straight week.
Digital assets attracted $2.6 billion in inflows—the largest amount since January. In contrast, Japanese equities recorded the largest weekly outflow in history, while emerging markets equities attracted their highest inflows of 2025. Meanwhile, emerging markets debt also posted its strongest inflows since January 2023.
Jamie Dimon, CEO of JPMorgan, speaking at the 2025 Reagan National Economic Forum, warned that China will not yield to U.S. trade pressure. He urged that the U.S. must first address its internal challenges, including reforming laws, taxes, immigration, education, and healthcare systems. Dimon also underscored the importance of preserving military alliances.
He noted that China is a serious and potential rival, and if the United States fails to maintain its position as the world’s dominant economic and military power over the next 40 years, the dollar will no longer serve as the global reserve currency. Having just returned from China, Dimon added, “The Chinese are not afraid; don’t expect them to bow to America.”
Currently, markets are pricing in two interest rate cuts totaling 50 basis points by the end of 2025—a forecast aligned with the Federal Reserve’s official dot plot projections. Additionally, the latest FOMC minutes, which revealed policymakers’ concerns over persistent inflationary pressures, played a significant role in shaping these expectations.
Federal Reserve Governor Christopher Waller stated that he would support rate cuts later this year if tariffs remain around an average of 10%. However, his support hinges on inflation moving toward the Fed’s 2% target and the labor market maintaining its current strength.
Meanwhile, Morgan Stanley projects that the U.S. dollar could weaken by approximately 9% by mid-2026, citing a slowdown in U.S. economic growth and an anticipated 175 basis point reduction in the Fed’s interest rates. The bank also forecasts that 10-year Treasury yields will reach 4% by the end of 2025 but fall sharply in 2026 as rates decline further. Both Morgan Stanley and JPMorgan hold a bearish outlook on the dollar, expecting safe-haven currencies such as the euro, yen, and Swiss franc to benefit the most from its weakness.
In this context, market participants are closely watching key economic data in the week ahead. The ISM Manufacturing PMI is scheduled for release on Monday, followed by the Non-Manufacturing PMI on Wednesday. However, the main highlight will be Friday’s May Non-Farm Payrolls (NFP) report, which has exceeded expectations over the past two months. A similar result this time would signal continued strength in the labor market.
Given the Fed’s focus on inflation risks, special attention will likely be paid to the average hourly earnings growth. If wage growth remains above 3%, the market may begin to reprice some of its expectations for rate cuts—especially if the ISM reports also indicate improved economic activity in line with strong S&P Global readings. Such a scenario could pave the way for a renewed strengthening of the U.S. dollar.
Alongside the data releases, a series of speeches from key Federal Reserve officials—including Goolsbee (Chicago), Bostic (Atlanta), Logan (Dallas), and Harker (Philadelphia)—are expected. These remarks could further shape market expectations regarding the future path of monetary policy.

US100 - Bullish Momentum Favors Upside ContinuationThe US Tech 100 is displaying strong bullish momentum after successfully breaking above the critical resistance level at 20,659.8, which had previously acted as a significant barrier. Currently trading at 21,316 the index has demonstrated impressive upward trajectory following what appears to be a healthy consolidation phase around the key resistance-turned-support zone. The technical setup strongly favors continuation to the upside as the higher probability scenario, with the breakout above 20,659.8 potentially opening the door for further gains toward higher resistance levels. However, prudent risk management suggests taking this rally piece by piece, monitoring how price action develops at each significant level while watching for any signs of exhaustion or pullback that might offer better entry opportunities. The bullish bias remains intact as long as the index maintains its position above the former resistance level, which should now serve as dynamic support for any potential retracements.
Disclosure: I am part of Trade Nation's Influencer program and receive a monthly fee for using their TradingView charts in my analysis.

nasdaq : waiting for take the sell stopsThere’s an FVG on the 4H timeframe in Nasdaq,
which indicates strong momentum—likely aiming to hunt some lows.
If the price takes out the specific low I’ve marked,
I’ll watch how the candles react around that area.
If the reaction isn’t strong,
then I’ll start considering a bullish scenario
and look for a potential long setup.

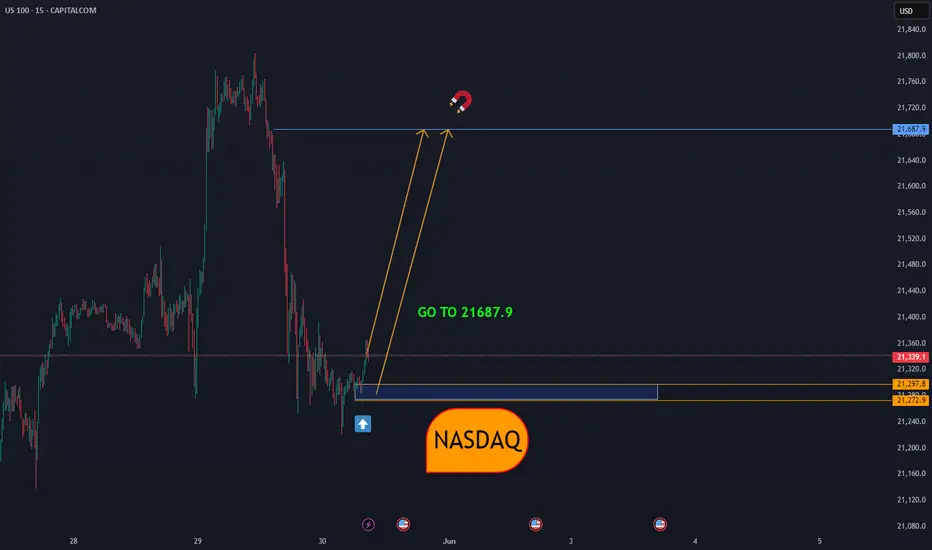
NASDAQGiven the geometry that has been created, there is a possibility of a correction towards the price of 21687.9, either from the current price or from a little lower, if the bottom of 21219 is broken, another decision must be made.
NASDAQ:NDX
NASDAQThe target is for the price of 21272.4 to fall, with any correction if the ceiling of 21802 is not broken, a short trade can be made.
CAPITALCOM:US100

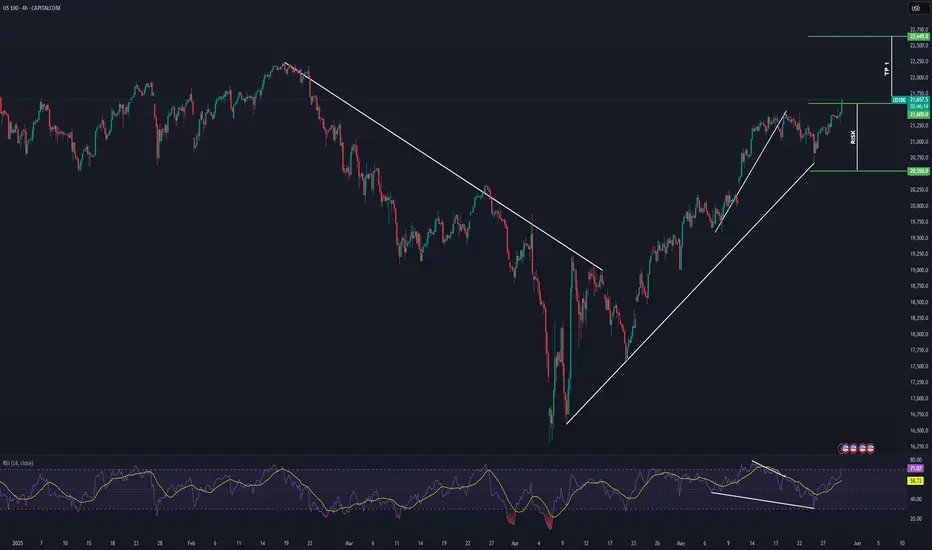
NASDAQ Potential Bullish ContinuationNASDAQ price action seems to exhibit signs of potential Bullish momentum as the price action may form a credible Higher High (after tarriff delays on the EU) with multiple confluences through key Fibonacci and Support levels which presents us with a potential long opportunity.
Trade Plan:
Entry : 21600
Stop Loss : 20550
TP 1: 22649
15-minute chart, there exists another Fair Value Gap!Gold Price Technical Analysis.
At present, gold is exhibiting signs of continued bearish momentum as it trades below the 50% retracement level of the 30-minute Fair Value Gap (FVG). The fact that this critical level has been broken suggests a weakening of bullish strength in the short-term timeframe, and reinforces the likelihood of further downward pressure on the price.
Moreover, on the 15-minute chart, there exists another Fair Value Gap just below the current market level, which is offering minor support for the time being. This area has been acting as a temporary cushion, slowing the pace of decline; however, its sustainability remains uncertain under the current market sentiment.
Should gold decisively break below the 15-minute FVG as well, it would indicate a deeper structural weakness and open the possibility for an extended bearish move. In such a scenario, the next potential support level lies around the 3293 mark, which could act as a short-term target for sellers and a critical level for buyers to watch for possible reversal signals.
Traders and investors are advised to monitor price action closely around these key levels, as further developments could define the next major move in gold's short- to medium-term trend.

Actionable Nasdaq insights: 28-May-2025Rise and shine, traders! Start your day with actionable Nasdaq insights. Let's grow your skills together, one chart at a time.

NASDAQ got the 4H MA50 confirmation it neededNasdaq (NDX) has been trading within a Channel Up since the April 21 bottom and last week it unfolded its latest technical Bearish Leg.
As the 4H RSI bottomed on the 30.00 oversold barrier and the 4H MACD formed a Bullish Cross, that Leg bottomed and today the index gave the confirmation of the new Bullish Leg by breaking above its 4H MA50 (blue trend-line).
This is similar to the April 21 bottom, so we expect at least a minimum of +9.18% rise on the current Bullish Leg, which gives a 22500 short-term Target.
-------------------------------------------------------------------------------
** Please LIKE 👍, FOLLOW ✅, SHARE 🙌 and COMMENT ✍ if you enjoy this idea! Also share your ideas and charts in the comments section below! This is best way to keep it relevant, support us, keep the content here free and allow the idea to reach as many people as possible. **
-------------------------------------------------------------------------------
Disclosure: I am part of Trade Nation's Influencer program and receive a monthly fee for using their TradingView charts in my analysis.
💸💸💸💸💸💸
👇 👇 👇 👇 👇 👇

Nasdaq market analysis: 27-May-2025Good morning, traders! Welcome to today's Nasdaq market analysis. Compare my price action insights with your own charts and enhance your trading skills.

NASDAQ: Needs to reclaim the 4H MA50.Nasdaq is bullish on its 1D technical outlook (RSI = 62.436, MACD = 467.180, ADX = 28.529) as it maintains its long term bullish trend through the Channel Up pattern, which recently is transitioning into a Rising Wedge. We are willing to turn bullish again upon a 4H candle closing over the 4H MA50 and aim for a +11.17% rise (TP = 23,000) on the HH trendline, like the April 21st rebound did.
## If you like our free content follow our profile to get more daily ideas. ##
## Comments and likes are greatly appreciated. ##

NASDAQ 100 Setup After Bearish Pullback. My Bullish Game Plan!🚀 NASDAQ US100 Update – Key Levels I'm Watching 💡📈
Looking at the NAS100 right now, we’ve seen a strong rally kick off after the weekend 📊🔥 — this comes on the back of an aggressive bearish pullback last week 📉.
📌 My bias is bullish, but with a condition: I want to see price retrace into the 10-minute fair value gap and hold above the previous low 🧠🔍.
If we get a clean pullback, followed by a continuation with higher highs and higher lows, I’ll be watching closely for the first bullish break after that next pullback — that’s where I’d look to position long 🐂📈.
🛑 Not financial advice.
👇 Drop a comment if you're watching these levels too!

NAS100 - Will the stock market go down?!The index is above the EMA200 and EMA50 on the four-hour timeframe and is trading in its ascending channel. If the ascending channel breaks, expect corrective moves, and if this channel line is maintained, its upward path will be available to the next supply range.
In that range, we can also sell Nasdaq with appropriate risk-reward.
With Donald Trump announcing a 50% tariff on imports from the European Union, trade tensions have once again taken center stage in global economic news, temporarily drawing attention away from more structural issues. However, these new developments have not diminished deeper concerns about the U.S. debt crisis and the federal government’s fiscal policies. Last week, the release of details regarding a new budget bill in Congress—coupled with Moody’s downgrade of the U.S. credit rating—sparked renewed anxiety in the markets about America’s fiscal stability. These concerns have now taken on more complexity amid the intensifying trade conflict.
The bill, which narrowly passed through the House of Representatives, could potentially add up to $4 trillion to the federal debt. This projection triggered a sharp reaction in the U.S. Treasury market, causing long-term bond yields to rise significantly.
Trump’s threat to impose tariffs on European goods—specifically naming iPhones—negatively impacted market sentiment in U.S. equities. Past trade confrontations with China suggest that Trump typically avoids actions that significantly harm the stock market and tends to retreat from hardline positions. Thus, buying the dip might be a sound strategy, though accurately timing entry is crucial.
Pinpointing the right entry time remains difficult, and perhaps the most reliable signal would come directly from Trump himself. With the July 9 deadline for the tariffs approaching and no formal trade agreement in place, the best course for market participants is to remain cautious and watch for any signs of a policy reversal.
Despite persistent worries over budget deficits and rising Treasury yields, Morgan Stanley remains bullish on the outlook for U.S. equities and bonds.
Morgan Stanley projects the following:
• The S&P 500 is expected to reach 6,500 by mid-2026, representing a roughly 10% gain from current levels. Key drivers of this growth include lower interest rates, a weaker dollar, and productivity gains fueled by artificial intelligence.
• The recent spike in the 10-year Treasury yield is considered temporary, with expectations that it will decline to around 3.45% by mid-2026. There is still no strong evidence of a significant outflow of foreign capital from U.S. markets.
Although the upcoming week will be shortened due to the Memorial Day holiday on Monday, a packed economic calendar starting Tuesday is expected to quickly reenergize market activity.
Tuesday will bring the release of durable goods orders for April and the consumer confidence index for May—two data points that could provide clearer insight into domestic demand and household spending trends. On Wednesday afternoon, attention will turn to the minutes from the May FOMC meeting, where investors will search for clues about potential shifts in the Federal Reserve’s tone regarding future rate cuts.
Thursday will be loaded with key economic indicators: weekly jobless claims, the first estimate of Q1 GDP, and existing home sales data. The week will conclude on Friday with the release of the Core PCE Price Index, the Fed’s preferred measure of inflation, which plays a pivotal role in shaping its monetary policy decisions.
Meanwhile, Nvidia is preparing to launch its new AI chip, Blackwell, in the Chinese market at a more affordable price. Based on the Blackwell architecture, the chip will be priced between $6,500 and $8,000—lower than the H20 model, which costs between $10,000 and $12,000.
This price reduction results from simpler technical specifications and a lower-cost manufacturing process. The new chip uses GDDR7 memory instead of high-bandwidth memory and lacks the advanced CoWoS packaging technology.
Nasdaq trading insights: 26-May-2025Nasdaq trading insights: Not signals, but informative zones to aid your decision-making. Please note: These zones are not trading advice. Use them as a starting point for your own analysis.

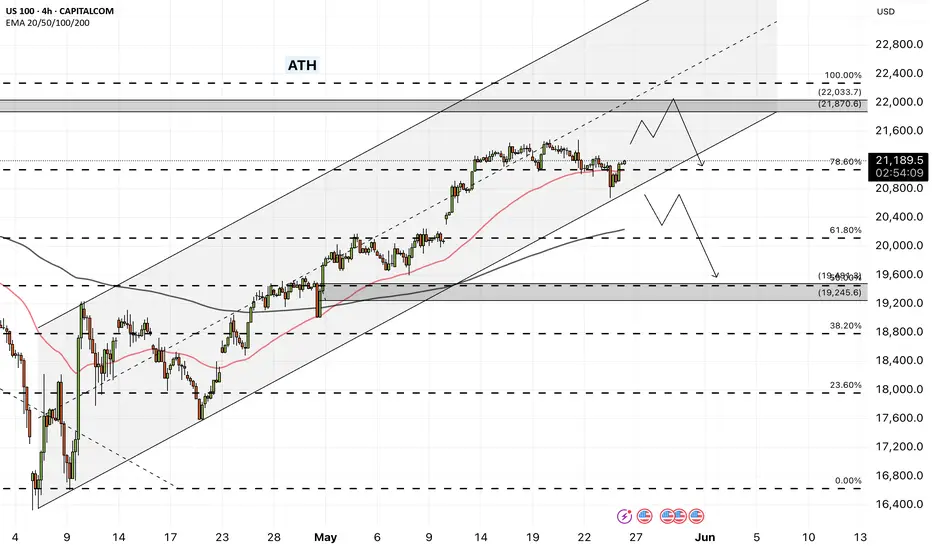
US100 Tests Uptrend: Bearish Signals Emerge❗️ US100 Bearish Alert ❗️
Technical Breakdown Incoming?
📉 The NASDAQ 100 has hit a new local low and is now testing the uptrend line.
🔴 A bearish block order has formed.
📉 RSI signals clear bearish divergence.
📉 MACD confirms momentum is fading for bulls.
🧲 A gap below is acting like a magnet for price action!
🚨 Trade Idea:
🔽 Sell US100 only on a confirmed break below 21070
🎯 TP1: 20745
🎯 TP2: 20188
📊 All indicators point to potential downside – are you prepared?
