NAS100 LONG waiting for the pull back and rejection with signs of continuation rather than trying to short in a very bullish market. It is very over extended and is due for a pull back
Us100analysis

NAS100 - Interesting buy zone!Hello everyone!
I'm bullish on NAS100, despite the negative figures in January which slowed down the rise of stocks/indices, we still have good results from most companies.
We have Nvidia's earnings report approaching, and it looks very promising!
Technically, I've entered a buy position due to:
- 2 major liquidity uptakes.
- Buy zone created through accumulation.
- Strong reactions at the buy zone (Accu).
Now we just wait!
🚀 If you liked it and want more, don't hesitate to subscribe and boost the post!

NAS100 - Interesting buy zone!Hello everyone!
Unfortunately, our position from yesterday hit its stop loss, but that doesn't invalidate my plan.
Here's my 3rd (Soon TP1) AND 4th bullish position on NAS100.
I'm bullish on NAS100, despite the negative figures in January which slowed down the rise of stocks/indices, we still have good results from most companies.
We have Nvidia's earnings report approaching, and it looks very promising!
Technically, I've entered a buy position due to:
- 2 major liquidity uptakes.
- Buy zone created through accumulation.
- Strong reactions at the buy zone (Accu).
Now we just wait!
🚀 If you liked it and want more, don't hesitate to subscribe and boost the post!

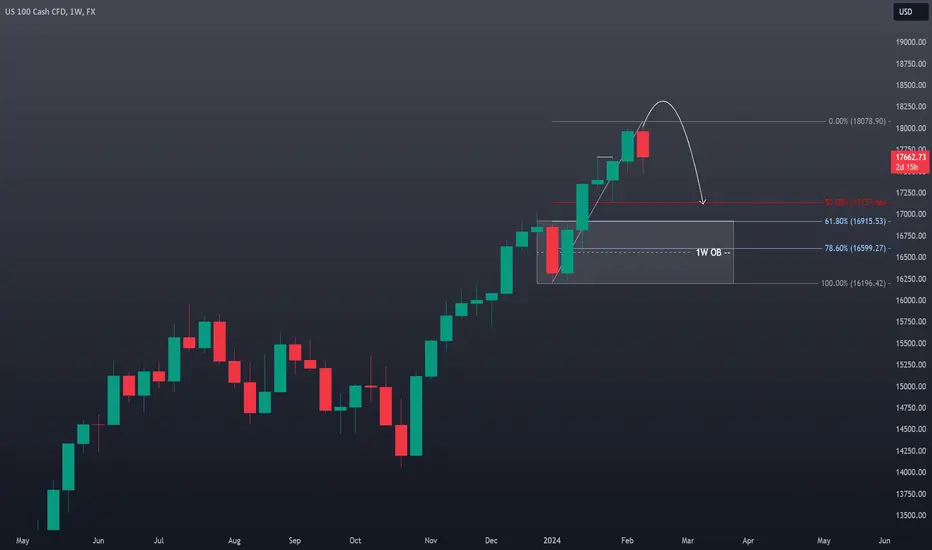
NAS100 Technical Analysis and Trade Idea - Full ExplanationMarket Observations: The #NAS100 has maintained a bullish trajectory. However, price action on the monthly timeframe suggest the #US100 is overextended. Additionally, the weekly chart reveals a double top pattern, hinting at a potential retracement down to the 50-61.8% Fibonacci levels. This area could provide the liquidity needed for major market players to fill long orders.
Trade Strategy: Consider an intraday/swing trade short entry following a potential stop run above the current range. Target an initial profit level around the previous lows near 17250, with a secondary target at 17000 (slightly above the 61.8% Fibonacci level on a 1W chart). Implement a well-placed stop-loss order to manage risk effectively.
Disclaimer: This analysis is based on my observations and does not constitute financial advice. Conduct your own independent research and carefully assess your risk tolerance before making investment decisions.

NAS100 Technical Analysis and Trade Idea
Market Observations: The #NAS100 has maintained a bullish trajectory. However, price action on the monthly timeframe suggest the #US100 is overextended. Additionally, the weekly chart reveals a double top pattern, hinting at a potential retracement down to the 50-61.8% Fibonacci levels. This area could provide the liquidity needed for major market players to fill long orders.
Trade Strategy: Consider an intraday/swing trade short entry following a potential stop run above the current range. Target an initial profit level around the previous lows near 17250, with a secondary target at 17000 (slightly above the 61.8% Fibonacci level on a 1W chart). Implement a well-placed stop-loss order to manage risk effectively.
Disclaimer: This analysis is based on my observations and does not constitute financial advice. Conduct your own independent research and carefully assess your risk tolerance before making investment decisions.
NAS100 Technical AnalysisThe #NAS100 has been on an upward trend, but a potential triple top pattern is forming on the chart. If the #DXY retraces further and rebounds from support, the #US100 could spike above the current high, potentially taking out buy-side stop-loss orders before pulling back down to the 61.8% Fibonacci level. Remember, trading the #NASDAQ involves significant risk. This analysis is just my opinion and shouldn't be considered financial advice.

US100 Strong Resistance Ahead!US100 made nice bullish
Move up but a strong
Horizontal resistance is ahead
At 17638.5 from where I think
We will see a bearish reaction !

US100 M30 / Short Trade Opportunity on US indices ✅ Hello Traders!
This is my Idea related to UA100. I expect a bearish move if confirms the breakout of the mentioned BOSS. It also will be a sign of a bearish market structure.
I expect that FVG H1 will be closed, this area represents also my target.
Traders, if you liked my idea or if you have a different vision related to this trade, write in the comments. I will be glad to see your perspective.
____________________________________
Follow, like, and comment to see my content:
www.tradingview.com

NAS100 Trade IdeaThe NAS100 experienced a substantial rally towards the end of last week, displaying signs of being significantly overextended. A retracement may be in store, particularly if the Dollar Index (DXY) maintains and strengthens its position, considering the general inverse correlation between DXY and US100. It is essential to emphasize that this analysis is provided exclusively for educational purposes and should not be construed as financial advice.

NAS100 - MY INTRADAY ANALYSIS (TARGET 16630)Here I'm trying to change things up with a smaller timeframe (15min) analysis because the daily is nice but how does one trade that? Well here you have it.
What is on the chart?
1) Yesterday's session low, aka sellside liquidity, that hasn't yet been taken out which gives us a juicy target for the day.
2) Yesterday's consolidation that gave the upper hand to bulls in the AM session but now it serves us for our bearish bias of the day.
3) Price wicking once more in the daily FVG and not taking out the high. Great news for bears.
4) Price retraced back into the reload zone (0.702 notably) and furthered its descent into bear territory.
5) Bearish 1 hour order block. Will be used partly for our entry coupled with the fibs.
6) London session lows that will also serve as a target. When there's an accumulation of targets it increases the probability of success when placing a trade aiming in that direction.
7) My ideal entry. To your own discretion, I can afford losing 1%, can you? (affording something isn't just monetary can also be psychological. Can you cope with losing your money once more because of the idea of a stranger on the internet?)
8) The outcome I'm looking for. If we're going for a bearish scenario this is what should (I want to) happen.
NOTE: Retail Sales data release 08:30 NY time. Could make it or break it.
Happy trading and have a nice day! ;)

US100 H4 / LONG TRADE OPPORTUNITY 📈 ✅Hello Traders!
This is my idea on US100 H4. I see a perfect retracement from the resistance level marked on the chart. I consider this a good sign of a small retracement.
Traders, if you liked my idea or if you have a different vision related to this trade, write in the comments. I will be glad to see your perspective.
____________________________________
Follow, like, and comment to see my content:
www.tradingview.com

US100 NASDAQ Technical Analysis and Trade Idea NAS100Sharp Retracement in NAS100: Opportunity on the Horizon?
Eyes are laser-focused on the NAS100 after it slammed into a key resistance level. The current aggressive pullback sets the stage for an intriguing dynamic ahead of the NFP data drop later today. A strong dollar boost (or unexpected weakness) could significantly impact the index, making this data release a potential swing point.
With such a sharp retracement already underway, I'm eyeing a potential long entry as the price plunges towards a crucial support zone. In the video, we dissected the trend, price action, market structure, and other technical essentials to build a comprehensive picture.
Remember: This analysis is purely for educational purposes and should not be interpreted as financial advice. Do your own due diligence before making any trading decisions.

US100 H4 / POSSIBLE RETRACEMENT UNTIL THE PRICE 15735 ✅Hello Traders!
This is my perspective for US100 H4. NASDAQ just set a new ATH (All Time High), and now I expect a retracement until the price of 15735. A very strong move this week. In case of confirmation, it would be a good opportunity to execute a short trade.
Traders, if you liked my idea or if you have a different vision related to this trade, write in the comments. I will be glad to see your perspective.
____________________________________
Follow, like, and comment to see my content:
www.tradingview.com

NASDAQ Long Term Short PositionNAS moving in a parallel channel, getting resistance with bearish divergence on weekly time frame.
It's a long term trade so manage your risk accordingly.

NAS100 US100 Technical Analysis London Open / NY OpenThis video provides a detailed analysis of the NASDAQ. Presently, it has reached a robust resistance level on the weekly timeframe. The market appears quite stretched, presenting a potential counter-trend trading opportunity around the London Open. If missed, there might be another chance around the New York Open later today. Throughout the video, we delve into essential technical aspects such as price action, market structure, and the prevailing trend. It's crucial to note that this content is purely educational and should not be interpreted as financial advice.

US100 ~ Ho Ho Santa Rally or EOY Bah Humbug Bust? (4H)CAPITALCOM:US100 chart mapping/analysis.
Nasdaq 100 consolidating into key macro economic news, much like S&P 500.
Trading scenarios into EOY:
Bullish reaction to macro economic news = break above ~16167 trading range (yellow dashed) towards ascending trend-line (green) / red box confluence zone.
Bullish extension target(s) = new historical highs surpassing ~16770 November 2021 high.
Bearish reaction to macro economic news = break below ~15690 trading range (yellow dashed) + descending trend-line (light blue) towards 78.6% Fib / 200SMA dynamic support confluence zone.
Bearish extension target(s) = descending trend-line (white dotted) / ascending trend-line (green) / Golden Pocket confluence zone.

US100 NASDAQ Technical Analysis And Trade Idea NAS100Lately, the NAS100 has displayed a strong bullish trend. This video extensively explores the trend, meticulously analyzing price movements and identifying possible trading prospects by thoroughly assessing both the weekly and daily timeframes. Anticipate a detailed assessment of price behaviors, market patterns, trend assessments, and key technical analysis components. It's crucial to emphasize that the content provided is purely for educational purposes and should not be interpreted as financial advice.

us100It is in a strong resistance zone, if it breaks the green box down, the green lines can be touched, and otherwise it will enter the pressured supply zone again.
NAS100 US100 Technical Analysis and Trade Idea NASDAQIn this insightful video, we delve into the NAS100's intriguing movements as it encounters crucial resistance levels on both the monthly and weekly charts. With the week drawing to a close, we scrutinize the possibility of an assertive retracement.
Our discussion extends beyond surface analysis, encompassing market structure, intricate price actions, meticulous trend analysis, and pivotal elements of technical analysis. This comprehensive coverage sheds light on the intricate dynamics shaping the NAS100's trajectory.
As a standard practice, this video offers a comprehensive view for educational purposes. However, it's essential to clarify that the content presented here isn't intended as financial advice.

US100 CASH Long Term SELLING Trading IdeaHello Traders
In This Chart US100 CASH DAILY Forex Forecast By FOREX PLANET
today US100 CASH analysis 👆
🟢This Chart includes_ (US100 CASH market update)
🟢What is The Next Opportunity on US100 CASH Market
🟢how to Enter to the Valid Entry With Assurance Profit
This CHART is For Trader's that Want to Improve Their Technical Analysis Skills and Their Trading By Understanding How To Analyze The Market Using Multiple Timeframes and Understanding The Bigger Picture on the Charts
