ANALYSE NASDAQ IN 15 MIN dear traders nasdaq in up trend we expect correction during this trend as always trend is your friend
well if he break this trend you should sell nasdaq in 12800 you target will be in 12770
if he break this ressistance you should buy at 12850 wait always for confirmation
trade safe
Us100cash

Nas1oo BullishLooking for a sell setup in that red area just above where price is currently at. I want to see Tuesday create the low of the week, Tuesday or Wednesday Then get that expansion to take out short term high. The Long I will look to take below Monday's Lows... in that bit of imbalance just above 50% of the weekly range. I am assuming that the current weekly range we are trading in as of now will not hold and the agenda is to take buyside stops before running lower for the market crash.

NASDAQ IN 15 MIN dear traders nasdaq in range you should wait for price action you should buy in 12700 if he break this ressistance and you should sell in 12600 wait always for confirmation
trade safe

ES1! SPX500USD 2022 SEP 12 Week
ES1! SPX500USD 2022 SEP 12 Week
Last week's 3903 support provided fruitful long.
We have an engulfing bullish weekly bar. Possibility of continued
upward momentum, for long preference.
Possible Scenarios are considered:
1) Long if 4010 / 4095 is supported
2) Short on trend channel rejection / rejection at 4095 / 4010
Weekly: Ave vol up bar (engulfing bullish) = strength
Daily: Ave vol up bar close off high = minor weakness
H4: High vol bar + low vol UT bar = weakenss
Price reaction levels:
Short = Test and Reject | Long = Test and Accept
4303 4204 4029
3903 3743
Remember to like and follow if you find this useful.
Have a profitable trading week.

ANALYSE NASDAQ IN 15 MINdear traders nasdaq probably in range i expect if the market break 12200 you should sell nasdaq and if he break 12450 you should buy nasdaq always wait for confirmation
trade safe good luck

⁉️ US100 - Market AnalysisHello traders!
⁉️This is my analysis on US100 .
Here I expect bullish price action as price rejected from bullish orderblock. I am looking for a long position if price breaks the structure and retrace a little bit.
Like, comment and subscribe to be in touch with my content!

NASDAQ OPPORTONITYdear traders this trend important in nasdaq you should wait for confirmation and sell under 12140 and you could buy above 12120 always wait for something support you position confirmation
best of luck

DOW JONES US30 WARNING!!!!!!!!!!!!!!!!!!!!!!!!!Traders, be aware that something is coming and take precautions.


nasdaq in 15 min next movedear traders nasdaq gave us some of orderblock that means reaction of buyers are stronger so respect the zone and look for best entry

NASDAQ IN 15DEAR traders we all saw the down of nasdaq last week we have more important levels i give clear when you should buy or sell good luck

Market won't crash when everybody is prepared for itMarket won't crash when everybody is prepared for it.
my first target is Nasdaq to 14000.

Nasdaq Possible Trend, Bear or What ?🔴In this analysis you can see the possible trends of Nasdaq Index , Important Resistance 13730 to 14300 ! First bearish target is : 13220 .
Follow us for more analysis & Feel free to ask any questions you have, we are here to help.
⚠️ This Analysis will be updated ...
👤 Arman Shaban : @ArmanShabanTrading
📅 08.18.2022
⚠️(DYOR)
❤️ If you apperciate my work , Please like and comment , It Keeps me motivated to do better ❤️

Nasdaq short !Shorting Nasdaq, reacted from higher tf supply and gave confirmation on 15 mins tf.
Good luck & enjoy 🤞

⁉️ NASDAQ (US100) - Market AnalysisHello traders!
⁉️This is my analysis on US100 .
Here we are in a bullish market structure, so I am looking only for longs. I expect price to continue the retracement to fill the imbalance below and to reject from bullish orderblock + psychological price level 13000.
Like, comment and subscribe to be in touch with my content!

NASDAQ IN 15MINdear traders and investors we see nasdaq came back to demand zone we have reaction of buyers i expect nasdaq will be long in this postion

nasdaq in 15mindear traders i saw nasdaq has react fropn demand zone it means investors are intresstiong to buy nasdaq accourding to that i expect nasdaq will reach 12200 you could take te trade nicely

nasdaq in 15min probability to buydear traders and investors we took the first trade in 15min sell over 2500 pips gained now we see is finish for nasdaq time to jump again i expect to buy nasdaq and target will be 13221

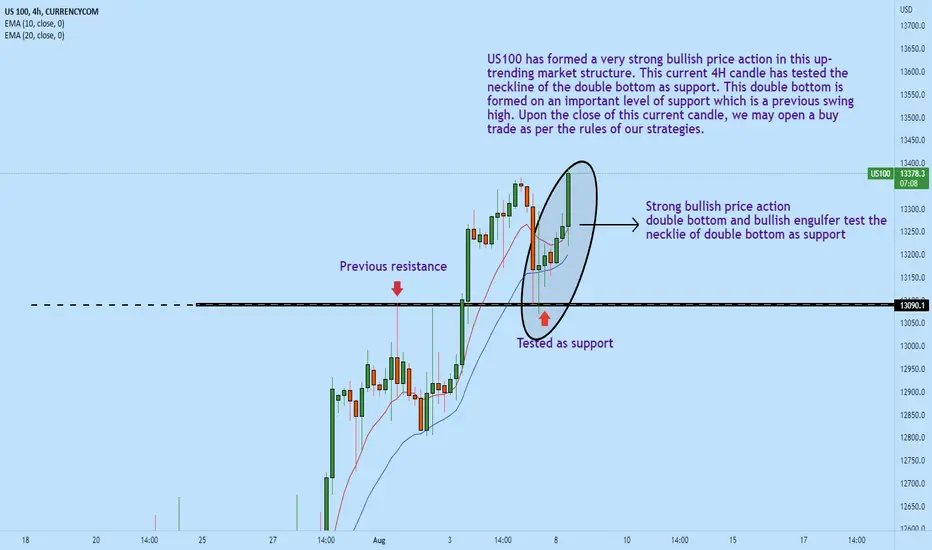
US100 possible buy zone!!US100 has formed a very strong bullish price action in this up-trending market structure. This current 4H candle has tested the neckline of the double bottom as support. This double bottom is formed on an important level of support which is a previous swing high. Upon the close of this current candle, we may open a buy trade as per the rules of our strategies.
Thank you for visiting the idea, press the like button if you find value in this content :)
us100 shortlooking for shorts at that level and targeting the liquidity below the lows for profit taking

US100 US 100 seems to have found momentum towards the upside, looking for it to reach 13590 area on the higher side. Buyers seem to have come back in the market.

us100 nasdaqIn this update we review the recent price action in the us100.cash nasdaq and identify the next high probability trading opportunity and price objectives to target

NAS100 USD NQ1! NASDAQ 2022 Aug 01 Week
NAS100 USD NQ1! NASDAQ 2022 Aug 01 Week
Last week price has reached previous supply zone. Given the upward channel,
long on retracement is preferred. And if upward channel is broken down and
resisted, then target will probably be 11348-11068.
Possible scenarios:
1) Upward channel continues for long on retracement.
2) Possible formation of range 12971 - 11348-11068
Weekly = Ave vol up bar close toward high = minor strength
Daily = Ave vol up bar close off high = minor weakness
+ engulfing bearish reversal candle = S>D
H4: UHV narrow spread up bar + high vol up bar close off high = weakness
Price reaction levels:
Short on Test and Reject | Long on Test and Accept
12906 12442
12262 - 11348 rotation zone
11800 11068 10359
<10,000 break of psychology support
Remember to Like and Follow if you find this useful.
Have a profitable trading week ahead.
