NAS100 - WHAT THE F*** IS GOING ON? (KEY LEVELS)Hey Traders, yesterday’s market shake-up wasn’t just about the Fed's chess moves. A trifecta of less-than-stellar employment data, lukewarm tech earnings, and regional bank jitters sent the NAS100 on a rollercoaster, underscoring the fragile nature of our current economic landscape.
The Fed's stance was the talk of the town, maintaining a rate plateau between 5.25% and 5.5%. But here's the kicker: the Fed's not just playing hard to get with rate cuts—they want to be absolutely sure inflation is well-tamed before making a move. The puzzle? Inflation's at a tame 1.9%, yet they're still holding out for a clearer sign.
Powell's cool-headed presser post-meeting hinted at a 'wait and see' approach, calming fears of economic overheating or cooling. The good news? Inflation's behaving, and growth is chugging along. But the markets are twitchy, and the odds of a March rate cut have edged down from 'likely' to 'let's talk later.'
Now, let's bring in New York Community Bancorp’s plunge into the mix. Was it a one-off, or a canary in the coal mine for the banking sector? Concerns over credit quality and margins are in the air, with all eyes on whether this spells broader banking woes or just a case of merger indigestion.
As we gear up for our NAS100 price action analysis, these economic plot twists are crucial. They're the backdrop to every candlestick and trend line we're about to dissect. Stay tuned as we unravel the price story against this economic saga.
Based on the provided chart of the US 100 index and considering the backdrop of the latest economic news, here is an analysis that blends market sentiment with price action analysis:
What is on the chart? (key levels to look out for)
1) We have our retracement levels + the 4 hour FVG and BOS level. This area is a key resistance zone.
2) The order block that might provide us with a temporary (or permanent) bottom. You can consider it as a support level and it will determine the next step in our price action story.
3) Key daily level that is a great support area. You have the FVG + BOS level (previous ATH so significant) + discounted area.
4) This is a significant sellside level that I doubt will be broken with the current outlook which is more uncertain than bearish but still important to outline.
CONCLUSIVE SENTIMENT: Given the current economic context where the Fed is cautiously optimistic yet not ready to lower rates, the failure to break the ATH in the index could reflect a market that is wary of overextension and preparing for a period of consolidation or retracement. Investors may be taking a more defensive posture, awaiting further economic indicators before committing to a direction.
In essence, the sentiment appears to be one of caution, as reflected in the index's price behaviour and recent economic developments. Traders are advised to watch the key technical levels and stay informed on economic updates, as these could significantly impact market direction in the near term.
As always, stay cold headed and keep your money close! HAPPY TRADING!!!!
Us100short

US100 M30 / Short Trade Opportunity on US indices ✅ Hello Traders!
This is my Idea related to UA100. I expect a bearish move if confirms the breakout of the mentioned BOSS. It also will be a sign of a bearish market structure.
I expect that FVG H1 will be closed, this area represents also my target.
Traders, if you liked my idea or if you have a different vision related to this trade, write in the comments. I will be glad to see your perspective.
____________________________________
Follow, like, and comment to see my content:
www.tradingview.com

NAS100 - MY INTRADAY ANALYSIS (TARGET 16630)Here I'm trying to change things up with a smaller timeframe (15min) analysis because the daily is nice but how does one trade that? Well here you have it.
What is on the chart?
1) Yesterday's session low, aka sellside liquidity, that hasn't yet been taken out which gives us a juicy target for the day.
2) Yesterday's consolidation that gave the upper hand to bulls in the AM session but now it serves us for our bearish bias of the day.
3) Price wicking once more in the daily FVG and not taking out the high. Great news for bears.
4) Price retraced back into the reload zone (0.702 notably) and furthered its descent into bear territory.
5) Bearish 1 hour order block. Will be used partly for our entry coupled with the fibs.
6) London session lows that will also serve as a target. When there's an accumulation of targets it increases the probability of success when placing a trade aiming in that direction.
7) My ideal entry. To your own discretion, I can afford losing 1%, can you? (affording something isn't just monetary can also be psychological. Can you cope with losing your money once more because of the idea of a stranger on the internet?)
8) The outcome I'm looking for. If we're going for a bearish scenario this is what should (I want to) happen.
NOTE: Retail Sales data release 08:30 NY time. Could make it or break it.
Happy trading and have a nice day! ;)

US100 M30 / NASDAQ SHORT TRADE OPPORTUNITY💲✅Hello Traders!
This is my idea related to US100 M30. I see more bearish signals at the moment, for example, the chart did not set a new high, meaning that the Bulls are weak. Accumulation at the ATH level and the beginning of the bearish domination after a breakout. My target for this trade is the price of 16360.
Traders, if you liked my idea or if you have a different vision related to this trade, write in the comments. I will be glad to see your perspective.
____________________________________
Follow, like, and comment to see my content:
www.tradingview.com

US100 H4 / LONG TRADE OPPORTUNITY 📈 ✅Hello Traders!
This is my idea on US100 H4. I see a perfect retracement from the resistance level marked on the chart. I consider this a good sign of a small retracement.
Traders, if you liked my idea or if you have a different vision related to this trade, write in the comments. I will be glad to see your perspective.
____________________________________
Follow, like, and comment to see my content:
www.tradingview.com

US100 H4 / POSSIBLE RETRACEMENT UNTIL THE PRICE 15735 ✅Hello Traders!
This is my perspective for US100 H4. NASDAQ just set a new ATH (All Time High), and now I expect a retracement until the price of 15735. A very strong move this week. In case of confirmation, it would be a good opportunity to execute a short trade.
Traders, if you liked my idea or if you have a different vision related to this trade, write in the comments. I will be glad to see your perspective.
____________________________________
Follow, like, and comment to see my content:
www.tradingview.com

US100 Daily Analysis After taken liquidity of the buy side and reject C.E of FVG ''BISI'' we will see a drop of the price to taken liquidity of the sell side and fill FVG ''BISI''
- Tading is probability control your risk management.
Good luck !

sell us100 sell us100
inverted cup
tp1 15840
tp2 15730
sl 16065
good luck for all
trade at your own risk

US100 CASH Long Term SELLING Trading IdeaHello Traders
In This Chart US100 CASH DAILY Forex Forecast By FOREX PLANET
today US100 CASH analysis 👆
🟢This Chart includes_ (US100 CASH market update)
🟢What is The Next Opportunity on US100 CASH Market
🟢how to Enter to the Valid Entry With Assurance Profit
This CHART is For Trader's that Want to Improve Their Technical Analysis Skills and Their Trading By Understanding How To Analyze The Market Using Multiple Timeframes and Understanding The Bigger Picture on the Charts

US100 ANALYSIS After taken liquidity of the buyside and shift market structure and retest of Breaker and FVG we will see a drop of the price

US100 crash ready to starthello dear trader and investors
It’s actually already starting - and it has the potential to cause a depression. And the Federal Reserve has been forced to print billions of dollars in fake money, which is only exacerbating the situation.
But once the dust settles, I strongly believe that by 2025, gold will be valued at $5,000 per ounce, silver will be valued at $500 per ounce, and Bitcoin will be valued at $500,000. Why? Because people's faith in the US dollar will be destroyed.
On the other hand, Bitcoin has emerged as the people's currency. Because it’s decentralized, secure, and free from government manipulation. As a result, more and more people are turning to Bitcoin as a store of value and a hedge against inflation.
Dollar is dying and stock is not a good place to invest in this economic crisis
good luck
mehdi

US100 NAS100 Technical Analysis And Trade IdeaIn this presentation, we undertake a thorough analysis of the NASDAQ US100, concentrating on the prevalent bullish sentiment within the 1-month (1M) and 1-week (1W) timeframes. Significantly, our charts reveal that the US100 is currently approaching a critical resistance level, marking a pivotal juncture. Throughout this discourse, we delve into the fundamental principles of technical analysis, encompassing essential elements such as assessing the existing market trend, price dynamics, market structure, and other crucial facets of technical analysis. As we proceed through the video, we meticulously examine a potential trading opportunity within the NAS100.
It is crucial to emphasize that the insights shared in this content are intended exclusively for educational purposes and should not be interpreted as financial advice. Engaging in foreign exchange market trading carries a substantial level of risk. Therefore, it is imperative to judiciously incorporate robust risk management strategies into your trading plan to effectively navigate these challenges.

US100 Technical Analysis And Trade Idea NAS100In this video, we conduct an extensive analysis of the US100 NASDAQ, with a primary emphasis on the prevailing bullish price swing observed in the 1-day (1D) and 1-week (1W) timeframes. Notably, the currency pair is approaching a pivotal resistance level, indicating the potential for another leg down. Throughout our discourse, we delve deeply into the intricate facets of technical analysis, encompassing the current market trend, price dynamics, market structure, and other pivotal elements of TA. As we progress through the video, we take a look at an potential trade opportunity.
It is of utmost importance to underscore that the information provided in this presentation is intended solely for educational purposes and should not be construed as financial advice. It is imperative to recognize that engagement in foreign exchange trading carries a substantial degree of risk. Consequently, it is vital to judiciously integrate robust risk management strategies into your trading plan.

NASDAQ working with liquidityHello trader! Today, let's trade the good old US100. A nice setup has formed for entry and taking out the lower liquidity. There are possibilities that the price may go and take out the liquidity from above, but the chances of a move downwards are much higher.
🚀Please support my efforts with the "Boost" button.
❤️And a comment is the best thing you can do for me now!

NAS100 Technical analysis and Trade Idea US100In this video, we conduct an in-depth analysis of the NAS100. Taking a close look at both the weekly and daily timeframes, we can see the emergence of a prominent topping chart pattern characterized by a sequence of lower highs and lower lows, prominently visible on the US100 daily chart. In this video, we delve into various facets of technical analysis, including the prevailing trend, price action, and market structure. We also explore a potential trading opportunity. As always, it's crucial to emphasize that the content presented is solely for educational purposes, and it should not be construed as financial advice.

US100 Sell Signal 13/10/23 08:00 GMT +2Trade Details
Sell Limit Given
Entry: 15232.9
Take Profit 1: 15173.6
Take Profit 2: 15088.7
Take Profit 3:
Stop Loss: 15261.5
Simple Reasoning
Aggressive Choch
Breaker Block Entry
LQ to the top side sweep
LQ towards the bottom as a target
Provided a 5% risk to reward

NASDAQ US100 SUPER BEARISH !! H&S FORMED hello guys ,
as i previously analyzed last weekend on the weekly tf nasdaq or us100 is very bearish in my eyes.
as i predicted perfectly the price closed below a bullish trendline and it failed the create a higher high also forming a double top.
i highly highly request from you that you take a good look at my last week analysis
today on the daily tf it looks like a head and shouldrs was formed waiting for the break out of the neckline for the full confirmation.
it looks very very bearish to me , i am open to hear you ideas and insights

NASDAQ A WARNING OF A POSSIBLE CRASHhello traders i hope you had a profitable week , today we are taking a look at US100.
since the beginning of 2023 Nasdaq Started a Bullish Move from 10690s to 1590s.
Analysing the WEEKLY tf we can see that the buyers dominated the market which caused the price to form higher and higher highs and forming a BULLISH TREND LINE .
But it this summer it seems like the buyers are weakening since the price recently failed to form a higher high instead it broke market structure and formed a lower high.
The RSI indicator can confirm this statement as it indicates a Bearish divergence since the beginning of june (price forming higher highs on chart but lower highs in rsi).
indicating the strenght of the buyers is declining.
we can also spot A reversal pattern the DOUBLE TOP which also indicates this possible bearish reversal.
Here are our Bearish Clues :
- Break in Market structure
- DOUBLE TOP formed
- Bearish RSI signal
Confirmation : Break of the Bullish Trendline
Extra Confirmation : Break of the double top neckline.
i believe the market my start a strong bearish move that will push the price down atleast to the 14000s.
i post SETUPS and analysis for free on my trading view for FREE be sure to follow me to not miss out.
this is not financial advice just my humble opinion trade safe !

US100 NASDAQ Technical Analysis and Trade IdeaThe NAS100 has encountered a significant support level followed by a minor retracement. Although the prevailing trend is undeniably bearish, the pivotal question revolves around the depth of the potential pullback, which could serve as an entry point for us. Within the video, we comprehensively address multiple facets of technical analysis, encompassing the trend's dynamics, price action, market structure, and more. I want to emphasize that the video provides a thorough explanation of all these elements, however, should not be interpreted as financial advice.

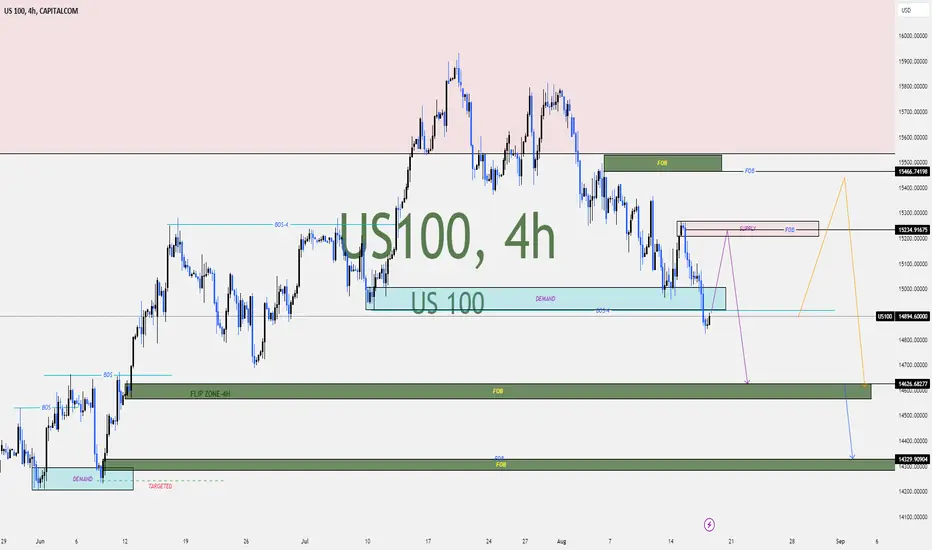
US 100Investors reaction to disappointing data from China's economy is reflected in the bearish momentum we are presently witnessing. We have a break of a previous flip zone which informs our bearish outlook of this index. We have two possible entry points; 15234 and 15466. I favour the former entry targeting to exit at 14626 or 14329 if I am patient.
US100 Bearish Move hello traders so after doing a quick analysis on us100 it appears the it might be going bearish next week.
first we have the price closed below a raising trendline with a inversed hammer on one of the candles.
it also closed below a support level.
we have the rsi indicating bearish signs .
this is just my personal opinion not financial advice trade safe !

US100 NAS100 Technical Analysis and Trade IdeaIn this video, we closely examine the US100 NASDAQ, which is currently experiencing a distinct downtrend. We don't see any indications of the trend shifting in the near future. Additionally, we delve into the potential of a pullback and identify an optimal entry point short for the NAS100.
Please note: This content is intended solely for educational purposes and should not be interpreted as financial advice.

NDQ100, US100 CFD NASDAQ 4AM 8-1 SELL 75%w 13R:RStrategy alert on 1h SELL signal 8-1-2023 4am est
1st profit target 15623 .83% avg trade 75% w 13.6 Risk/Reward
Close 15580 1.16 winning trade
19hr typical trade
ALL INDICATORS ARE CONFIRMED DOWNSLOPING
ATR super pivot, Linear Regression (rsi), Dynamic Money Flow (1:1weighed), L3 banker funds
STOP LOSS AT NEW SIGNAL LONG buy
