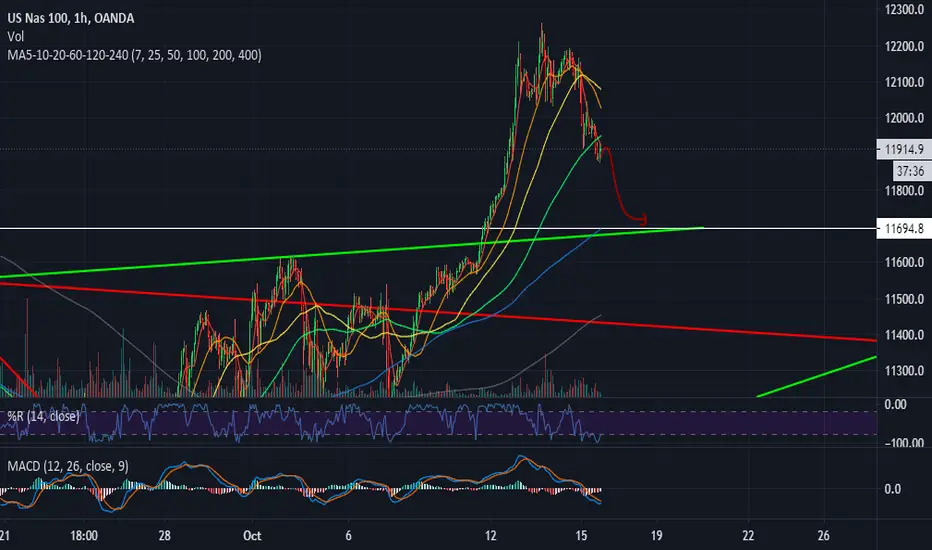
US100 12750.3 + 3.32 % LSHORT IDEA * PRICE ACTION & STRUCTURE Hey everyone
A look at NASDAQ, hope you are having a good one.
* Nasdaq has been trading in a descending channel on the 4H CHART RESPECTING structure we saw a test of the base of structure and a push up
with the bulls into a bear flag, currently consolidating in this structure.
* Looking this structure to hold and see a continuation of the bearish move targeting FIB EXT 0.618
* follow your entry rules on entries
* significant moves with the bulls change the plan.
* TIGHT SL
lets see how it goes.
AS ALWAYS PROPER RISK MANAGEMENT AND A LOT OF PATIENCE & AGAIN many stars must align with the plan before executing the trade, kindly follow your rules.
HAPPY TRADING EVERYONE & LET YOUR WINS RUN...
_________________________________________________________________________________________________________________________
ENTRY & SL - FOLLOW YOUR RULES
RISK-MANAGEMENT
PERIOD - SWING TRADE
__________________________________________________________________________________________________________________________
If this idea helps with your trading plan kindly leave a like definitely appreciate it.
Us100short

US 100 SHORTlooking at a 1 month charts, with the completition of the 5 th impulse elliot waves.
we can see that every waves did bounce on a fibo retraement/exension combinaison (i noted the one i don't show on the chart)
also a simple extension of wave 1 give us a clear sign of the end of the 5th wave.
it's actually to see a market following fib level that perfectly (i let one fib extension so you can see how the price move perfectly into each fib levels.
but this is also a warning. ether we have a bear correction of the market ether we have a chopi market incoming.
i wouldn't recomand to any investor to put their monney into the stock market as of current time.
risk to reward isn't in your favor anymore

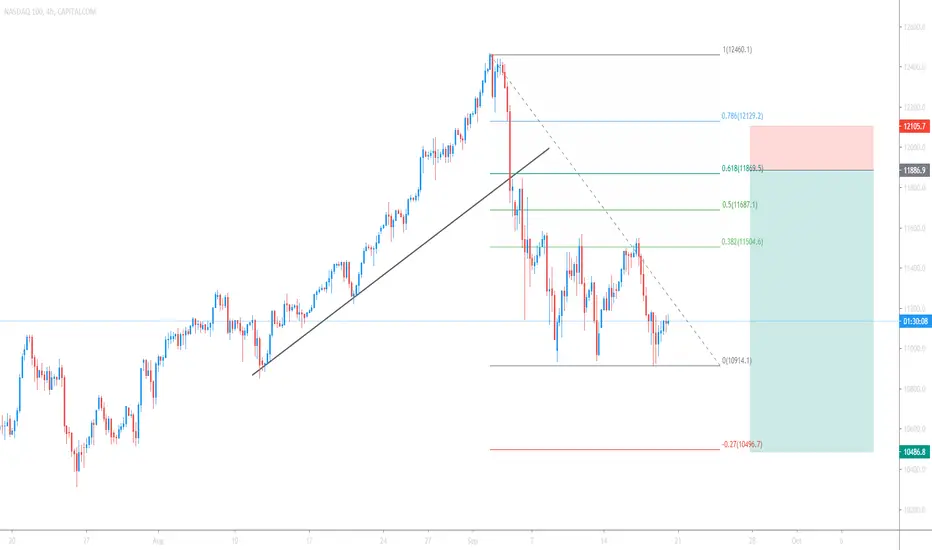
US100 - POSSIBLE - SELL TRADE SETUPUS100 - Looks Like the Market shifts the momentum.
Well, this is not a Signal. Before open any trade make sure you did your work completely.
What do you think about this?
Comment below or share your idea.
Please LIKE and Support us. Thanks


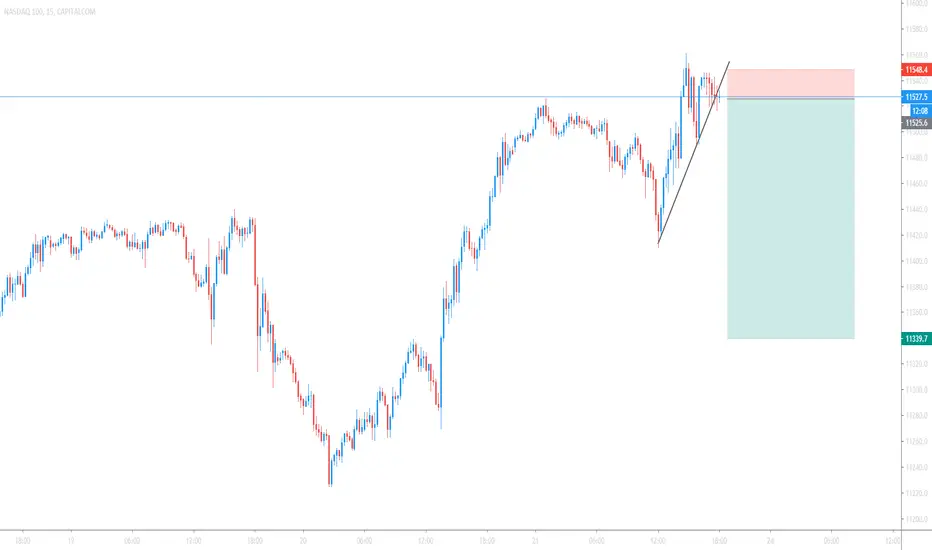
US100 Bearish divergence in M1 TFwe find a confirm bearish divergence in M1 Time frame.
so we are expecting to short this pair

US100 TECHNICAL ANALYSISAs we can see market is still down in a channel. So we can expect a short term reversal till its uper trendline. or can go down more till 0.786 level.
Lets see what can happen.
over all target is 12507.


US100 Continued growthUS100 Continued growth
✅ If you like my analytics bet 👍
Subscribe to keep abreast of my predictions.
I would also be glad to see your comments under the idea, what do you think about this?

NAS100, Coming Down!Yesterday on my weekly analysis, I said that I'd be selling US100 due to price being @ Monthly Resistance Zone which has been respected mutliple times
Entry:12297.0
SL:12523.7
TP:12070.4
TP2:11957.0
TP3:11843.7
The trade has already hit my TP1 &2, SL moved to brekeven with the last position running in profit
I am now running Lifetime signals into my group, feel free to contact me!

US100 / SHORT?? Based off of technicals..I see a broken trendline and what looks like some janky retest.. IF I am correct we should expect to see a drop to the -0.27 Fibo extension level
Technical world records in Sept . 2020Indicators:
RSI D1 -> World Record
SMA200 D1 distance -> World Record
Bollinger Monthly -> World Record
______________________________
Conclusion Dot.Com 2.0 bubble is real

us100Hello traders, here is the analysis from our team :
sell: 11098
target #1 11095
Target: 11085
Stop : 11111
Money management : 11095
Part #1 of spread trade.
Let us know in the comment section below if you have any questions.😉


US100 10840.3 - 0.14% * UPDATE IDEA - CONTINUATION PATTERNSGood Day Everyone
An update on NASDAQ which pushed up to test resistance level 11063.0 forming a double top at this structure now pushing down rejected at 61.8 Fibonacci level, looking for continuation with the bears as we are currently trading in a bear flag which could be signalling continuation to the down side with the bears lets see how it goes...
Good luck and happy trading everyone
_________________________________________________________________________________________________________________________
ENTRY & SL - FOLLOW YOUR RULES ON PENDING ODER & SO FORTH
RISK-MANAGEMENT
PERIOD - DAY TRADE
__________________________________________________________________________________________________________________________
If you like the idea kindly leave a like and a follow will definitely follow back and leave your idea & Comment on the pair in the comment section.

US100 10633.1 +0.84% SHORT IDEA * STRUCTURE & TECHNCALS ANLYSISGood Day Everyone
A look at NASDAQ which is currently trading at 38.2 % Fibonacci level within a ascending triangle structure which could signal continuation to the down side as we saw a couple of rejections at level 10674.3.
NASDAQ is currently range bound in structure which could be a good opportunity for the more aggressive traders before we could see more volatility coming into play...
let's see how it goes
Good luck and happy trading everyone
_________________________________________________________________________________________________________________________
ENTRY & SL - FOLLOW YOUR RULES ON PENDING ODER & SO FORTH
RISK-MANAGEMENT
PERIOD - SWING TRADE
__________________________________________________________________________________________________________________________
If you like the idea kindly leave a like and a follow will definitely follow back and leave your idea & Comment on the pair in the comment section.
