Fibonacci Retrace Strategy NAS100 Trade Idea📈 NASDAQ 100 (NAS100) is holding a strong bullish trend 🚀. After a weekend gap-up 🕳️➡️📈, price retraced back into the gap zone—exactly what you'd expect in a healthy trending market.
🔍 I'm applying my Fibonacci Expansion + Retrace Strategy 🔢, watching closely for a pullback into equilibrium ⚖️ within the previous price swing. That’s where I’ll be waiting for a bullish market structure break 🔓📊 to confirm my long bias.
🧠 Patience is key here—let the setup come to you.
📌 As always, this is not financial advice!
Us100signal

US100 Bullish Breakout!
HI,Traders !
#US100 is trading in a strong
Uptrend and the price made a
Bullish breakout of the key
Horizontal level of 23261.4
So we are bullish biased
And we will be expecting a
Further bullish move up !
Comment and subscribe to help us grow !

NAS100 Bullish Setup: Clean Structure & Entry Zone Pending📊 NASDAQ 100 (NAS100) remains bullish, showing a clean, well-structured uptrend—higher highs and higher lows 🔼📈.
Price has now pulled back into my optimal entry zone 🎯. At this stage, I’m waiting for a bullish break in market structure before considering an entry 🟢🔓.
Patience is key—let the structure confirm first.
Not financial advice ❌💼

US100 Strong Bullish Breakout!
HI,Traders !
#US100 is trading in a
Strong uptrend and the
made a bullish breakout
Of the key horizontal level
Of 22879.1 so we are
Bullish biased and we will
Be expecting a further
Bullish move up !
Comment and subscribe to help us grow !

NASDAQ 100: AI Momentum and Resilient Earnings Drive New HighsThe NASDAQ 100 continues its strong uptrend 📈, recently breaking to new highs after a period of consolidation. The rally is broad-based but remains led by heavyweight tech names and AI-related stocks 🤖.
Key Fundamental Drivers:
AI & Tech Growth 🤖💡: The biggest catalyst is the ongoing boom in artificial intelligence and digital transformation. Companies in the index, especially the “Magnificent Seven” (like NVIDIA, Microsoft, Apple), are seeing robust earnings growth and strong investor demand for AI exposure. Global IT spending is projected to grow by over 9% in 2025, with AI spending up nearly 30% year-on-year.
Earnings Resilience 💪💰: Despite high interest rates and inflation, tech companies have adapted well, maintaining strong margins and growth. The sector is expected to remain a top performer through 2025.
Fed Policy & Rate Expectations 🏦🔮: Markets are increasingly pricing in a pause or even cuts in US interest rates later in 2025, which is bullish for growth stocks and tech-heavy indices like the NASDAQ 100.
Geopolitical & Macro Factors:
Reduced Uncertainty 🌏🕊️: The market has absorbed major geopolitical shocks (such as the Israel-Iran conflict and US-China trade tensions), and the resolution or de-escalation of these risks has reduced uncertainty, supporting risk assets.
US Election & Policy 🇺🇸🗳️: The outcome of the US election and expectations for stable or pro-business policies have also contributed to positive sentiment.
Global Supply Chains & Resilience 🌐🔗: While some risks remain (e.g., cyber threats, regulatory changes, and supply chain disruptions), the tech sector’s global reach and adaptability have helped it weather these challenges.
Why is it rallying now?
AI optimism and strong tech earnings are the main drivers 🤖💹.
Expectations of easier Fed policy and a resilient US economy are fueling risk appetite 🏦📈.
Geopolitical risks have eased or are being priced in, allowing investors to focus on growth 🌍🕊️.
Summary:
The NASDAQ 100’s rally is powered by AI-driven tech growth 🤖, resilient earnings 💪, and easing macro/geopolitical risks 🌏. The index remains a global leader as investors bet on the next wave of technology and digital innovation 🚀.

US100 Short From Resistance!
HI,Traders !
US100 is weaker than we
Expected and failed to break
The key horizontal level
Around 22868.6 and we are
Now seeing a bearish rejection
So we are locally bearish biased
And we will be expecting a
Further bearish move down !
Comment and subscribe to help us grow !

US100 Resistance Cluster Above!
HI,Traders !
#US100 made a bearish
Breakout of the support
Cluster of the rising and
Horizontal support levels
Which is now a resistance
Cluster round 22703.9 then
Went down and made a local
Pullback on Monday but we are bearish
Biased mid-term so we
Will be expecting a further
Bearish move down this week !
Comment and subscribe to help us grow !

US100 Very Strong Uptrend!
HI,Traders !
#US100 is trading in a
Very strong uptrend and
broke a key horizontal
Level around 22688.6 which
Is now a support and we
Are already seeing a rebound
So we are bullish biased
And we will be expecting
A further move up !
Comment and subscribe to help us grow !

US100 Will Go Down!
HI,Traders !
#US100 made a retest
Of the wide horizontal
Resistance around 22688.6
And we are already seeing a
Local bearish reaction so
We will be expecting a
Further bearish move down !
Comment and subscribe to help us grow !

Smart Friday Trades: NASDAQ Setup and Key Levels to Watch NAS100📊 NASDAQ US100 Analysis – Friday Setup
I'm currently watching the NASDAQ closely 👀. The NAS100 looks significantly overextended 📈, and with it being the end of the week, we often see price action push into the weekly high before pulling back into the weekly close 🔁.
This is a pattern I’ve seen play out many times during the New York session on Fridays 🗽📉.
💡 Here’s my suggestion:
Wait for today’s data release 📅 to finish. If price ranges and then breaks market structure to the downside, keep an eye out for a short entry on the retrace and retest of the range low.
🎯 Your targets and stop loss are outlined clearly in the video, so make sure to watch it through.
⚠️ Trade sensibly, manage your risk, and don't rush into anything.
I'd love to hear your thoughts in the comments 💬
Have an awesome day and I’ll see you in the next one! 🚀

Market Structure Breakdown on NASDAQ: What Traders Should Watch📉 NASDAQ (NAS100, US100) Analysis 🧠💼
I’m currently keeping a close eye on the NASDAQ (NAS100) — price action is telling a story worth watching.
📆 Last week, the index came under clear pressure, and now on the 4H timeframe, we’re seeing a defined bearish structure with consistent lower highs and lower lows 📉🔻. This recent expansion to the downside has led to a break in market structure (BOS), and price is now pulling back into equilibrium 🔄.
⏳ For now, it’s a waiting game. I’m watching to see if this pullback finds resistance at a premium level and rotates back to the downside, which would present a potential short setup 🎯📊.
🕒 On the 30-minute chart, I’m monitoring for a clear structural shift — a change in momentum that confirms bearish intent. Should the NASDAQ resume its downward move, it could trigger risk-off sentiment, bringing strength into the JPY pairs 💴🚨 as capital flows out of risk assets.
⚠️ Disclaimer:
This analysis is for educational purposes only and should not be considered financial advice. Always conduct your own research and consult with a licensed financial advisor before making any trading decisions. 📚💼

NASDAQ Consolidation: Why Sitting Out Is Sometimes the Best PlayI'm currently monitoring the NASDAQ (US100) closely, and on the 4-hour chart, we can clearly see that the market is in a phase of consolidation 🔍
Yesterday, I was anticipating a bullish breakout, which could have signaled the start of a structure with higher highs and higher lows — something that would have presented a clean long opportunity 📈. However, during the U.S. session, the NAS100 momentum shifted and we instead saw a bearish breakdown, invalidating the previous setup 🚫
As things stand now, there's no clear directional bias on the 4H — just a sideways range with neither bulls nor bears in full control 🤝. This type of environment calls for patience and discipline.
It's worth noting that knowing when not to trade is just as important as knowing when to pull the trigger. Sitting on the sidelines and allowing the market to make the next move — whether that’s a break above or below this consolidation range — is a valid and often wise decision 🧘♂️📊
At the moment, my preference is to remain neutral and let price show its hand before committing to a position.
⚠️ Disclaimer:
This analysis is for educational purposes only and does not constitute financial advice. Always do your own research and apply proper risk management when trading.

NASDAQ 100 Bullish Breakout Potential: What to Watch NextI'm currently monitoring the NASDAQ 100 (NAS100) very closely. Building on yesterday’s outlook, we've now seen a clear bullish structural shift — price is holding firm above a recent higher high and higher low, suggesting the early stages of a potential trend continuation 📈
Zooming into the 30-minute chart, we can track price action more precisely. I’m watching for a decisive break above the current range high on this timeframe. If we get the break → retest → rejection pattern, this would confirm bullish momentum and provide a long opportunity 🚀
Should this scenario play out, we could also see JPY pairs strengthen to the upside, as a risk-on sentiment flows through the markets 🧭
🔍 This setup is developing — as always, patience and precision are key.

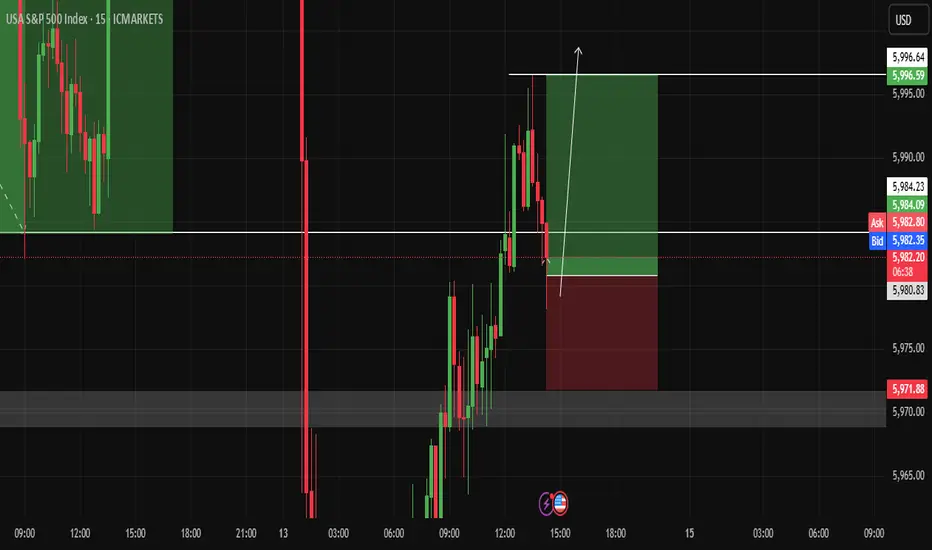
-(update)- Opportunity for buying NASDAQ After careful observation and relying on support and resistance, I see an upward movement from the support represented in front of you.


Opportunity to buy NASDAQBy combining support and resistance, I see NASDAQ rising to 5996 before reaching to 5971
NASDAQ INDEX (US100): More Growth Ahead
For some unknown reason, I was asked by a dozen
of my subscribers to provide the update for US100.
Since early May, the index successfully updates the highs on a daily.
Such a tendency will remain at least till a test of a current ATH.
I think that the market is going to grow and reach at least 22100 level soon.
❤️Please, support my work with like, thank you!❤️

Volume Power System Signal to Buy Nasdaq We have a good signal from ouer System VPS to buy the NASDAQ and hold the position until a new reversal signal appears.


NASDAQ Trade Setup: Bullish Bias, But Waiting for Retrace!✅ NASDAQ Breakdown: Waiting for the Retrace 🎯
I'm currently watching the NASDAQ 🧠, and here's what I'm seeing across multiple timeframes:
📈 Daily & 4H Timeframes show a strong bullish rally with significant momentum. However, in my view, price is overextended and currently trading at a premium.
📉 Although my bias remains bullish, I'm anticipating a retracement into equilibrium—specifically around the 50% to 61.8% Fibonacci zone 🔁. This would offer a more favorable entry based on value.
📊 In this video, I walk you through:
- The overall trend direction
- Where and how we can anticipate a break of market structure for a clean entry
- Why my buy idea is conditional on the 30-minute chart trending down, then flipping bullish via a structure break 🔄
⚠️ Patience is key! The trade setup may play out at various price levels—wait for confirmation from price action, as detailed in the video 🎥.

Reversal Target: 18,800 USD1. Price Action
The price has been trending within an ascending channel.
It recently touched the upper boundary of this channel and entered a resistance/support zone (marked in red at the top).
The blue arrow suggests a projected breakdown from the channel.
2. Support & Target
The target zone is marked around 18,800 USD, with a label and flag indicating this as a key level.
This zone is also aligned with a previous consolidation area and possibly strong historical support.
3. Indicators
EMAs:
50 EMA (red line): 20,762.7
200 EMA (blue line): 19,861.5
The price is currently above both EMAs, typically bullish, but divergence from the channel and potential resistance may imply an upcoming correction.
RSI:
Currently at 65.03, nearing overbought territory (70).
The RSI shows a bearish divergence—price makes higher highs while RSI stays flat or dips slightly.
4. Implications
If the price breaks below the channel and 50 EMA, a move toward 200 EMA or the marked target zone (around 18,800 USD) is likely.
Traders may look for confirmation via a break of lower trendline support, a strong red candle, or declining volume before entering short.

NASDAQ Fall? US100 AnalysisHello everyone.
We had a volatility at stock market last 2 month, it looks like market had good correction and found new buyer. BUT I DON'T THINK LIKE THAT.
After MR. Trump inauguration we saw bear market signals, it was like hedge funds dumped stocks, but after strong sell new buyers came at market and show us pretty good market correction but what will be next? The last 2 months brought intense volatility post-Trump’s inauguration. Hedge funds sold off heavily (S&P 500 dropped ~8% from its December high), but buyers stepped in, pushing a 5% retracement. RSI on SPY shows oversold conditions fading, yet I’m skeptical of this bounce.
Why? Bearish signals linger. VIX remains elevated (>20), and volume on up days is weaker than selloffs. Plus, geopolitics could derail this rally. Over the weekend, Ukraine and Russia discussed a 30-day ceasefire. If talks fail, the West’s new sanctions could spike oil prices (Brent crude already testing $80) and hammer energy-heavy indices like XLE or European markets (DAX).
I’m watching SPY’s 200-day MA (~510) as key support. A break below could signal a deeper pullback to 480. Energy and tech (QQQ) look vulnerable if sanctions hit. What’s your take—buying this dip or bracing for more downside?
Here is my 2 scene what i am expect from market, for me Scene and technical view scene 2 is more logical bur we will see what will be next step for stock market.
For collaboration text me in DM!!!
Always make your own research!!!
