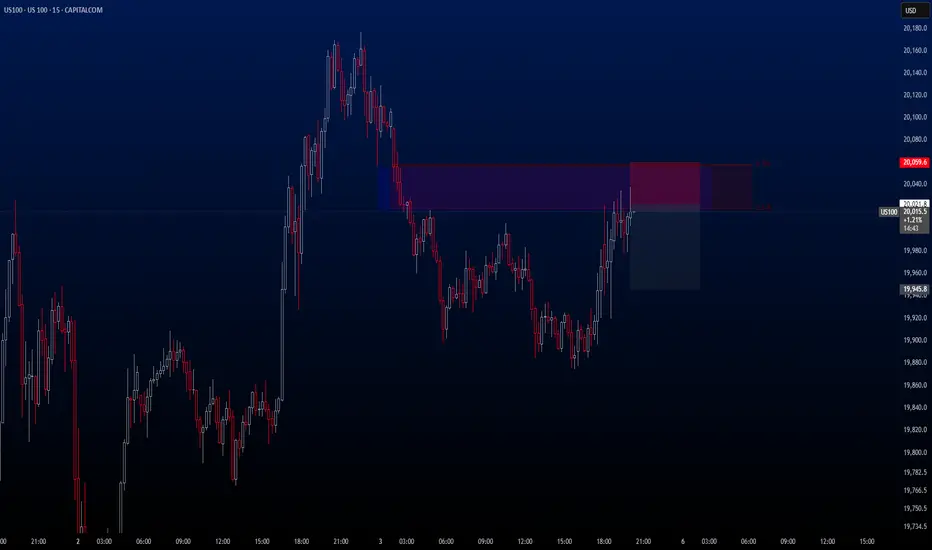
US100There’s a **Sell opportunity** forming on **US100**, but this one carries a bit more risk compared to the others.
That’s why I recommend opening the trade with a **smaller lot size** just for this setup.
🔍 **Criteria:**
✔️ Timeframe: 15M
✔️ Risk-to-Reward Ratio: 1:2
✔️ Trade Direction: Sell
✔️ Entry Price: 20021.8
✔️ Take Profit: 19945.8
✔️ Stop Loss: 20059.6
🔔 **Disclaimer:** This is not financial advice. It's a trade I’m taking based on my own system, shared purely for educational purposes.
📌 If you're also interested in systematic and data-driven trading strategies:
💡 Don’t forget to follow the page and subscribe to stay updated on future analyses.
Us100signal
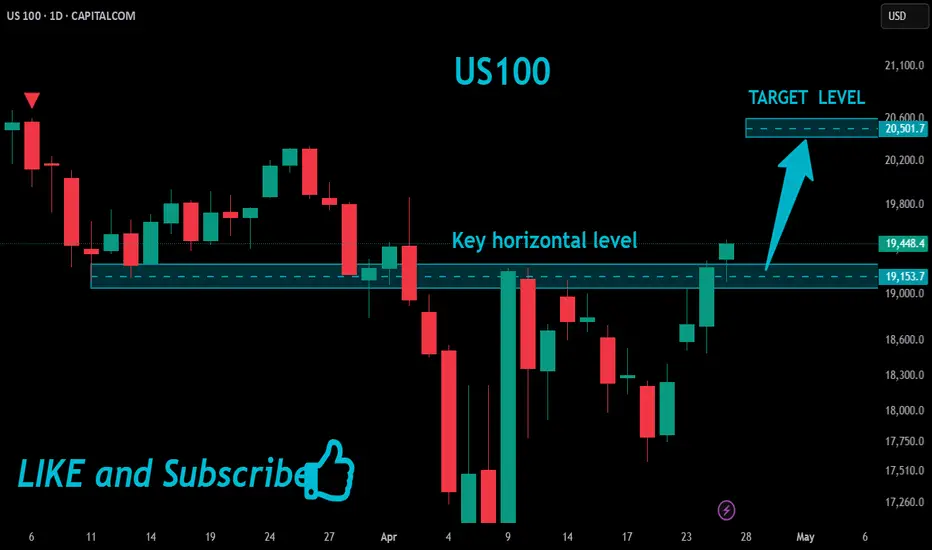
US100 Bullish Breakout!
HI,Traders !
US100 is trading in an
Uptrend and the pair made
A bullish breakout of the
Key horizontal level of 19153.7
And the breakout is confirmed
So we will be expecting a
Further bullish move up !
Comment and subscribe to help us grow !
NAS100 Testing Lows: Will a Bounce Offer a Sell Opportunity?NAS100 Technical & Fundamental Analysis 🧐
Overall Sentiment: The current market sentiment surrounding tech stocks and the broader indices like the NASDAQ 100 appears cautious, leaning bearish. Factors like persistent inflation concerns, uncertainty around the Federal Reserve's future interest rate path 🏦, and ongoing geopolitical tensions can weigh heavily on growth-sensitive assets like tech stocks. Keep an eye on upcoming economic data releases (CPI, PPI, FOMC minutes) as they could significantly sway sentiment.
1. Daily Timeframe (D1): The Bigger Picture 🗺️
The NAS100 is exhibiting clear bearish characteristics on the daily chart, forming lower highs and lower lows.
Price is currently approaching or testing a significant area of previous daily equal lows. This is a critical zone ⚠️. Why? Because significant buy-side liquidity often rests below such lows (in the form of stop-loss orders from long positions) and sell-side orders may trigger if these levels break decisively.
A strong break and close below these daily lows could signal a continuation of the major downtrend, potentially accelerating selling pressure. Conversely, this area could act as temporary support, prompting the pullback you're anticipating.
2. 4-Hour Timeframe (H4): The Setup Structure 🏗️
My H4 chart clearly illustrates the recent sharp decline. Price is currently testing the support zone highlighted (around 17,800 - 18,000), which corresponds to the 0.00% Fibonacci level (17,973.8) drawn from the recent swing high (~19,117.4).
This support zone aligns with the concept of hitting the daily lows/liquidity area.
Anticipated Scenario:
I am expecting a reaction (a bounce/pullback) from this current zone. The projected path suggests a retracement towards the 50% Fibonacci level (Equilibrium) at approximately 18,547.3. This level often acts as significant resistance after a strong impulse move. The 61.8% level (~18,682.6) is also a key area to watch just above it.
Point of Interest (POI):
The zone between the 50% and 61.8% Fib levels (roughly 18,550 - 18,700) is your key decision area for a potential short entry. 👍
3. 15-Minute Timeframe (M15):
Entry Confirmation Trigger 🔫
The M15 timeframe will be crucial if price reaches your H4 POI (around the 50% Fib level).
What to Look For: During the potential pullback towards ~18,550, the M15 will likely show a temporary bullish structure (higher highs and higher lows).
Confirmation Signal:
For your short setup, you'd want to see this M15 bullish structure fail upon reaching the H4 resistance zone. Look for:
A break of market structure (BOS) to the downside on M15 (price making a lower low after failing to make a higher high).
Formation of clear M15 lower highs and lower lows.
Bearish candlestick patterns (e.g., engulfing candles, pin bars/shooting stars) rejecting the H4 resistance/Fib level.
Potential divergence on indicators like RSI or MACD (though price action is primary).
Synthesized Outlook & Strategy:
The NAS100 is undeniably in a bearish phase across multiple timeframes. The current test of daily lows / H4 support (~17,973) is a critical juncture. A bounce from here seems plausible, aligning with your expectation of a pullback.
The Strategy:
Patience: Wait for price to potentially rally towards the H4 50%-61.8% Fibonacci retracement zone (~18,547 - ~18,682). 🧘♀️
Confirmation:
Monitor the M15 timeframe closely as price approaches this zone. Look for a clear shift in market structure from bullish (pullback) to bearish (resumption of trend). 📉
Entry: If bearish confirmation occurs (M15 BOS), consider a short entry.
Targets:
Initial targets could be the recent lows (~17,973), followed by the Fibonacci extension levels shown on your chart (e.g., -50% at ~17,400.4) or the area below the daily equal lows. 🎯
Risk Management: Crucially, define your stop-loss level (e.g., above the swing high formed during the M15 structure break or above the 61.8%/78.6% Fib level) to manage risk effectively. 🛡️
Fundamental Check:
cross-reference this technical setup with any major news releases or shifts in market sentiment that could invalidate the pattern. 📰

US100 Will Grow !
HI,Traders !
US100 is trading in an
Uptrend and the price is
Now consolidating above
The horizontal support
Of 18178.2 and as we are
Bullish biased we will be
Expecting a further bullish
Move up !
Comment and subscribe to help us grow !

Trade the Structure: NAS100 Possible Retrace & Buy OpportunityThe NAS 100 recently broke its market structure after a twist in trade policy—with Donald Trump delaying tariffs by 90 days—which sparked a robust rally. On the 4‑hour chart, we're looking for a bullish setup where the initial surge might be followed by a pullback into a sideways accumulation zone. This consolidation is expected to form a "spring" pattern—a brief retest that could trap sellers—followed by a clear break of market structure that signals a renewed upward move. The entry is ideally on the breakout, backed by supportive volume, while risk management is maintained with a stop-loss positioned just below the range if/when price retraces into support. 🚀📈💰

"US500/SPX500" Indices Market Heist Plan (Scalping / Day Trade)🌟Hi! Hola! Ola! Bonjour! Hallo! Marhaba!🌟
Dear Money Makers & Robbers, 🤑 💰💸✈️
Based on 🔥Thief Trading style technical and fundamental analysis🔥, here is our master plan to heist the "US500/SPX500" Indices Market. Please adhere to the strategy I've outlined in the chart, which emphasizes long entry. Our aim is the high-risk Red Zone. Risky level, overbought market, consolidation, trend reversal, trap at the level where traders and bearish robbers are stronger. 🏆💸"Take profit and treat yourself, traders. You deserve it!💪🏆🎉
Entry 📈 : "The heist is on! Wait for the MA breakout (5780) then make your move - Bullish profits await!"
however I advise to Place Buy stop orders above the Moving average (or) Place buy limit orders within a 15 or 30 minute timeframe most recent or swing, low or high level.
📌I strongly advise you to set an alert on your chart so you can see when the breakout entry occurs.
Stop Loss 🛑:
Thief SL placed at the recent/swing low level Using the 30m timeframe (5700) Day trade basis.
SL is based on your risk of the trade, lot size and how many multiple orders you have to take.
🏴☠️Target 🎯: 5860 (or) Escape Before the Target
🧲Scalpers, take note 👀 : only scalp on the Long side. If you have a lot of money, you can go straight away; if not, you can join swing traders and carry out the robbery plan. Use trailing SL to safeguard your money 💰.
"US500/SPX500" Indices Market Heist Plan (Scalping / Day Trade) is currently experiencing a bullishness,., driven by several key factors.
📰🗞️Get & Read the Fundamental, Macro, COT Report, Geopolitical and News Analysis, Sentimental Outlook, Intermarket Analysis, Index-Specific Analysis, Positioning and future trend targets.. go ahead to check 👉👉👉
⚠️Trading Alert : News Releases and Position Management 📰 🗞️ 🚫🚏
As a reminder, news releases can have a significant impact on market prices and volatility. To minimize potential losses and protect your running positions,
we recommend the following:
Avoid taking new trades during news releases
Use trailing stop-loss orders to protect your running positions and lock in profits
💖Supporting our robbery plan 💥Hit the Boost Button💥 will enable us to effortlessly make and steal money 💰💵. Boost the strength of our robbery team. Every day in this market make money with ease by using the Thief Trading Style.🏆💪🤝❤️🎉🚀
I'll see you soon with another heist plan, so stay tuned 🤑🐱👤🤗🤩

Nasdaq market analysis: 04-APRIL-2025Good morning. Welcome to today's Nasdaq market analysis and educational insights for price action traders.

NASDAQ INDEX (US100): Great Opportunity to Sell
NASDAQ Index formed a strong bearish pattern after a test of a key daily
resistance area.
I see a head & shoulders pattern on an hourly time frame
and a confirmed breakout of its horizontal neckline.
The index can continue decreasing.
Next support - 19240
❤️Please, support my work with like, thank you!❤️

NAS100: Likely rebound at major point within Ascending ChannelCAPITALCOM:US100 is likely to be undergoing a corrective move as it tests the lower boundary of the ascending channel, as shown on my chart. This boundary serves as dynamic trendline support and a significant bullish reaction could happen if buyers step in at this level.
A successful rebound from this support could lead to a move toward the midline of the channel, with the next target at around 22,000 . This scenario would maintain the overall bullish trend structure.
However, a clear breakdown below the trendline support would weaken the bullish outlook and could lead to further downside.
Monitoring candlestick patterns and volume at this critical zone is essential for identifying buying opportunities. Proper risk management is advised, always confirm your setups and trade with solid risk management.
If you have any thoughts on this setup or additional insights, drop them in the comments!

"NAS100/US100" Indices Market Heist Plan (Scalping / Day Trade)🌟Hi! Hola! Ola! Bonjour! Hallo! Marhaba!🌟
Dear Money Makers & Robbers, 🤑 💰💸✈️
Based on 🔥Thief Trading style technical and fundamental analysis🔥, here is our master plan to heist the "NAS100/US100" Indices Market. Please adhere to the strategy I've outlined in the chart, which emphasizes long entry. Our aim is the high-risk Red Zone. Risky level, overbought market, consolidation, trend reversal, trap at the level where traders and bearish robbers are stronger. 🏆💸"Take profit and treat yourself, traders. You deserve it!💪🏆🎉
Entry 📈 : "The vault is wide open! Swipe the Bullish loot at any price - the heist is on!
however I advise to Place buy limit orders within a 15 or 30 minute timeframe most recent or swing, low or high level. I Highly recommended you to put alert in your chart.
Stop Loss 🛑:
Thief SL placed at the recent/swing low level Using the 30m timeframe (19700) swing trade basis.
SL is based on your risk of the trade, lot size and how many multiple orders you have to take.
🏴☠️Target 🎯: 20350 (or) Escape Before the Target
🧲Scalpers, take note 👀 : only scalp on the Long side. If you have a lot of money, you can go straight away; if not, you can join swing traders and carry out the robbery plan. Use trailing SL to safeguard your money 💰.
"NAS100/US100" Indices Market Heist Plan (Scalping / Day Trade) is currently experiencing a bullishness,., driven by several key factors.
📰🗞️Get & Read the Fundamental, Macro, COT Report, Geopolitical and News Analysis, Sentimental Outlook, Intermarket Analysis, Index-Specific Analysis, Positioning and future trend targets.. go ahead to check 👉👉👉
📌Keep in mind that these factors can change rapidly, and it's essential to stay up-to-date with market developments and adjust your analysis accordingly.
⚠️Trading Alert : News Releases and Position Management 📰 🗞️ 🚫🚏
As a reminder, news releases can have a significant impact on market prices and volatility. To minimize potential losses and protect your running positions,
we recommend the following:
Avoid taking new trades during news releases
Use trailing stop-loss orders to protect your running positions and lock in profits
💖Supporting our robbery plan 💥Hit the Boost Button💥 will enable us to effortlessly make and steal money 💰💵. Boost the strength of our robbery team. Every day in this market make money with ease by using the Thief Trading Style.🏆💪🤝❤️🎉🚀
I'll see you soon with another heist plan, so stay tuned 🤑🐱👤🤗🤩

US100 - at support? Hold or not??#US100 - well guys market just near to his current supporting region.
That is around 19230 to 10330
Keep close that region because if market hold it in that case we can expect a bounce from here.
Good luck
Trade wisely

Bearish Alert: Nasdaq’s Downtrend May Deepen Beyond 5%Hey Realistic Traders, Will CAPITALCOM:US100 Bearish Trend Stop? Let’s Dive In....
On the H4 timeframe, Nasdaq continues to follow the bearish trendline and the EMA-200 . Both trend analysis tools clearly signal a bearish trend. The downtrend may persist as a rising wedge pattern has formed, followed by a breakout and a MACD crossover.
Based on these technical signals, I anticipate a potential downward movement toward the first target at 19,077. After reaching this level, a minor pullback is likely before the decline continues toward a new low at 18,544.
This outlook remains valid as long as the price move below the stop-loss level at 20,080
Besides technical factors, U.S. President Donald Trump still intends to implement new reciprocal tariff rates on April 2, adding further uncertainty to the market. This could limit growth potential and contribute to an inflationary environment by increasing the cost of imported goods. Given this uncertainty, we believe the market will continue to decline.
Support the channel by engaging with the content, using the rocket button, and sharing your opinions in the comments below.
Disclaimer: "Please note that this analysis is solely for educational purposes and should not be considered a recommendation to take a long or short position on Nasdaq.

US100 Short From Resistance!
HI,Traders !
US100 has retested a
A horizontal resistance
Of 20669.2 from where
A bearish reaction can be
Observed already and so
We will be expecting a
Further bearish correction !
Comment and subscribe to help us grow !

Short-Term Opportunity in NAS100: Rebound in Play?Since reaching its all-time high (ATH) three weeks ago, NAS100 has dropped approximately 3,000 pips, hitting a low near the 19,000 zone yesterday.
Currently, the CFD price is rebounding, and this recovery could extend into the New York trading session.
Although my overall correction target remains around 18,000, I anticipate a short-term relief rally at this stage.
From a short-term trading perspective, the 19,000 level could present a good entry opportunity. With a tight stop and a target slightly above 20,000, this setup offers a favorable risk-reward ratio.

NAS100 Analysis: Key Levels & Bearish Trade Setup📊 NAS100 Analysis and Trade Idea | Key Levels & Bearish Bias Explained 📉
Dive into a detailed analysis of the NAS100 (NZ 100) with a focus on key support zones, retracement levels, and a bearish trading bias. Learn how to identify overextended price movements, imbalances, and potential short setups using the daily and 4-hour timeframes. Perfect for traders looking to refine their strategies in indices trading! 💡 💬 Share your thoughts and trading ideas in the comments below!

NASDAQ Bullish Breakout!HI,Traders !
NASDAQ is trading in a
Local uptrend and
Made a bullish breakout of
The key horizontal level
Of 22062.4 and the breakout
Is confirmed so we will
Be expecting a further
Bullish continuation !
Comment and subscribe to help us grow !

Is the NAS100 Setting Up for a Reversal? Here’s My Game Plan!👀 👉 In this video, we break down the US100, which appears overextended after pushing into a key weekly high. A significant retracement could be on the horizon this week. I’ll walk you through my trading strategy, covering breakout trades and trend continuation setups. 🚨 *Not financial advice.

NASDAQ 100 Hits Key Resistance: Is a Retracement Imminent?In this video, I analyze the NASDAQ 100 (#NAS100) as it trades into a key resistance level, appearing overextended on the 4-hour timeframe. I discuss the potential for a counter-trend trade, targeting a retracement to the 50% Fibonacci level of the previous price swing. Watch for insights and strategies on navigating this setup! Not financial advice.

Nasdaq market analysisGood morning Dear Traders! Join me for the last Nasdaq market analysis for the week. Share your charts, ask questions, and let's discuss trading strategies.

US100 Local Short!
HI,Traders !
US100 keeps growing
But the will soon
Retest a horizontal
Resistance level of 21668.9
From where a local bearish
Correction is likely to follow !
Comment and subscribe to help us grow !

"US100 / US Tech / NASDAQ" Index Market Heist Plan🌟Hi! Hola! Ola! Bonjour! Hallo!🌟
Dear Money Makers & Robbers, 🤑 💰
Based on 🔥Thief Trading style technical and fundamental analysis🔥, here is our master plan to heist the "US100 / US Tech / NASDAQ" Index Metal market. Please adhere to the strategy I've outlined in the chart, which emphasizes long entry. Our aim is the high-risk Red Zone. Risky level, overbought market, consolidation, trend reversal, trap at the level where traders and bearish robbers are stronger. Be wealthy and safe trade.💪🏆🎉
Entry 📈 :Traders & Thieves with New Entry A bull trade can be initiated on the MA level breakout of 21,300.00
Stop Loss 🛑: Using the 3H period, the recent / nearest low or high level.
Goal 🎯: 22,400.00 (or) Escape Before the Target
Scalpers, take note 👀 : only scalp on the Long side. If you have a lot of money, you can go straight away; if not, you can join swing traders and carry out the robbery plan. Use trailing SL to safeguard your money 💰.
📰🗞️Fundamental, Macro, Sentimental Outlook:
The (US100 / US Tech / NASDAQ) market is expected to move in a bullish direction, driven by several key factors.
🟡Macroeconomic Factors:
Interest Rates: The Federal Reserve's dovish stance on interest rates is expected to support the US stock market.
Economic Growth: The US economy is expected to continue growing, albeit at a slower pace, supporting the stock market.
Inflation: Low inflation levels are expected to support the stock market, as they allow for accommodative monetary policy.
🟢Fundamental Factors:
Earnings Growth: Strong earnings growth from major tech companies, such as Apple and Microsoft, is expected to support the NASDAQ100.
Valuations: The NASDAQ100 is trading at a relatively high valuation, but strong earnings growth and low interest rates are expected to support the index.
Sector Rotation: The rotation into growth sectors, such as tech and healthcare, is expected to support the NASDAQ100.
🔵Trader/Market Sentimental Analysis:
Trader Sentiment: The CoT report shows that speculative traders are net long the NASDAQ100, indicating a bullish sentiment.
Market Sentiment: The market sentiment is bullish, with many analysts expecting the NASDAQ100 to continue its uptrend.
Technical Analysis: The technical analysis shows that the NASDAQ100 is in an uptrend, with a bullish breakout above the 13,000 level.
🟣Sentimental Outlook:
Bullish Sentiment: 65%
Bearish Sentiment: 20%
Neutral Sentiment: 15%
🟤Trader and Market Sentiment:
- 55% of institutional traders are long on the NASDAQ 100 index, indicating a bullish sentiment.
- Retail traders are also optimistic, with 60% of traders holding a long position on the index.
⚠️Trading Alert : News Releases and Position Management 📰 🗞️ 🚫🚏
As a reminder, news releases can have a significant impact on market prices and volatility. To minimize potential losses and protect your running positions,
we recommend the following:
Avoid taking new trades during news releases
Use trailing stop-loss orders to protect your running positions and lock in profits
📌Please note that this is a general analysis and not personalized investment advice. It's essential to consider your own risk tolerance and market analysis before making any investment decisions.
📌Keep in mind that these factors can change rapidly, and it's essential to stay up-to-date with market developments and adjust your analysis accordingly.
💖Supporting our robbery plan will enable us to effortlessly make and steal money 💰💵 Tell your friends, Colleagues and family to follow, like, and share. Boost the strength of our robbery team. Every day in this market make money with ease by using the Thief Trading Style.🏆💪🤝❤️🎉🚀
I'll see you soon with another heist plan, so stay tuned 🫂

Bearish Shift in NAS100: What’s Next for the US100 Trend?👀 👉 In this video, we take an in-depth look at the NAS100, analyzing its trend, market structure, price action, key support and resistance zones, and how liquidity is influencing the market. Currently, the US100 is approaching an important support level following a bearish market structure shift. We discuss possible strategies if the trend continues. All the details are covered here. Please note, this is not financial advice.

us100 day trade signalHello everyone i want to share my day trade signal at us 100
open short position at 21775
Stop loss 21800
Take profit 21700
Always manage your risk!!!
