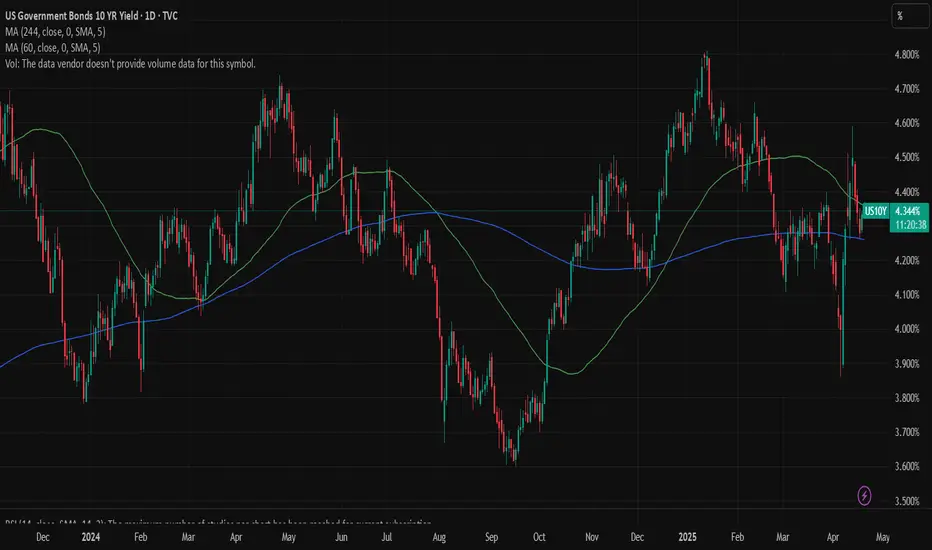
Bond Yields moving soonSo, we redrew the trendlines a few days ago and this is where the 10Yr currently stands.
Bond Yields should give some sort of direction within the next handful of days. Be ready.
TVC:TNX
Interest Rates
US10Y

US 10Y TREASURY: rollercoaster, againMarket movements in a previous period are clearly showing how high uncertainty is currently among market participants. The US Treasuries for one more time took the downtrend during the previous week, clearly testing the 4,2% level with 10Y US benchmark, but Fridays better than expected jobs report, was a trigger for a move back toward the higher grounds. The lowest weekly level of 10Y yields was 4,13% on Thursday, however, the rest of the trading week the market was looking at the upside. The strong move up, brought the 10Y yields toward the level of 4,30% where yields have closed the trading week.
The volatility might continue also during the week ahead. The FOMC meeting is scheduled for May 6-7th, while on Wednesday will be the interest rate decision day, and also Fed Chair Powell's address to the public. As per current market expectations, as posted by the CME Group FedWatch Tool, the Fed could leave interest rates unchanged at this meeting, considering stronger than expected jobs data posted during this week. In addition, the market is expecting that the Fed will not change interest rates until their meeting in July. At the same time, analysts are noting that it is too early to see the reflection of trade tariffs in real economy, concretely in jobs data, in which sense, they are taking precaution with current strong jobs data. In this sense, the Fed Chair Powell's speech, after the FOMC meeting will be closely watched by markets, for a standing of Fed on the current state of the US economy as well as their view on tariffs repercussions in the future period.

10 Yr Bond Yield breaks downtrend & then falls back into it!10 Yr Bond yields seem to have topped after that massive 1 week run. That was an impressive run! TVC:TNX
Even though the downtrend was broken, the 10Yr Yield put in a LOWER high.
We can also see that the recent uptrend was violated, back in a down trend.
Short term interest rates look worse!

Bull in a China Shop. The S&P 500 Index After 100 Days of TrumpPresident Donald Trump's first 100 days in office were the worst for the stock market in any postwar four-year U.S. presidential cycle since the 1970s.
The S&P 500's 7.9% drop from Trump's inauguration on Jan. 20 to the close on April 25 is the second-worst first 100 days since President Richard Nixon's second term.
Nixon, after taking office as President of the United States (for the second time) on January 20, 1973, witnessed the S&P 500 index fall by 9.9% in his first 100 days in office, due to the unsuccessful economic measures he took to combat inflation, which led to the recession of 1973-1975 when the S&P 500 index losses of nearly to 50 percent.
It all started in January 1973 in the best soap opera traditions of Wall Street, at the historical peaks of the S&P 500 index..
..But less than two years later it quickly grew into a Western with a good dose of Horror, because the scenario of a 2-fold reduction of the S&P 500 index was unheard those times for financial tycoons and ordinary onlookers on the street, since the Great Depression of the 1930s, that is, for the entire post-war time span since World War II ended, or almost for forty years.
Nixon later resigned in 1974 amid the Watergate scandal.
On average, the S&P 500 rises 2.1% in the first 100 days of any president's term, according to CFRA, based on data from election years 1944 through 2020.
The severity of the stock market slide early in Trump's presidency stands in stark contrast to the initial "The Future is Bright as Never" euphoria following his election victory in November, when the S&P 500 jumped to all-time highs on the belief that Mr. Trump would shake off the clouds, end the war in Ukraine overnight, and deliver long-awaited tax cuts and deregulation.
Growth slowed and then, alas, plummeted as Trump used his first days in office to push other campaign promises that investors took less seriously, notably an aggressive approach to trade that many fear will fuel inflation and push the U.S. into recession.
The S&P 500 fell sharply in April, losing 10% in just two days and briefly entering a bear market after Trump announced “reciprocal” tariffs, amid a national emergency that gave him free rein to push through tariffs without congressional oversight.
Then Trump began yanking the tariff switch back and forth, reversing part of that tariff decision and giving countries a 90-day window to renegotiate, calming some investor fears.
Many fear more downside is ahead.
Everyone is looking for a bottom. But it could just be a bear market rally, a short-term bounce of sorts.
And it's not certain that we're out of the woods yet, given the lack of clarity and ongoing uncertainty in Washington.
Time will tell only...
--
Best 'China shop' wishes,
@PandorraResearch Team

US 10Y TREASURY: NFP and jobs data ahead There has been another pullback in the 10Y US Treasury yields during the previous week. It comes as a result of investors' anticipation that the trade war between the US and China might soon be finalized. However, this sentiment is again based on mixed signals coming from the US Administration during the previous week. What will be the final result, no one actually knows, not even the US Administration, as per some analysts. The US President is still putting pressures on Fed Chair Powell to lower interest rates, which he noted on several occasions in interviews.
Anyway, the data show that the 10Y US yields started the previous week around 4,42% and dropped during the rest of the week to the Fridays level of 4,25%. Certainly, as long as the US Administration is using the push-and-pull strategy regarding trade tariffs, the market volatility will continue. And it is not only the US Treasury bond market, but also prices of equities and gold. As per technical analysis, the 4,2% level is the supporting level for the 10Y yields, which will be tested again in the week ahead. Still, it should be considered that the US NFP and jobs data will be released, where Friday is again day to closely watch, as it might bring for one more time a surprisingly volatile trading day.

The relationship between gold, copper and the US10YFirst, can you tell me what you think the relationship between these two curves is? Clearly, these two curves have a strong negative correlation, meaning they move exactly opposite to each other. You can see in the image that their behavior is like a mirror image (from 2007 to before 2022).
You are familiar with the gold-to-copper ratio, right? Now, when this gold-to-copper ratio curve rises, it means that gold is giving better returns compared to copper. This indicates that the global economy is moving away from growth and heading toward a recession. Investors, instead of investing in production (where copper symbolizes production), choose to invest in a safe haven like gold. The opposite happens when this curve goes down.
The lower curve represents the yield on long-term U.S. bonds. When this curve is rising, it means that the supply of bonds is greater than the demand. People are selling bonds, which causes the bond yield to rise. When the curve is falling, it means people are buying bonds, which causes the bond yield to drop.
Why do these two curves move in opposite directions?
Now, let’s get to the main question. The answer to this question is simple: bonds, like gold, serve as a safe haven for investors. When the economy moves toward a recession (when gold offers better returns than copper, and the gold-to-copper ratio is rising), some investors shift towards bonds, and the yield curve drops. That’s why these two curves move in opposite directions.
To summarize the entire story: Movement toward recession = investors moving toward gold and bonds = rise in the gold-to-copper ratio and drop in bond yield curve.
Now it’s clear why these two curves move opposite to each other. The big surprise is coming👇
Since the beginning of 2022, the historical trend has changed. These two curves have started to show a positive correlation! Meaning, everything I mentioned above has gone out the window! Now, the question is: What suddenly happened? There are several analyses, but I believe what changed is that U.S. bonds are no longer a safe haven for investors, as they once were (the same fear signal I mentioned earlier). In fact, after the pandemic, the world has never been the same. This is an important development and it affects many things. I’ve addressed this topic from various perspectives before, and here’s a new angle on it.
For the past two to three years, contrary to the historical trend, investors have been buying gold but selling bonds, and these two curves have been rising together.
As you can see, the analytical situation has changed drastically compared to, say, 10 years ago, and many fundamental facts have shifted. For instance, many people expect the Federal Reserve to lower interest rates and gold to go up again, but after an initial short shock, the story will probably reverse.
#Gold #XAUUSD #HG1!

S&P 500 - Key Levels and Measurements (Bonds vs Yields vs Homes)Happy Friday!!!
Starting with a BLANK chart, here are my key levels and measurements for the S&P 500
Earnings season is stable, more MAG 7 next week with AAPL, AMZN, META, MSFT
Trump and Company are softening the trade war narrative quickly and the market
is taking notice. Prices recovered nicely this week
5500 SPX is a key level for the bulls to push above - if done look for open space
melt-up into 5700-5800 resistance
If SPX rejects 5500 early next week we will be dealing with some more noise
and intermediate levels
4830 lows will be absolutely critical to maintaining a long-term bull market. You will
see why with this analysis.
Last piece is talking about bonds vs yields and the current housing market in the US
My belief is that yields stay sticky and home prices MUST drop to see any improvements
in affordability
Thanks for watching - have a great weekend!!!

XAUUSD - Will Gold Reverse?!Gold is trading between the EMA200 and EMA50 on the 15-minute timeframe and is on its uptrend line. A continued bullish move towards the supply zone will provide us with the next opportunity to sell it with a good risk-reward ratio. We expect a range of $10-$15.
Gold prices dropped by 4% on Wednesday, just a day after reaching an all-time high. The decline followed remarks by President Trump that helped ease Wall Street’s concerns about the ongoing trade war with China and tensions between the White House and the Federal Reserve.
Throughout this year, gold has seen a substantial rise due to investor fears over the economic consequences of tariffs. Additionally, the metal has benefited from capital fleeing U.S. assets amid political uncertainty under the Trump administration. On Tuesday, Trump reassured markets by stating that he had no intention of removing Jerome Powell as Fed Chair and expressed his expectation that tariffs on Chinese goods would soon be lowered.
Trump’s statements supporting Federal Reserve independence and hinting at easing trade tensions with China reignited risk appetite in financial markets, causing gold prices to tumble on Wednesday.Just a day earlier, prices had hit a record high above $3,500, as investors speculated that Trump might attempt to remove Powell. Trump had previously criticized Powell for not cutting interest rates and for warning that tariffs could lead to higher consumer prices.
Gold’s price surge this year has been especially notable following Trump’s decision to halt the implementation of sweeping new tariffs initially announced in early April. Gold, as a safe-haven asset not tied to any single national economy—unlike traditional alternatives such as the U.S. dollar or Treasuries, which are subject to U.S. government influence—has become increasingly attractive to investors wary of Trump’s policy decisions.
Meanwhile, the International Monetary Fund (IMF) has warned that continued tariff escalation in 2025 could push global public debt to 95.1% of GDP—an increase of 2.8 percentage points from previous forecasts. According to the IMF’s latest “Fiscal Monitor” report, if revenues and output fall significantly below expectations due to tariff-induced pressures, global debt could surpass 117% of GDP by 2027.
Investment bank JPMorgan has projected that gold prices could exceed $4,000 per ounce by mid-2026. This forecast is based on expectations of an economic recession, a prolonged trade war, and sustained demand from central banks. However, JPMorgan also cautioned that a sudden drop in central bank demand could threaten this bullish trend.
The IMF’s report further estimates that global public debt will climb to 99.6% of GDP by 2030, exceeding even the pandemic-era peak.
The IMF has forecasted global economic growth at around 2.8% for 2025. In this scenario, the U.S. budget deficit is projected to decrease from 7.3% of GDP in 2024 to 6.5% in 2025, and further down to 5.5% in 2026, largely due to increased tariff revenues and continued economic expansion.
These IMF projections for the U.S. deficit are based on policies announced up until April 2, 2025, and assume that the individual tax cuts enacted in 2017 will expire at the end of this year.

US 10Y TREASURY: just a short correctionTariffs continue to be the major market concern, considering its potential impact on inflation, and at the last distance - the decision of the Fed to cut interest rates during the course of this year. The US Administration continues to urge the Fed to cut interest rates, noting that this is the right moment for such a move, while Fed Chair Powell refuses to comment. However, during the previous week, Powell publicly noted that the US economy might be hurt with tariffs in terms of higher inflation. This was not something that the markets were happy to hear, as it meant the possibility of even no rate cuts during the course of this year. The US Treasury yields reacted to this comment from Powell, bringing back volatility to the bond market.
The 10Y US Treasury benchmark started the week around 4,48%, and was traded toward the downside during the course of the week. The lowest weekly level was achieved on Wednesday, at 4,27%, but the reversal came on Thursday, when yields reverted back toward the 4,33%. Analysts are still cautious to bring their revised forecast for the US economy. Firstly, because the tariffs are so uncertain, and change almost on a daily basis, where it is extremely hard to bring into the light forecast of their impact on the US economy. However, as long as the US Administration uses tariffs narrative, the volatility on the market will continue.
US 10Y TREASURY: to be or not to be – recessionMarket uncertainty continues to be supported with tariffs-narrative induced by US Administration and other world governments. The tariffs-war intensified between the US and China, bringing them to the level of absurdity. The fear of stagflation is for one more time active on financial markets. The 10Y Treasury yields ended one more week at higher grounds. They started the week around 3,87% and ended it at 4,49%. The highest weekly level was reached on Friday, at the level of 4,58%. As analysts involved in a matter noted, the highest sellers of US Treasuries were China and Japan.
The tariffs-war is currently disrupting the market. This sentiment does not have anything to do with current macro data and anticipation on future monetary policy. It has to do with a perception of investors regarding future effects of currently imposed tariffs, which are changeable on a daily basis. The sentiment is the one that is supporting extreme volatilities, as markets face it for the last few weeks now. In the future period, this will all settle down, and the market will find its equilibrium level. It is just a game of nerves at this moment.

The 10 Year: When Should We Worry?All over the media eyes are on yields but what exactly do the different potential rates of the 10-year yield mean in terms of debt servicing for the United States? I made this chart to visualize the danger points.
I am not saying I think we will get there I just wanted to know myself and help others to understand what each pain point can mean to the United States economy.

US10Y This break-out will be massive.The U.S. Government Bonds 10YR Yield (US10Y) is trading within a 2-year Triangle pattern and following this week's trade events, got back on its 1W MA50 (blue trend-line). A potential break-out either way from this long-term pattern will be massive.
We do believe though that there are higher probabilities for a bearish break-out as the 1W MA50 is about to cross below the 1W MA100 and form the first 1W MA50/100 Bearish Cross since July 22 2019. Interestingly enough, that was following the last Trade War between the U.S. and China.
At the same time, the 1W RSI has been within a Channel Down since late 2022, indicating a huge Bearish Divergence.
-------------------------------------------------------------------------------
** Please LIKE 👍, FOLLOW ✅, SHARE 🙌 and COMMENT ✍ if you enjoy this idea! Also share your ideas and charts in the comments section below! This is best way to keep it relevant, support us, keep the content here free and allow the idea to reach as many people as possible. **
-------------------------------------------------------------------------------
💸💸💸💸💸💸
👇 👇 👇 👇 👇 👇

Dollar Index Bullish to $111.350 (UPDATE)Dollar buyers are still holding up nicely. Sellers tried to push price down today but buyers stepped back in again.
We're currently seeing a bullish accumulation take place around 'Major Wave X' support zone.

Possible Battle Between USDJPY Bulls and Bears at TrendlineUSDJPY is currently testing its weekly trendline, but recent data from Japan may challenge the possibility of a downward break.
Market turmoil has increased demand for long-term U.S. bonds, and the resulting drop in the TVC:US10Y has kept the TVC:DXY under pressure, conditions that have supported Yen bulls. However, the latest wage data out of Japan may shift the short-term outlook just as the trendline is being tested.
Base full-time wage growth dropped to 1.9% year-over-year, down from 3%. This slowdown may give the Bank of Japan more justification to hold rates steady at its next meeting. If tariff-related panic subsides with any calming news from the White House, USDJPY could see renewed upside potential.
In the short term, two resistance levels are crucial: 146.50 and 147.50. The battle between bulls and bears is likely to play out between these resistance levels and the weekly trendline near 145.

Dollar Index Bullish to $111.350 (UPDATE)Since yesterday's Dollar update, price has moved according to our arrow. We saw a small dip down overnight & now buyers have once again pushed price back into the grey zone.
We are expecting price to remain within this grey zone, seeing it flip from a resistance zone into support. Once price closes above this zone, we'll have extra confirmation that Dollar buyers are ready to push price even higher🚀

WHY EVERYTHING IS GOING DOWN? ANSWER IS HERE!Understanding the Simultaneous Decline in EVERYTHING!
1. The Influence of U.S. Treasury Yields and Interest Rates
The U.S. 10-year Treasury bond yield is a major benchmark in global finance. When yields rise, it signifies that bonds are becoming more attractive relative to riskier assets. Rising yields typically occur when:
Investor Demand Shifts: Investors move from risky assets (like equities or crypto) to safer, higher-yielding government bonds.
Inflation Expectations: Higher inflation expectations often lead investors to demand higher yields, which in turn increases borrowing costs.
Cause and Effect:
When Treasury yields increase, the opportunity cost of holding lower-yielding assets rises. This makes stocks, precious metals like gold, and speculative assets like cryptocurrencies less attractive. Even gold, typically seen as a safe haven, can lose its charm if fixed-income assets provide competitive returns with significantly lower risk.
2. M2 Money Supply Dynamics
The M2 money supply measures the total liquidity available in the economy, including cash, checking deposits, and easily convertible near-money assets. Changes in M2 can impact asset prices in several ways:
Expanding M2: More liquidity in the market initially can boost asset prices. However, if this expansion leads to rising inflation, it may eventually trigger higher interest rates and bond yields.
Contraction or Slowing Growth in M2: A tightening in liquidity can reduce the flow of money into various asset classes. This dampens overall market sentiment and makes riskier assets less attractive.
Cause and Effect:
If M2 growth slows or contracts, there is less capital to chase after higher returns in equities and crypto. At the same time, if there is an expectation of tightening monetary policy, investors recalibrate risk expectations, which leads to a broader sell-off across multiple asset classes.
3. Investor Sentiment and Risk-Off Behavior
In periods where both Treasury yields are rising and the money supply signals less liquidity, the overall investor sentiment often shifts toward a "risk-off" stance. This means:
Safe-Haven Demand: Investors move into safe assets like government bonds, which drives up bond prices and yields while pulling money out of riskier assets such as stocks, gold, and cryptocurrencies.
Correlation Effect: As riskier assets are sold off, their prices fall in tandem. Therefore, even if gold typically acts as a counterweight to stocks, in a severe risk-off environment, all asset classes might decline.
Cause and Effect:
With a risk-off sentiment dominating the market, traditional safe havens (like gold) and growth-oriented assets (stocks and crypto) can experience simultaneous declines. Rising yields encourage a rotation away from these riskier positions, which reinforces the downward trend across multiple markets.
4. Historical Context: The Trump Era and Beyond
During the Trump administration, we observed episodes where Treasury bond prices surged significantly (e.g., a 10% surge) as investors sought refuge during periods of political and economic uncertainty. Eventually, as market sentiment shifted, yields rose, and this led to higher borrowing costs. The resulting effect was a broad-based retreat in many asset classes.
Example: In those periods, as yields climbed to around 4%, investor appetite for risk diminished. The market corrected across equities, precious metals, and cryptocurrencies, with all asset classes experiencing pressure concurrently.
Cause and Effect:
In the current climate, if similar dynamics are at work—namely, rising yields accompanied by tightening M2 growth—then we might see a similar pattern: gold, the S&P 500, and crypto all experience declines together because investor risk appetite is sharply reduced.
Conclusion
The simultaneous decline in gold, the S&P 500, and cryptocurrencies can primarily be attributed to rising U.S. Treasury yields and tightening M2 money supply. As yields rise:
The relative attractiveness of low-risk government bonds improves, encouraging a shift in investment away from riskier assets.
Increased yields raise borrowing costs, which in turn dampens economic growth and investor sentiment.
Slowing liquidity (as measured by M2) further restricts the available capital chasing after higher returns.
This confluence of factors leads to a widespread "risk-off" environment where even traditional safe havens like gold may fall as the entire market adjusts to a higher interest rate and lower liquidity backdrop. Investors thus move across asset classes in a coordinated fashion, leading to declines in gold, equities, and crypto alike.
Understanding this cause-and-effect relationship is crucial for professional traders who rely on disciplined strategies. With a clear view of the broader economic signals, you can navigate these shifts with precision—helping you not only to avoid costly mistakes but also to capitalize on high-probability opportunities that emerge during these market transitions.

Dollar Index Bullish to $111.350 (UPDATE)The DXY wave analysis has been re-counted & bullish bias remains👇
⭕️3 Major Sub-Wave Correction
⭕️3 Minor Sub-Waves Within Major
⭕️Gold Bearish, Which Makes DXY Bullish

US 10Y TREASURY: the Bad, the Good and TariffsAt the first look at the 10Y US benchmark chart, one might say that it looks pretty scary as of the end of last week. However, historically, it happens. Trade tariff war has started, which triggered a massive market uncertainty and a sell-off on financial markets. Naturally, the first idea in investors' perspectives for the future period is a recession on a world's scale and in the US and this was reflected in the US yields. It started at the beginning of the week, where yields from the 4,35% took the down course for the rest of the week, ending it with the 3,86% at the Fridays trading session. However, after reaching the lowest level, the yields reverted just a bit to end the week at the level of 3,99%. The strong move was also supported by Fed Chair Powell's comment that a trade war will have a negative effect on the US economy, which cannot be estimated at this moment.
The volatility of markets might continue for another week in a row. Markets will cope with estimation of countermeasures, which are slowly announced by other countries. Based on current probabilities there are equal chances that the market will test the 4,0% level, or it might move once again down, to test levels below the 4%.

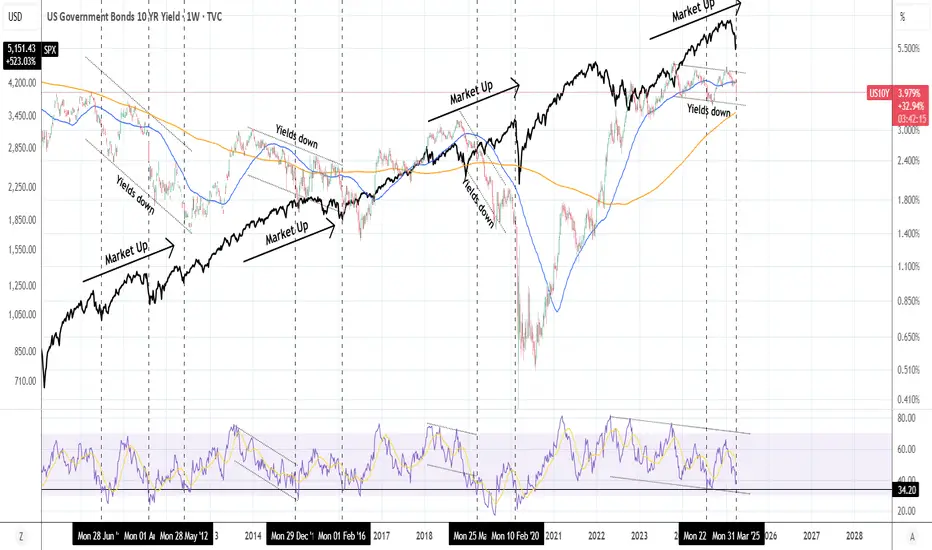
US10Y: This pattern has been extremely bullish for stocks.The U.S. Government Bonds 10 YR Yield is heavily bearish on its 1W technical outlook (RSI = 36.788, MACD = -0.034, ADX = 32.176) and that has historically been favorable for stocks. More specifically, when the Yields have been trending down inside a Channel Up since 2010, the S&P500 was on an uptrend. Going into more detail on the US10Y RSI on the 1W timeframe, it is almost on the 34.20 trendline, which is a key level as every time it hit that (see the dashed vertical lines), the S&P500 bottomed. The exception to the rule was, needless to say the COVID crash in Feb 2020. According to this, Trump's tariffs create the perfect market opportunity for a new long term buy.
## If you like our free content follow our profile to get more daily ideas. ##
## Comments and likes are greatly appreciated. ##
Trump Goes 'Cynosure' of All Eyes as He Walked Into '1930' RoomThe Striking Parallels Between Trump's 2025 Tariffs and the Smoot-Hawley Tariff Act of 1930
The recent trade policies under President Trump's second administration bear remarkable similarities to the controversial Smoot-Hawley Tariff Act of 1930, both in approach and potential consequences. These parallels offer important historical lessons about protectionist trade policies.
Protectionist Foundations and Scope
Both trade initiatives share fundamentally protectionist motivations aimed at shielding American industries from foreign competition. The Smoot-Hawley Act increased import duties by approximately 20% with the initial goal of protecting struggling U.S. farmers from European agricultural imports. Similarly, Trump's 2025 trade agenda explicitly aims at "backing the United States away from integration with the global economy and steering the country toward becoming more self-contained".
What began as targeted protections in both eras quickly expanded in scope. While Smoot-Hawley initially focused on agricultural protections, industry lobbyists soon demanded similar protections for their sectors. Trump's tariffs have followed a comparable pattern, beginning with specific sectors but rapidly expanding to affect a broad range of imports, with projected tariffs exceeding $1.4 trillion by April 2025—nearly four times the $380 billion imposed during his first administration.
Specific Tariff Examples
The parallel implementation approaches are notable:
Trump imposed a 25% global tariff on steel and aluminum products effective March 12, 2025
Trump raised tariffs on all Chinese imports to 20% on March 4, 2025
Trump imposed 25% tariffs on most Canadian and Mexican goods
Smoot-Hawley increased overall import duties by approximately 20%
Smoot-Hawley raised the average import tax on foreign goods to about 40% (following the Fordney-McCumber Act of 1922)
Global Retaliation and Economic Consequences
Perhaps the most striking similarity is the international backlash. The Smoot-Hawley tariffs triggered retaliatory measures from over 25 countries, dramatically reducing global trade and worsening the Great Depression. Trump's 2025 tariffs have already prompted counter-tariffs from major trading partners:
China responded with 15% tariffs on U.S. coal and liquefied natural gas, and 10% on oil and agricultural machines
Canada implemented 25% tariffs on approximately CA$30 billion of U.S. goods
The European Union announced tariffs on €4.5 billion of U.S. consumer goods and €18 billion of U.S. steel and agricultural products
Expert Opposition
Both policies faced significant opposition from economic experts. More than 1,000 economists urged President Hoover to veto the Smoot-Hawley Act.
Trump's 2025 tariffs? Reaction is coming yet...
Potential Economic Impact
The historical record suggests caution. The Smoot-Hawley Act is "now widely blamed for worsening the severity of the Great Depression in the U.S. and around the world". Trump's "more audacious intervention" similarly carries "potentially seismic consequences for jobs, prices, diplomatic relations and the global trading system".
These striking parallels between trade policies nearly a century apart demonstrate that economic nationalism and retaliatory trade cycles remain persistent challenges in international commerce, with historical lessons that remain relevant today.
Stock market Impact
Just watch the graph..
--
Best wishes,
Your Beloved @PandorraResearch Team 😎

GOLD - 1H UPDATE
Gold dropped nicely today, in a strong impulsive move which normally indicates a reversal. We also saw price touch $3,057, but we did say price also needs to close below that level which it never done. There's 2 possible plays on its next move;
1. Price just carries on dropping lower in the next week as expected.
2. Gold starts to consolidate, creating a 'redistribution schematic' for a bigger sell off. But this could also mean Gold creating 1 more new ATH.

Dollar Index Bullish to $111.350 (UPDATE)The DXY price action from my last video analysis has been moving as we expected & following the arrow accordingly.
We’ve seen a nice dip for the Dollar, a healthy retracement to the downside which should now be followed by the next bull run back up.
Major Wave 5 (Wave Y) en-route to $111.350📈

US 10Y TREASURY: emerging inflation? Another end of the week brought not so positive news to the markets, so some higher volatility was evident. The Michigan Consumer Sentiment came as a surprise, with increased inflation expectations from US consumers. Data showed that the sentiment for this year inflation has increased to 5,0%, while a five year sentiment is at the level of 4,1%. These figures strongly impacted US equity markets, the price of gold while the 10Y US Treasury benchmark yields dropped to the level of 4,25%, from 4,4% where they were traded on Thursday.
Friday's move was the strong one, in which sense, we could expect that the market will use the start of the week ahead to digest data. There is a high possibility that yields will revert a bit, at least to test the 4,3% level for one more time. However, it should be considered that uncertainty on markets caused by trade tariffs and inflation expectations are high at the moment, which will continue to be main drivers of market sentiment in the future period. For the week ahead, the NFP and unemployment data are set for a release, in which sense, volatility will most certainly continue.
