GOLD Bouncing Higher, Following 200-hour SMA Major Support Gold prices have experienced significant volatility over the last days, with conflicting reports on the current trend. According to some sources, gold prices have increased, with spot gold reaching nearly $3,050, new all the history high on Thursday, March 20, 2025.
The $3,000 milestone has sparked increased interest from investors and market analysts, meaning that Gold spot doubled in price over the past 5 years, 3rd time in history ever.
Despite the short-term volatility, gold has shown a strong performance since the beginning of 2025, with an increase of approximately 14-15% year-to-date. Market analysts remain bullish on gold, with some forecasting prices to reach $3,100-$3,200 per ounce in the near term.
The main 1-hour Gold spot OANDA:XAUUSD graph indicates on 200-hours SMA technical support, with further upside opportunity due to mentioned on the chart descending triangle (flat bottom/ descending top) breakthrow.
--
Best #GODL wishes,
@PandorraResearch Team
US10Y

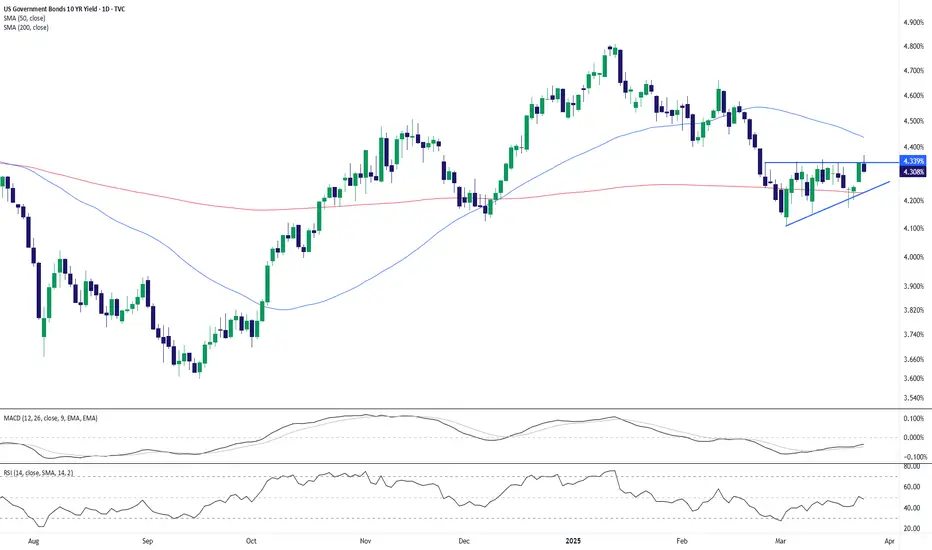
US 10yr Treasury Yields Press Against ResistanceThe U.S. 10-year Treasury yield is hovering just beneath the 4.34% resistance level, with price forming a tight ascending triangle just under this key level. Today’s pullback to 4.31% (-0.74%) suggests hesitation from bulls as momentum indicators turn mixed.
🔹 MACD is flat, showing a lack of directional conviction.
🔹 RSI sits at 47.94, neutral and non-committal.
🔹 Price remains sandwiched between the 50-day SMA (4.43%) and the 200-day SMA (4.22%).
A confirmed breakout above 4.34% could open the door for a run toward 4.50% or even 4.80%. Conversely, a drop below the rising trendline (~4.24%) would expose downside risk toward the 200-day SMA.
Watch for a catalyst (Fed commentary or inflation data) to break the deadlock.
-MW
US 10Y TREASURY: two rate cuts?The Fed held interest rates unchanged at their FOMC meeting during the previous week. On a positive side is that they still perceive two rate cuts during the course of this year, which would account for 0.5 percentage points further drop in US reference rates. Fed officials noted that there are arousing uncertainties related to moves from the US Administration which could impact the US economy to some extent. For the moment the forecast for the economic growth for this year was decreased by 0,4 pp to the level of 1,7%. Inflation expectations have turned to higher grounds than previously estimated.
During the first half of the week, the US 10Y Treasury benchmark reached the highest level at 4,33%, while it ended the week at 4,25%. At this point on charts, it doesn't look like the market gave up on testing the 4,30% levels, meaning that the market might modestly revert back toward the higher grounds. It should be noted that the PCE data are set for a release on Friday, next week, which increases probability of a higher volatility of US Treasury yields.

US 10Y TREASURY: FOMC weekThe US February inflation data were posted during the previous week, and with 0,2% for the month, was in line with market expectations. However, the negative effects of the US Administration related to tariffs were reflected in the Michigan Consumer Sentiment Index, which dropped in March below market estimate. What is concerning is that consumers are now expecting the inflation of 4,9% for the year, which is much higher from previous posts. It is obvious that the tariffs-on, tariffs-off game is hurting consumers’ expectations. In addition, the FOMC meeting is scheduled for the week ahead, on March 19th, which might bring back some volatility across US markets.
The 10Y US benchmark started the previous week around the level of 4,15% and moved to the higher grounds through the rest of the week. The highest weekly level was 4,34% at one moment, but yields ended the week at the level of 4,31%. Some volatility could be expected at the beginning of the week ahead, and before the FOMC meeting. At current charts, there is still some space for the higher grounds, up to the level of 4,40%. Still, it should also be considered that some probability for 4,20% holds.

US10Y Strong sell signal below the 1D MA50.The U.S. Government Bonds 10YR Yield (US10Y) has been trading within a Channel Down since the October 23 2023 High. In the past 2 months it has been on a downtrend, which is the technical Bearish Leg of the pattern.
The 1D MACD is on its 2nd Bullish Cross on a decline, very similar with the previous Bearish Leg of the Channel Down. We are again on the 0.5 Fibonacci level and as long as any rebound gets rejected below or on the 1D MA50 (blue trend-line), the long-term bearish pattern remains intact.
We expect a similar Bearish Leg of -24% overall to target 3.685%.
-------------------------------------------------------------------------------
** Please LIKE 👍, FOLLOW ✅, SHARE 🙌 and COMMENT ✍ if you enjoy this idea! Also share your ideas and charts in the comments section below! This is best way to keep it relevant, support us, keep the content here free and allow the idea to reach as many people as possible. **
-------------------------------------------------------------------------------
💸💸💸💸💸💸
👇 👇 👇 👇 👇 👇

Nasdaq Bank Index 2025 Edition — Let's Make Sh#t Great Again.President Donald Trump's aggressive tariff policies, we at @PandorraResearch Team characterize as a term "Tariff Bazooka", have significantly destabilized the Nasdaq Bank Index NASDAQ:BANK , reflecting broader financial sector vulnerabilities and investor anxiety.
These tariffs, including a 25% levy on imports from Canada and Mexico, a 20% duty on Chinese goods, and proposed reciprocal tariffs, — have triggered cascading multi effects on banking stocks through several paths.
Market Volatility and Investor Flight
The Nasdaq Bank Index, which tracks major U.S. financial institutions, has been disproportionately impacted by tariff-driven uncertainty:
Sharp Equity Declines. Since Trump announced reciprocal tariffs in February 2025, the Nasdaq Composite NASDAQ:IXIC dropped over 10% from its December 2024 peak, erasing $1 trillion in tech-sector value. Banking stocks, sensitive to macroeconomic shifts, mirrored this downturn as investors fled equities for safer assets.
Risk-Off Sentiment. Bonds rallied as tariffs sparked fears of stagflation—a combination of stagnant growth and rising inflation—prompting a 30-basis-point drop in 10-year Treasury yields. This flight to safety squeezed bank profitability, as narrower yield curves reduce net interest margins.
Economic Contagion Mechanisms
Interest Rate Pressures.
Tariffs have raised input costs for businesses, contributing to inflationary pressures. The Federal Reserve now faces a dilemma: tolerate higher inflation or hike rates to curb it. Either scenario harms banks. Elevated rates could suppress loan demand and increase default risks, while delayed rate cuts prolong financial tightening.
Trade Retaliation and Sectoral Risks.
Canada, Mexico, and China have retaliated with tariffs on $155 billion (Canada) and unspecified billions (China, Mexico) of U.S. goods. For banks, this raises exposure to sectors like agriculture, manufacturing, and automotive - industries heavily reliant on cross-border trade. Loan defaults could surge if protected industries fail to offset higher costs.
Global Financial System Strain.
Trump’s tariffs risk fragmenting the rules-based trading system, undermining the stability that banks depend on for international transactions. The EU and other regions may retaliate by restricting U.S. financial services, directly impacting revenue streams for Wall Street firms.
Sector-Specific Impacts
Tech-Finance Nexus. Many Nasdaq-listed banks have significant exposure to tech firms, which face disrupted supply chains due to tariffs on Chinese components. This dual pressure — higher operational costs for clients and reduced tech-sector valuations — weakens banks’ asset quality.
Consumer Credit Risks. Tariffs on everyday goods (e.g., 25% on Mexican produce, 10% on Canadian energy) could elevate household expenses, straining consumer creditworthiness and increasing delinquency rates for retail banks.
Projected Outcomes
Economists estimate Trump’s tariffs could reduce U.S. GDP growth by 1.5 percentage points in 2025, with a stagflationary shock amplifying equity sell-offs. For the Nasdaq Bank Index, this implies prolonged volatility, compressed earnings, and potential credit rating downgrades as macroeconomic headwinds intensify.
Technical challenge
The main technical graph of Nasdaq Bank Index NASDAQ:BANK indicates on further Bearish trend in development, since major supports (nearly 5-month flat bottom and 52-weeks SMA) have been recently broken.
Conclusion
In conclusion, Trump’s tariff strategy has acted as a destabilizing force for financial markets, with the Nasdaq Bank Index serving as a barometer for sector-wide risks. By exacerbating economic uncertainty, inflation, and trade fragmentation, these policies have eroded investor confidence and heightened systemic vulnerabilities in the banking sector.
--
Best 'sh#t hits the fan' wishes,
@PandorraResearch Team 😎

Gold Sell Off (1H UPDATE)As you’ve seen from the video analysis, Gold is currently creating a ‘Complex Triangle Correction’ made up of 5 Sub-Waves.
Potential Sell Zones:
⭕️Wave C High
⭕️Wave E High

Its Been A Long Time Hasn't It?I see a possible horrible set up coming. But also an incredibly easy set up for the current US Administration to revert policy at a certain level.
I start to wonder if they are actually not looking at the market like they said. Its not like you need to look at the market for more than 5 minutes a day after doing a SINGLE in depth analysis on a longer time frame.
We will se what happens.

US 10Y TREASURY: a roller coasterThe roller coaster continues to be in the heart of financial markets during the previous period. The uncertainty over the trade tariffs, mixed macro data, Fed President Powell`s notes, all contributed to the strong shift in prices of assets across financial markets during the last few weeks. Previous week the 10Y US benchmark started with a lowest level of 4,10% and then moved toward the higher grounds for the rest of the week. The highest weekly level was 4,33% reached on Thursday, while the level of 4,20 was tested on several occasions.
The US NFP data for February, with 151K was lower from market estimated 170K. At the same time, the unemployment rate jumped to 4,1%, from 4,0% posted previously. In this sense, analysts are currently calculating that the next Fed's rate cut might come in June this year. In this sense, the yields of US Treasuries were adjusted. However, the uncertainties over trade tariffs and its impact on the US economy continues to be a known-unknown, which might shape the sentiment of the market also in the future period and its roller coaster moves.

US 10Y TREASURY: uncertainty demands T-bonds Geopolitics were once again in the spotlight of market sentiment during the previous week. The uncertainty over the potential future increased tensions within the geopolitical sphere, pushed the US Treasury yields further to the lower grounds. Increased demand started with uncertainty over trade tariffs and currently is affected by politics. The funds from US equity markets fled toward the US Treasury bonds. The 10Y US benchmark yields started the week around 4,45% and ended it at 4,20%.
Looking at charts, the major support line for 10Y US yields lies around the level of 4,15%. In this sense, there is space for yields to move further toward the downside. Whether this would be the case for the week ahead is uncertain. There is also probability for yields to revert a bit toward the higher grounds, but some significant move should not be expected in the week ahead. Potential level could be the 4,3%.

Dollar Index Bullish to $111.350 (UPDATE)I’ve re-counted the waves, as analysed on the chart above.
⭕️3 Sub-Wave Correction (A,B,C) relabelled.
⭕️Main Supply Zone highlighted.
⭕️Alternative Bias Also Shown.

US 10Y TREASURY: safe-haven for uncertain growthThe US 10Y Treasury yield fell sharply during the previous week, in line with a drop on US equity markets. At the same time, the price of gold headed toward a new all time highest level, marking its sixth consecutive gaining week. Uncertainty is a word which has dominated financial markets since the establishment of the new US Administration. Spooky words like tariffs, inflation, and questionable economic growth are currently dominating investors' sentiment, in which sense, some further funds reallocations are quite possible in the coming period. After new stories regarding tariffs, and Michigan Consumer Sentiment, which showed the highest inflation expectations for the period of next five years, investors were seeking safe-haven assets, like Treasury bonds and gold, in order to sustain the value of their money.
The 10Y Treasury yields dropped during the week from the level of 4,56% down to 4,43%, where they are closing the week. For the week ahead, there is a possibility for a short term reversal to the upside, however, Friday brings new US PCE data, which is Fed's favourite inflation gauge. Depending on the data, some higher volatility is possible again.

RUSSELL 2000 failed breakout and consolidation We are back in this blog space after a couple of days holiday. The RUSSELL 2000 ETF AMEX:IWM failed at the same price point which it failed back in Nov 2021. It seems Price having a memory. It failed at the same price it failed in Nov 2021. After it failed from the top on 16th Dec 2024 it has recently retraced back to the 0.236 Fib retracement level @ 2237. It has been consolidating at that level and if it breaks down then the next support is @ 2167 .
Before the AMEX:IWM breaks out form this pattern it has to complete the wedge forming consolidating pattern. In my opinion the direction will be decided by the TVC:US10Y . As long as the TVC:US10Y stays below 4.5% the AMEX:IWM can consolidate here and then my break upwards as long as the bull market remains intact.
Direction of AMEX:IWM will be determined by TVC:US10Y

US 10Y TREASURY: lower on retail salesThe inflation in the US picked up above market expectations in January, however, the retail sales figures defined the market sentiment. As it has been posted, the retail sales in January suddenly dropped by -0,9%, which was much higher from the market estimate. Despite the higher inflation figures, the decrease in the retail sales provides some indication that the inflation will not significantly pick up in the coming period. This was the main indication for market participants, which brought the 10Y US treasuries down from the level of 4,65% down to 4,45% on Friday trading season. Still, yields ended the week at the level of 4,47%.
Regardless of inflation figures, at this moment trade tariffs of the US Administration represent an unknown factor for market participants. As markets are not happy with uncertainty, any news of tariffs in the coming period might trigger higher market volatility. As per current sentiment, yields have space for further easing, at least till the 4,2% level. However, fundamentals still represent the unknown factor which could temporarily revert yields to the higher grounds.

Ready for 6.5% on the 10Y T-Bill?It’s been a while since I’ve posted an Idea, however since the market may be at a pivotal point I thought I’d do a quick analysis on the $US10Y. Using elliott wave and fibonacci ratios as my base logic, I predict that we could see a 6.5% or higher 10 year T-bill in the near future.
The fib extension above is based off 1.00 of Primary waves 0-3. I’m counting that we are in the early stages of the 5th and final wave, which is commonly 61.8% of waves 0-3 in length.
My wave count is supported by the DMI indicator and the 50sma (Blue) & 100sma (yellow). The yield is still above the moving averages, signaling a continuation to the upside. Primary wave 4 was a zig zag (A-B-C) pattern in a slightly descending channel, which has a tendency to break to the upside. With inflation proving stubborn and a looming trade war providing a backdrop that is concerning to investors, it is time we get back into the mindset that the inflation battle isn’t quite over yet. Yields are rising across the world and the US is no exception.


US 10Y TREASURY: higher on inflation expectationsThe major data release during the previous week was the US jobs report. The on-farm payrolls were lower from market expectations, at the level of 143K, however, this was not a concern of the market. The major indicator which moved the US Treasury yields to the higher grounds was a drop in unemployment combined with an increase in hourly earnings of 0,5% and higher from markets initial estimate. The increase in wages implies higher consumption and in the last instance, higher inflation. In addition, the Michigan inflation expectations rose to the level of 4,1%, indicating that US consumer sentiment stands on expectation of a higher inflation during this year. This was a signal to markets that the Fed will potentially hold interest rates at current levels for a longer period of time.
The 10Y US benchmark rose on Friday to the level of 4,51%, but ended the week at 4,49%. Investors will certainly use the week ahead to digest the latest jobs data in the US. In this sense, some smaller correction in yields might be possible. Still, the US trade tariffs continue to be a concern of investors, in which sense, any negative news related to imposed tariffs might swiftly push the yields again to the higher grounds.

Is the US 10Y yield dropping below 4%?My short-term profit-generating system is giving a strong signal that the US 10Y yield is about to drop below the 4% level.
The US Treasury market is regaining its safe haven status.

$TOTAL2 vs $USM2 RatioIn the crypto world many analysts watch the Money supply called M2 closely to determine the direction of the market. During the last crypto cycle, the CRYPTOCAP:TOTAL2 index (Crypto Market Cap without CRYPTOCAP:BTC ) hit an ATH when the M2 hit 21.75 Tn $. Since then, the M2 Money Supply has been trending down which resulted in a major bear market in the Alt Coin space.
If we look at the chart of CRYPTOCAP:TOTAL2 vs ECONOMICS:USM2 we see that the chart hit an ATH on Nov 21 with M2 peaking in March 22. The ratio chart hit a low on Jan 23 with M2 hitting the cycle low on Mar 23. Since then, the CRYPTOCAP:TOTAL2 vs ECONOMICS:USM2 has shown a steady recovery with an increased money supply. The current level of M2 is still below the peak of March 22. But with increasing M2 we can expect a bull run in the Alt coin market including $BTC. There have been recently some weaknesses in the chart on a short-term basis. Let’s see how the chart develops on a medium-to-long term. Until then watch out for this space. CRYPTOCAP:BTC CRYPTOCAP:TOTAL2 ECONOMICS:USM2

"the top is in", "for the rates"gm,
markets tend to be forward looking, and based off my understanding + the chart data, it appears the top is in for the rates.
i predict the market will begin to price in future rate cuts and start bringing the us10y down.
this will open the door to a "risk on" enviroment for big tech, as well as risk assets like crypto .
---
the count on the us10y is relatively simple.
5 waves up from the 2020 lows.
predicting 3 waves down into the year ahead.
the low on the us10y should coincide with a high in the global liquidity index,,, which is set to peak into the end first month of 2026.
🌙
---
ps. check out the last us10y update from 2 years ago via:

US 10Y TREASURY: relieved tensions, for the momentMuch of the tension collected for the last month has been relieved after the FOMC meeting. The Fed left interest rates unchanged, as was expected and also there were no surprises when it comes to the future course of inflation and potential Fed moves. However, Friday was a game changer, as the US President announced implementation of new import tariffs for goods coming from Canada, Mexico and China. Although the 10Y Treasury yields reached the 4,48% on Thursday, still, Friday news reverted the course of yields to the upside, bringing them to the level of 4,58%.
It will certainly take the next week until markets digest all new information regarding tariffs and its potential effect on the US economy. This also might have implications on the future course of inflation and also in the last instance, to Fed interest rate decisions in the future. For the week ahead, it should also be taken into account that non-farm payrolls and unemployment rate are scheduled for a release, in which sense, market volatility might continue.

Dollar Index Bullish to $111.350 (UPDATE)The Dollar has gone crazy on market open with a 100+ PIPS (0.95%) jump to the upside!
Now that Wave X is complete, we will see a bullish continuation into our Wave Y (Major Wave 5) zone towards the $111.350 zone✈️

Dollar Index Bullish to $111.350 (UPDATE)The Dollar is still pushing up from our second supply zone. I have recounted the waves & relabelled it on the chart.
Wave W peaked at $110, with Wave X correcting towards $107 & now next bull run which is wave Y, is heading towards $111✈️
