US2000 shortLooking to take short on the unmitigated 15min OB if I get a confirmation on lower timeframe
Us2000

Russell US2000 Daily Outlook | 22 - AprYesterday was massively profitable for me. Today, once again lets see how price will react towards my expectations.
Note: Am not a mentor, i am just a random guy who journals his trades on TView for trading community to read and comment their opinion. This not a signal hence copy at your own risk!
Kings.

US2000 Daily Outlook | 21- AprEager to see which way price will eventually choose today.
Will update intermittently.
Kings.

US 2000: A Great Buy Opportunity Is Coming SoonUS2000 is currently moving in a clear ascending channel, accommodated by its recent higher high and higher lows. In the 4-hour chart, we can see that a double bottom has formed at the bottom of the ascending channel and price has recently broken its neckline. This further confirms the bullish momentum. Now, our task is to buy the pullback.
The potential buy entry zone is the 1980 ~ 1990 area. First and second targets are the 2070 and 2110 levels, respectively.

US2000 Daily Outlook - 20 AprCurious to see which way price will choose. Will update by EOD on the result.
Kings.

Russel 2000 Swingtrade (extended)Q1 was a disaster. The good part here is, that it goes for all asset classes. Three important price levels for the US2000: 1900, 2300, 2450 to look at:
Russel 2000 actually looks good and shows decent fundamentals.
Bullish RSI to Price Action ratio, as well as High Volume on hitting the temporary low level 1900. This support level was hit a few times and held.
To the upside:
Local high 2450, big resistance level at 2300.
Two scenarios are possible:
1. Until 2023, creating range (1900-2450 ) retesting over and over the resistance to the upside at around 2300, maybe even cracking it and retesting 2450 and create higher high (200 MA retest in addition favors this move)
2. Going sideways, with the option of retesting lower support levels, especially pre-covid highs at 1700.
Analysts are talking about inflation and recession, the war in Ukraine as well as covid still around creating an overall skeptical atmosphere in the markets. FED, China, and Europe are struggling with the past years of QE and fiscal stimulus.
Earnings season is right now and it is a mixed picture of reports. Very hard to unravel...
Anyway: In my opinion, Russel 2000 could become a good trade getting it at 1900 Levels and making 25% gains when retesting 2450 within months?
For me a good risk to profit ratio. This is no advice here. Just sharing thoughts on a theoretical basis.
What do you think about this? Will the world economy go up, or down this year, or maybe sideways? Think Russel could make it to higher than 2450?
All the best,
GQT

DXY to the MOON?DXY has been in an uptrend for quite a while now. today we crossed the 100.00 mark. Price should correct the last impulse wave before making another leg up

☑️RUSSEL 2000 (US2000): SELL➡️ Markets have been tumbling back and forth over the past couple of weeks amid geopolitical uncertainty, yield curve inversions and talk of a recession. And now we may have received a real bearish reversal signal in the major indices, especially the Russell 2000 Small Cap Index, which was already lagging behind the broader market.
Judging by the dynamics of Russell and a couple of other major indexes, there are indeed reasons for pessimism. The price is in a clear balance of 1878.80 - 2093 , which is most likely formed by sellers in order to push the price further down. The target for selling now most likely is the lower limit of this balance at 1878.80 (first of all) and further market participants will push the price to 1750.62 (second of all).
The mood for sales is very confident. The price area 2036.95 - 2093 will now contain growth and indicate the priority of sales. If the price goes higher, then the sale is called into question.
🔥 S&P500 & US30 Forecast Results 🔥
☑️S&P500: buy priority 👉 +124 points ✅:
☑️US30: stick to the short 👉 +305 points ✅:
➖➖➖➖➖➖➖
👍 Thanks for your comments and likes 👍
👇🔥 LINKS TO PREVIOUS IDEAS AND FORECASTS 🔥👇

US2000 Russell 2000 Trade ReviewSee Picture for full Top-Down Analysis:
Higher Timeframe:
-Price high on 4hr sideways range so selling is a higher probability
-Buy Low with confirmation on lower-frame confirmation and sell high with confirmation on the lower timeframe.
Lower timeframe:
-Price broke upward Trend Line.
-Price Removed Pivot Point Demand Zone
-Rally Base Drop Created
-Sell pullback with 3:1 TP

RUSSELL2000:FUNDAMENTAL NEWS+NEXT TARGET | LONG SETUPRUSSELL 2000 FORECAST:
The Russell 2000 tumbles as U.S. inflation rises at the fastest pace since 1982
Lack of progress in peace negotiations between Russia and Ukraine also weighs on sentiment, accelerating the sell-off on Wall Street
The Russell 2000 near-term outlook remains bearish from a technical perspective
The Russell 2000 fell Thursday in midday trading, sinking about 1.3% to 1,990, weighed down by risk-averse mood due to rising geopolitical tensions and rampant inflation in the United States. Investor sentiment improved briefly yesterday on expectations that the crisis between Russia and Ukraine could begin to de-escalate soon, but the winds shifted again today after high-level talks between the two countries' foreign ministers failed to produce any progress towards a ceasefire.
To make matters worse, U.S. CPI continued to accelerate and reached 7.9% year-on-year in February, its highest level since 1982, driven by rising fuel, food and housing costs.The commodity market price shock of the past few days did not influence data for this period, so we can effectively say that inflation has not yet peaked, and that much higher readings are likely in the coming months.
Mounting price pressures will lead the Fed to raise interest rates multiple times in 2022, starting at next week's meeting, although the hiking cycle may be less aggressive than anticipated earlier in the year amid extraordinary uncertainty stemming from the military conflict in Eastern Europe. In any case, the direction of travel is toward less accommodation and tighter financial conditions over the forecast horizon.
The transition to a more restrictive monetary policy environment, coupled with weakening activity, runaway inflation, and the war in Ukraine, will ensure that volatility remains elevated for the foreseeable future, complicating the equity market recovery, particularly for cyclically oriented companies that are highly dependent on healthy GDP growth. This leaves the economically sensitive Russell 2000 in a precarious situation and vulnerable to near-term weakness.
From a price action perspective, the outlook is bleak for the Russell 2000. Looking at the daily chart, we can see that the index is currently trading below its 200-day, 100-day and 50-day simple moving averages, and has been making lower highs and lower lows in recent months, two bearish signals that reinforce the argument that the path of least resistance is south.
In this regard, if the small and mid-cap stock benchmark stays on a downward trajectory, bears may attempt to launch on assault on 1,890/1,895. This technical support, defined by the 38.2% Fibonacci retracement of the 2020/2021 rally, has been tested twice in recent weeks, successfully repelling sellers each time. Should it be tested again, we may see a bounce from these levels, but if the floor breached, all bets are off, with a breakout exposing the 1,815 region.
On the flip side, if buyers return and bid price higher, resistance is seen near the 2,065 area, where the March high aligns with the 50-day SMA and a descending trendline in play since November last year. If bulls manage to push the index above this barrier, the next upside focus appears at 2,105 (February high). A sustained move above 2,105 and monthly higher high is required to resuscitate buying momentum and improve the near-term outlook.

Russell 2000: FUNDAMENTAL + NEWS INFOs | LONG SETUPRUSSELL 2000 FORECAST:
The Russell 2000 tumbles as U.S. inflation rises at the fastest pace since 1982
Lack of progress in peace negotiations between Russia and Ukraine also weighs on sentiment, accelerating the sell-off on Wall Street
The Russell 2000 near-term outlook remains bearish from a technical perspective
The Russell 2000 fell Thursday in midday trading, sinking about 1.3% to 1,990, weighed down by risk-averse mood due to rising geopolitical tensions and rampant inflation in the United States. Investor sentiment improved briefly yesterday on expectations that the crisis between Russia and Ukraine could begin to de-escalate soon, but the winds shifted again today after high-level talks between the two countries' foreign ministers failed to produce any progress towards a ceasefire.
To make matters worse, U.S. CPI continued to accelerate and reached 7.9% year-on-year in February, its highest level since 1982, driven by rising fuel, food and housing costs.The commodity market price shock of the past few days did not influence data for this period, so we can effectively say that inflation has not yet peaked, and that much higher readings are likely in the coming months.
Mounting price pressures will lead the Fed to raise interest rates multiple times in 2022, starting at next week's meeting, although the hiking cycle may be less aggressive than anticipated earlier in the year amid extraordinary uncertainty stemming from the military conflict in Eastern Europe. In any case, the direction of travel is toward less accommodation and tighter financial conditions over the forecast horizon.
The transition to a more restrictive monetary policy environment, coupled with weakening activity, runaway inflation, and the war in Ukraine, will ensure that volatility remains elevated for the foreseeable future, complicating the equity market recovery, particularly for cyclically oriented companies that are highly dependent on healthy GDP growth. This leaves the economically sensitive Russell 2000 in a precarious situation and vulnerable to near-term weakness.

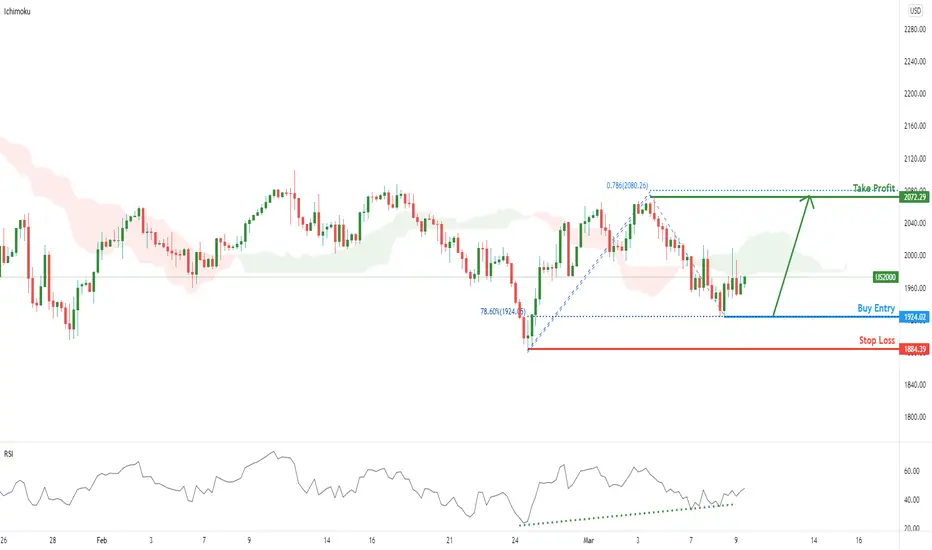
US2000 is on bullish momentum! | 9th March 2022Prices are on bullish momentum. We se the potential for a bounce from our buy entry at 1924.02 in line with 78.6% Fibonacci retracement towards our Take Profit at 2078.79 in line with 78.6% Fibonacci Projection. Our bullish bias is further supported by RSI depicting bullish momentum.
Any opinions, news, research, analyses, prices, other information, or links to third-party sites contained on this website are provided on an "as-is" basis, as general market commentary, and do not constitute investment advice. The market commentary has not been prepared in accordance with legal requirements designed to promote the independence of investment research, and it is therefore not subject to any prohibition on dealing ahead of dissemination. Although this commentary is not produced by an independent source, FXCM takes all sufficient steps to eliminate or prevent any conflicts of interest arising out of the production and dissemination of this communication. The employees of FXCM commit to acting in the clients' best interests and represent their views without misleading, deceiving, or otherwise impairing the clients' ability to make informed investment decisions. For more information about the FXCM's internal organizational and administrative arrangements for the prevention of conflicts, please refer to the Firms' Managing Conflicts Policy. Please ensure that you read and understand our Full Disclaimer and Liability provision concerning the foregoing Information, which can be accessed on the website.
RUSSEL 2000: DOWNTREND | PRICE ACTION IN BEARISH CHANNEL| SHORT Bigger isn't always better.
Case in point: Lots of trading desks are locked in on the dramatic underperformance of the small-cap Russell 2000 Index amid the bounce-back in broader stocks from the late January lows. The Russell 2000 — which is often viewed a proxy for the strength (or lack thereof) of the domestic economy — is down 10.5% this year compared to a 6% drop for the S&P 500 and 3.6% decline for the Dow Jones Industrial Average.
The Russell 2000 has lagged the S&P 500 by 25 percentage points in the past 12 months, its worst 12-month relative return since 1999, notes Goldman Sachs' David Kostin.
"Decelerating GDP growth has been one headwind to the cyclical small-cap index. During the last 20 years, small-caps have lagged on average in periods when the yield curve was flattening, economic growth was strong but decelerating, or financial conditions were tightening," Kostin says.
Traders are now trying to determine whether the weakness in the Russell 2000 suggests another pullback in the markets is in the offing. After all, larger cap stocks are exposed to the same things (tightening financial conditions, higher interest rates, inflation, etc.) as smaller companies.
"The small cap Russell 2000 has been a “canary in the coal mine” for stocks for much of the past year — first warning softly as small cap momentum peaked along with other areas of euphoric sentiment in 1Q21 even as large caps continued to rise, and then more urgently as its breakdown from a year long range led the broader market lower. As stocks bounce from their January slide, though, small caps have shown signs of sputtering below their prior support. Floors can often become resistant when broken, and with the Russell 2000’s recent track record as a leading indicator for broader market weakness, we will be watching the reaction to this level closely. Failure would suggest further correction in stocks lies ahead, while a break above could indicate stabilization," explains Evercore ISI's Julian Emanuel.
Of course, the Russell 2000 sucking wind could mean absolutely nothing to the S&P 500's next big move. No analysis is fool proof. Just file this under your "Things to Watch List," especially as the bulls begin to resurface and blow their normal smoke in your face.
Now go forth and conquer in what will be another mentally draining week of corporate earnings. Happy trading!

THE 'WHY' OF SINKING BITCOIN | JUNKIES ASSET CLASSES WITHDRAWAL The economy of Junkies Asset Classes
Published in early 2022, this is actually our forecast for the price of Bitcoin at that time.. You can check it on our medium for verification. Our fundamental compilation on bitcoin and asset classes in general and a pragmatical content, not married to ideals on both sides bulls and bears while the market is dynamic.
Several shifts happening in the market environment, the core fundamental point is:
Inflation overshoot in the global economy
The end of pandemic fear
Hawkish Fed and the shift to tightening policies
These main theme changes will have a significant impact on asset classes. Including Bitcoin, which is one of the top asset class performances back in 2021 (see the infographic on the post image). Let's get into more detail on the bullet point.
Inflation overshoot in the global economy
This 2022 and forward will be dominated by the effort to fight inflation. Especially in US and UK. This alarmingly high inflation canceled all “transitory” themes the Central Banks try to maintain. All the money printings and liquidity injections get into asset classes as we see everything nonstop all-time high here and there, especially on equities and cryptocurrencies.
The rising wage and tight labor market, declining unemployment, less restriction from regulators around the globe now adding fuel into burning inflation. Not to mention the animal instinct of humans after being domesticated in the house for so long, will be compensated in more aggressive consumption and outdoor activities. In some sense, this is all good for the economy, but many economic forecasters are worried this will overheat and create the boomerang effect when the Central Banks failed to neutralize it.
The end of pandemic fear
We have published our stance on Omicron earlier, which seems in line with today’s situation. Although the infection numbers skyrocketing, the fatality rates are pretty mild. This is the natural universal vaccination and not to mention the vaccination numbers in the major big country economy is very high. The equilibrium between humans and viruses for survival is on the way to being achieved. This is bullish for the economy and is also connected to inflation. There are probable supply chain problems and bottlenecks here and there. However, this seems to be easing from time to time. If it ain’t so, it will be burning the inflation for more.
Hawkish Fed and the shift to tightening policies
This is the most fundamental point. Several weeks ago we saw the most dovish guy in the office, Fed Kaskhari, turn hawkish and aware of the danger of inflation. From zero expected rate increases in 2022 two increases. The dot plot or Summary of Economic Prediction shows an increase in the median expected path of the federal funds rate over the next few years.
This is the most fundamental point. Several days ago we see the most dovish guy in the office, Fed Kaskhari, turn hawkish and aware of the danger of inflation. From zero expected rate increases in 2022 two increases. The dot plot or Summary of Economic Prediction shows an increase in the median expected path of the federal funds rate over the next few years.
We will see outflow from asset classes, for more even last year we already saw some big money outflow from stocks. And withdrawal symptoms will start to kick in as there are not so many ‘easy money drugs’ anymore which creates crazy valuation in junkies asset classes. This money probably will be used more in the real economic sectors. Check out how indices and BTCUSD going down in rhythm:
The same goes for cryptos, multiple record outflow has happened. The incoming bear market will be more likely in the short and middle term. The only thing that can bring cryptocurrencies growth is another easing mode of central banks.

Russell2000 Held at 2100 Support, Counter Trend Move to 2280Trend Analysis
The main view of this trade idea is on the 15-Min Chart.
Support appears to have held at around the 2100 for the Russell 2000 Index (US2000). This is corroborated by the US2000 crossing above its medium term (195-MA) moving average. Also the Supertrend broke above its 2146 resistance above the last trading session. When observing the technical indicators there is a unique pattern on the Awesome Oscillator (AO) and the RSI. There is positive price divergence with the indicators. The AO is above 0 and the RSI is greater than 50. It is expected that US2000 rallies towards the 2280 price level. Failure of this move will be seen if US2000 declines below 2100.
The Point and Figure chart as well is showing a bullish reversal. Support is seen around 2110 and the Index rallied above its short (30-MA), medium (100-MA) and long (200-MA) moving averages. There are also positive crossovers with the short and medium as well as short and long term MAs. The AO is above 0 with the RSI trading above 50.
The longer term view remains corrective for the US2000. Resistance is observed around 2185.
Recommendation
The recommendation will be to go long at market, with a stop loss at 2100 and a target of 2280. This produces a risk/reward ratio of 1.70.
Disclaimer
The views expressed are mine and do not represent the views of my employers and business partners. Persons acting on these recommendations are doing so at their own risk. These recommendations are not a solicitation to buy or to sell but are for purely discussion purposes. At the time of publishing I have exposure to US2000.

US2000 RUSSELLIm short Rusell from 2100 entered via order 10.2.2022 with SL at 2180 target 1700
Area from 2100 to 2160 was a big support for the entirety of 2021 now turned resistance.
FED is getting more hawakish by the day yesterday we got PPI 1% which is a leading indicator for CPI inflation is still going up FED will try to curb it. Bad news for stocks.
FOMC meeting minutes release today.
On 4h 200ma just caught up with current price action.

US2000 Control Area...After having analyzed the behavior in today's relevant news, we see that there has been an institutional accumulation and there is a bullish projection.
Best Regards.
@MartinTopTrader

US2000 Waiting for...In trading you do not operate constantly, you have to listen to the market and wait for it to give us clear information to operate while limiting the risk well.
Best Regards.
@MartinTopTrader

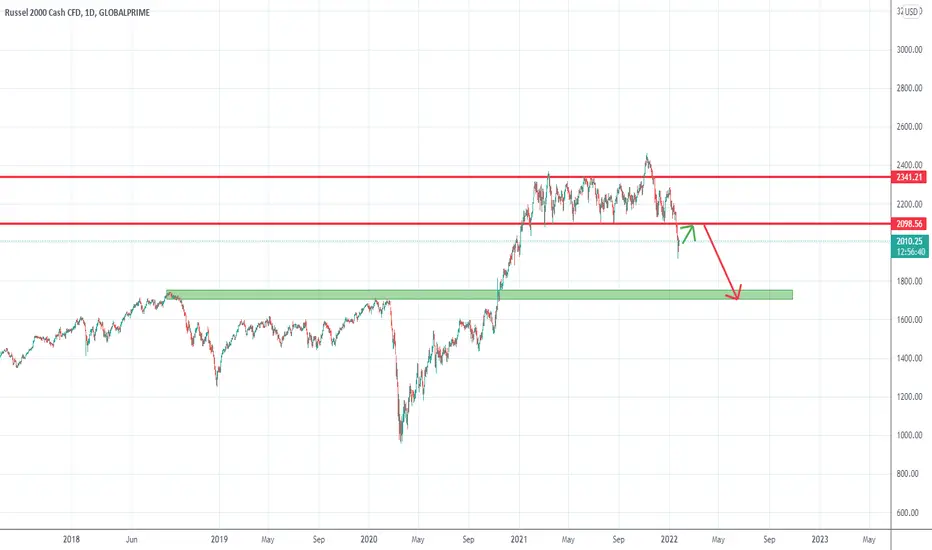
Russell2000 offer us clues for what's about to happenMore often than not, Russell2000 is ignored by traders. However, this index can offer us valuable clues of what's about to happen next in the economy and with major indices simply because it contains 2000 companies and these companies are medium size, reflecting best the state of the economy.
If we look at the posted chart we can see that the index has traded in a range between 2100 and 2350 with a spike in November that marks the top and the final of the uptrend.
This consolidation is proving to be distribution in fact and, considering it took a year, we can expect a major drop this year.
That being said, the index can lose 20% of its value to around 1700 zone support
Although, I don't trade Russell2000, my idea for other indices going in 2022 is very simple: sell rallies
ASSET CLASSES SYNCHRONISED SWIMMIMG TEAMSince January they all fall in sync as the Fed start to shift into tightening mode of policies.

Russell 2000: In the triangle and bullish divergenceWe are in the middle on the never-ending triangle on the daily chart. There was a false breakout a couple of weeks ago but it seems bulls are strong enough to break out this triangle once and for all. For swing traders, sell with an adjusted stop loss and for long-term traders, buy if there is a correction to the lower part of the triangle (2155) or after the correction if there is a breakout (2287). The bullish signal on the RSI is there and it must be taken into consideration and the 2575 level should be reached if the triangle breakout takes place, but normally, after 1 year going sideways, the uptrend should be much longer.

🔜S&P500: "NO COMMENTS"🔔 Proposed deal for this tool 🔔:
🔴Entry Point - 4637.6
⛔️Stop Loss - 4679.3
✅Take Profit - 4554.3
Thanks for your comments and likes 👍
👇🔥 LINKS TO PREVIOUS IDEAS AND FORECASTS 🔥👇

US30: potential downAnd so, according to the US30 index, some beginning of the downward correction can be traced. Now it is assumed that the instrument may rise to the level of $ 36,090, after which it will be under pressure from the sellers and the index will roll down. The target of the fall will be to break the level of $ 35607.
Remember, there is no place for luck in trading - only strategy!
Thanks for the likes and comments.
