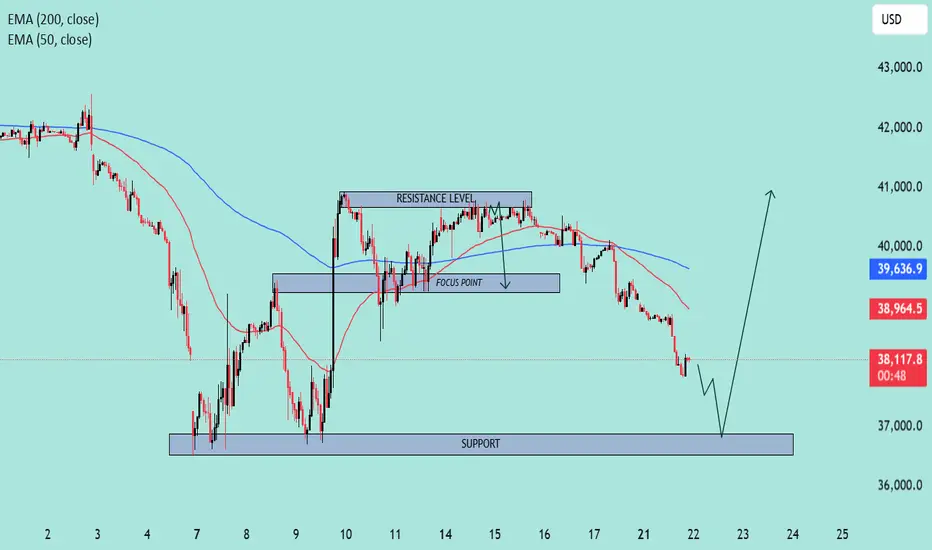
US30 Approaching Key Support Zone – Potential Reversal Ahead?📊 Chart Overview:
Timeframe: Looks like an intraday (maybe 1H or 2H).
Indicators:
EMA 50 (Red): 38,964.7
EMA 200 (Blue): 39,637.0
🔍 Key Levels & Structure:
🔵 Support Zone (Highlighted):
Around 36,800 – 37,200 range.
This is a well-tested support level where price previously bounced.
Current price action is approaching this zone again, which increases the chance of a potential bullish reaction.
🟣 Resistance Level:
Defined around 40,500 area.
Price has rejected multiple times from this zone.
Previously served as a consolidation/decision area.
📍 Focus Point (Previous Support Turned Resistance):
Near 38,700 – 39,000.
This level may act as a reaction point on the way back up.
📉 Current Price Action:
Strong downward momentum heading into the support zone.
Price is under both EMAs, suggesting short-term bearish trend.
However, the drawn arrow suggests a potential reversal bounce from the support.
🧠 Interpretation & Scenario Plan:
🅰️ Bullish Scenario:
Price touches or sweeps the support zone.
Bullish structure or reversal candle forms (e.g., hammer, bullish engulfing).
Break back above EMA 50 & Focus Point could confirm the shift.
Target: Revisit Resistance Zone (above 40,000).
🅱️ Bearish Scenario:
Support fails to hold.
Clean break below 36,800 with volume could lead to accelerated sell-off.
Watch for breakdown retests of support turned resistance.
🔔 Takeaway:
⚠️ Current move is bearish, but price is approaching a key demand zone. Bulls might step in if the zone holds. Confirmation is key before going long. Reclaiming EMAs would strengthen bullish bias.
US30
Trade Idea: US30 Short (SELL STOP)1. Technical Analysis
Daily Chart
• Trend: Still overall bullish long-term, but in a short-term pullback phase after peaking.
• MACD: Bearish crossover with widening histogram — indicating continued downside momentum.
• RSI: At 45.05 — neutral-bearish, room to fall to oversold.
• Price: Strong reaction at ~37675.05 area, bounced back to ~39562, forming a potential lower high.
15-Min Chart
• MACD: Recently crossed bearish after a sharp rally.
• Price Action: Approaching resistance zone (~39562), failed to make a new high.
• RSI: 44.78 — leaning bearish, but not oversold yet.
3-Min Chart
• MACD: Just flipped bullish but weak — suggesting possible micro pullback before continuation.
• RSI: 48.82 — very neutral, no extreme condition.
⸻
2. Fundamental Context (as of April 2025)
• Recent sharp pullback from all-time highs hints at risk-off sentiment returning.
• Likely driven by Fed rate uncertainty, inflationary stickiness, or geopolitical jitters.
• Earnings season volatility could also play a role.
• No strong bullish macro catalyst to support a fresh rally continuation yet.
⸻
3. Trade Setup: SHORT Position
Bias: SHORT
Reason: Price hit resistance at 39562, confirmed by 15M MACD cross and RSI weakness. Daily still bearish momentum. No major bullish catalyst.
⸻
ENTRY:
39550 (near current resistance, confirmed failure to break higher)
STOP LOSS (SL):
39800 (above recent minor high, above 15M key level)
TAKE PROFIT (TP):
38900 — Minor support zone, clean level from 15M + previous consolidation area
FUSIONMARKETS:US30

Us30 Upward or downward?In the 5-minute timeframe, you can sell at the top of the trading range and buy at the bottom of the trading range (by observing reversal candles and patterns).
Alternatively, you can wait for a breakout and enter in the direction of the breakout.
Be mindful of fake breakouts

Dow Jones INTRADAY capped at 40954Key Support and Resistance Levels
Resistance Level 1: 40954
Resistance Level 2: 41510
Resistance Level 3: 42216
Support Level 1: 39600
Support Level 2: 38534
Support Level 3: 37832
This communication is for informational purposes only and should not be viewed as any form of recommendation as to a particular course of action or as investment advice. It is not intended as an offer or solicitation for the purchase or sale of any financial instrument or as an official confirmation of any transaction. Opinions, estimates and assumptions expressed herein are made as of the date of this communication and are subject to change without notice. This communication has been prepared based upon information, including market prices, data and other information, believed to be reliable; however, Trade Nation does not warrant its completeness or accuracy. All market prices and market data contained in or attached to this communication are indicative and subject to change without notice.

DOW JONES INDEX (US30): Another Gap to Watch
US30 is on its way to fill the gap up that was formed 2 days ago.
It looks like the market will reach a gap opening level soon.
I expect a bearish movement at least to 39285
❤️Please, support my work with like, thank you!❤️
I am part of Trade Nation's Influencer program and receive a monthly fee for using their TradingView charts in my analysis.

DOW JONES New long-term bottom being formed on the 1W MA200.Dow Jones (DJI) hasn't yet broken above its 1D MA50 (blue trend-line) following the April 07 Low, but is nonetheless consolidating and holding the 1W MA200 (red trend-line), which hasn't broken as Support since October 17 2022.
That was a few days after the bottom of the 2022 Inflation Crisis was formed and the current Channel Up started. In fact, the rallies that started on both Channel Up bottoms since, have been almost identical in range (+22.60% and +23.80% respectively) so technically we should be expecting at least 44800 (+22.60% from April's Low) on the medium-term.
-------------------------------------------------------------------------------
** Please LIKE 👍, FOLLOW ✅, SHARE 🙌 and COMMENT ✍ if you enjoy this idea! Also share your ideas and charts in the comments section below! This is best way to keep it relevant, support us, keep the content here free and allow the idea to reach as many people as possible. **
-------------------------------------------------------------------------------
Disclosure: I am part of Trade Nation's Influencer program and receive a monthly fee for using their TradingView charts in my analysis.
💸💸💸💸💸💸
👇 👇 👇 👇 👇 👇

Could the price bounce from here?Dow Jones (US30) is falling towards the pivot which is an overlaps upport and could bounce to the 1st resistance which acts as a pullback resistance.
Pivot: 39,318.40
1st Support: 37,848.26
1st Resistance: 40,824.20
Risk Warning:
Trading Forex and CFDs carries a high level of risk to your capital and you should only trade with money you can afford to lose. Trading Forex and CFDs may not be suitable for all investors, so please ensure that you fully understand the risks involved and seek independent advice if necessary.
Disclaimer:
The above opinions given constitute general market commentary, and do not constitute the opinion or advice of IC Markets or any form of personal or investment advice.
Any opinions, news, research, analyses, prices, other information, or links to third-party sites contained on this website are provided on an "as-is" basis, are intended only to be informative, is not an advice nor a recommendation, nor research, or a record of our trading prices, or an offer of, or solicitation for a transaction in any financial instrument and thus should not be treated as such. The information provided does not involve any specific investment objectives, financial situation and needs of any specific person who may receive it. Please be aware, that past performance is not a reliable indicator of future performance and/or results. Past Performance or Forward-looking scenarios based upon the reasonable beliefs of the third-party provider are not a guarantee of future performance. Actual results may differ materially from those anticipated in forward-looking or past performance statements. IC Markets makes no representation or warranty and assumes no liability as to the accuracy or completeness of the information provided, nor any loss arising from any investment based on a recommendation, forecast or any information supplied by any third-party.

Trade Idea: US30 Long ( BUY LIMIT )Technical Analysis Summary:
Daily Chart:
• The US30 is bouncing off a recent sharp correction with a bullish engulfing candle forming at support (around 37,675).
• RSI is recovering from oversold territory, now at 46.14 – momentum is shifting.
• MACD still bearish but histogram is shrinking, indicating weakening downward momentum.
15-Minute Chart:
• Strong recovery after a double-bottom near 38,200.
• RSI at 74.55 shows near overbought but still trending up – strong momentum.
• MACD showing a strong bullish crossover and rising histogram – confirmation of intraday trend.
3-Minute Chart:
• Strong breakout to the upside with consolidation at highs.
• RSI around 58 – room to move higher.
• MACD bullish, histogram expanding – short-term continuation likely.
⸻
Fundamental Context (as of April 2025):
• Recent correction in US indices is likely a pullback within a broader bull market (based on Q1 earnings optimism and easing inflation expectations).
• No major Fed tightening signals – bullish for equities.
• Dow Jones (US30) often rebounds strongly after panic drops, especially when technicals align with macro calm.
⸻
Trade Setup (Buy):
• Entry: 39,700 (current consolidation after breakout)
• Stop Loss (SL): 39,150 (below last minor pullback structure and below 3M EMA support)
• Take Profit (TP): 40,800 (near previous structure on the Daily and round number psychological level) FUSIONMARKETS:US30

US30: Local Bearish Bias! Short!
My dear friends,
Today we will analyse US30 together☺️
The price is near a wide key level
and the pair is approaching a significant decision level of 39,946.6 Therefore, a strong bearish reaction here could determine the next move down.We will watch for a confirmation candle, and then target the next key level of 39,429.8..Recommend Stop-loss is beyond the current level.
❤️Sending you lots of Love and Hugs❤️

Dow Jones INTRADAY oversold bouncebackKey Support and Resistance Levels
Resistance Level 1: 40954
Resistance Level 2: 41510
Resistance Level 3: 42216
Support Level 1: 39600
Support Level 2: 38534
Support Level 3: 37832
This communication is for informational purposes only and should not be viewed as any form of recommendation as to a particular course of action or as investment advice. It is not intended as an offer or solicitation for the purchase or sale of any financial instrument or as an official confirmation of any transaction. Opinions, estimates and assumptions expressed herein are made as of the date of this communication and are subject to change without notice. This communication has been prepared based upon information, including market prices, data and other information, believed to be reliable; however, Trade Nation does not warrant its completeness or accuracy. All market prices and market data contained in or attached to this communication are indicative and subject to change without notice.

USDJPY BULLISH OR BEARISH DETAILED ANALYSISUSDJPY has just completed a clean breakout above a well-defined descending channel on the 4H chart, signaling the beginning of a short-term bullish wave. This move reflects a technical shift in sentiment as buyers reclaim control after weeks of selling pressure. The breakout candle closed above the upper trendline, indicating a strong potential for continuation. The target zone appears to align with the previous resistance zone around 147.68, where price reacted multiple times in the past, creating a well-defined liquidity area.
From a fundamental standpoint, the dollar is regaining traction following a stabilization in U.S. Treasury yields and a slight pullback in geopolitical tensions. Market participants are also pricing in a slightly more hawkish Fed tone, as inflation remains persistent and jobless claims continue to show strength. Meanwhile, the Bank of Japan remains firmly dovish, with no indication of tightening policy anytime soon, reinforcing yen weakness and supporting the upside momentum in USDJPY.
This current price action is not just technical—it is aligned with macro drivers. The divergence in monetary policy stance between the Federal Reserve and the Bank of Japan continues to be a key bullish factor for USDJPY. As long as U.S. inflation remains sticky and Fed officials lean toward holding or even hiking rates, this pair is likely to stay supported on dips. Add to that Japan’s fragile domestic consumption outlook and persistent intervention threats, and USDJPY may find itself grinding higher toward resistance zones.
In conclusion, with the channel breakout confirmed and fundamentals favoring a bullish bias, I’m eyeing upside continuation toward 147.68. A tight stop below 140.20 makes the setup attractive in terms of risk-reward. I'll be watching price reaction at interim levels, but the structure is clean and the setup has strong confluence—perfect for capturing this short-term wave.

US30 | 1H | BUYHey There;
SIGNAL ALERT
BUY US30 / 38,689,19
🟢TP1: 39,258,56
🟢TP2: 39,910,75
🟢TP3: 41,287,59
🔴SL: 37,415,50
RR / 2,00
Please don't forget to like 🙏🏻
Thanks to everyone who supports my analysis with likes. 💙💙💙

Trade Idea: US30 Long ( MARKET )Technical Justification:
Daily Chart:
• Oversold Conditions: RSI is at 35.90, approaching oversold.
• MACD is deeply negative (-905.428 / -831.781), signaling extended downside and a potential for a mean reversion bounce.
• Price recently bounced sharply off a support area around 37,800–38,000, forming a possible bullish rejection wick.
15-Min Chart:
• Bullish Divergence visible in RSI and MACD.
• RSI rebounded from sub-30 to 52.10, signaling strengthening momentum.
• MACD histogram has reduced in negativity, suggesting decreasing bearish pressure.
3-Min Chart:
• Clear short-term uptrend forming after a strong intraday drop.
• RSI 62.56 and MACD turning positive show bullish momentum building.
• Price just reclaimed a key intraday level (~38139) with follow-through.
⸻
Fundamental Bias:
Recent oversold market conditions, combined with potential short-term relief rally due to earnings optimism, Fed rate pause speculation, or geopolitical cooling, support a tactical long bias.
⸻
Trade Setup:
• Entry (Buy): 38,150
• Above the minor resistance turned support zone and confirmation of bullish momentum.
• Stop Loss (SL): 37,800
• Below the recent strong support zone from Daily and intraday.
• Take Profit (TP): 38,750
• Just below the next major resistance zone on the 15-min/1H chart. FUSIONMARKETS:US30

US30 – Descending Channel intact after False BreakoutFX:US30 is currently trading within a clearly defined descending channel, with price action continuously being restricted by the upper trendline. The recent decline indicates that sellers are in control, suggesting the possibility of continuation.
Price has recently broken through a key support area and may come back to retest it. If this level holds as support, it will reinforce the bearish structure and increase the likelihood of a move toward the 34,100 target, which aligns with the boundary of the channel.
As long as price remains below this support area, the bearish outlook remains intact. A false breakout may occur to "trap" buyers, so it is necessary to wait for clear reversal candle confirmation before entering a trade.
Remember, always confirm your setup and use appropriate risk management.

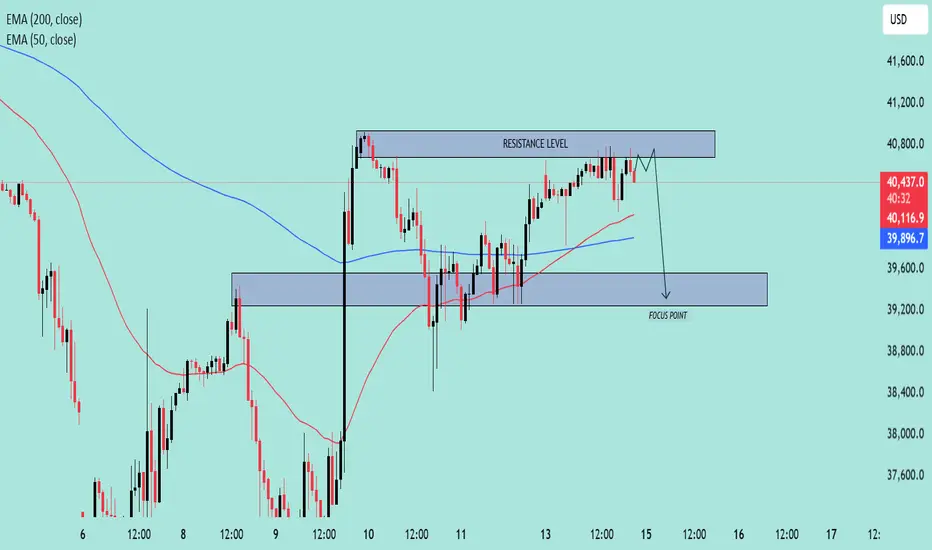
US30 Approaching Key Resistance–Potential Reversal Setup in Play🧠 Chart Overview
Asset: US30 (likely the Dow Jones Industrial Average)
Timeframe: Appears to be 1H or 2H
Indicators:
EMA 50 (Red): 40,119.5
EMA 200 (Blue): 39,897.3
Price at time of chart: Around 40,503
🔍 Key Technical Levels
🔴 Resistance Zone
Range: ~40,750 to 40,850
Price has tested this level multiple times and is currently hovering near it.
The resistance is holding, and no strong breakout has occurred.
🟦 Support / Focus Zone
Range: ~39,200 to 39,600
Marked as the “FOCUS POINT” – likely the expected target on a breakdown.
EMAs Insight:
Price is above both the 50 EMA and 200 EMA, suggesting short-term bullishness.
However, since it’s stalling at resistance, it could flip bearish on rejection.
🧭 Price Action Narrative
The chart suggests a potential fakeout above resistance, followed by a sharp rejection.
The path drawn shows a short-term dip, targeting the FOCUS POINT (support zone).
Rejection at resistance aligns with typical distribution behavior.
📌 Trade Idea (Bearish Bias)
Entry Idea: Short near or just above the resistance level (~40,800)
Target: 39,400 zone
Stop-Loss: Above the resistance level (~40,900+)
Risk/Reward: Favorable if price fails to break above resistance convincingly
📉 Bias: Bearish Reversal
Unless price breaks and closes above resistance with strong momentum, the chart favors a pullback scenario.
Dow Jones Potential DownsidesHey Traders, in the coming week we are monitoring US30 for a selling opportunity around 39700 zone, Dow Jones is trading in a downtrend and currently is in a correction phase in which it is approaching the trend at 39700 support and resistance area.
Trade safe, Joe.

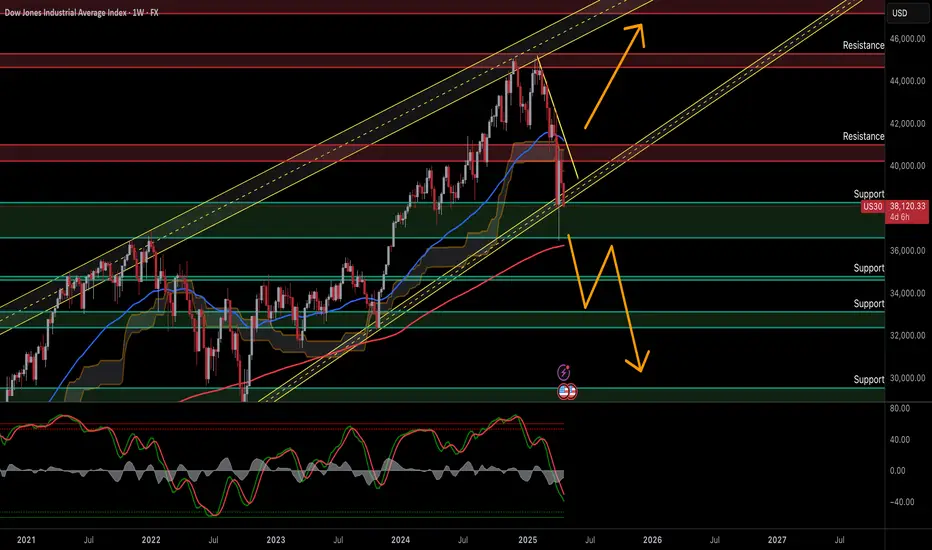
US30 Weekly: Support Under Threat - Prepare for More Downside?US30 Weekly Analysis - Potential Trading Setup
Technical Outlook — 21 April 2025
Current Market Condition:
US30 on the weekly timeframe is trading within a long-term ascending channel. Price recently experienced a sharp correction, breaking below the middle of the channel and is now testing a key support zone.
Potential Trading Setup:
Potential Reversal/Long Setup (Primary Scenario):
Entry: Look for strong bullish reversal signals within the current support zone (around 37,500 - 38,500). This could include bullish candlestick patterns on the weekly or daily timeframe, coupled with the Stochastic indicator showing a bullish divergence or crossing up from oversold territory.
Stop Loss: Place a stop loss below the low of the reversal signal or below the lower boundary of the support zone (below 37,500).
Take Profit Targets:
TP1: The middle of the ascending channel (around 40,500 - 41,000).
TP2: The upper trendline of the ascending channel (currently around 44,000 - 45,000, and rising over time).
Bearish Continuation Setup (Secondary Scenario):
Entry: If bullish reversal signals fail to materialize and the price breaks decisively below the current support zone (below 37,500), look for short entry opportunities. The Stochastic indicator confirming downward momentum would add confluence to this setup.
Stop Loss: Place a stop loss above the high of the breakdown candle or above the broken support zone.
Take Profit Targets:
TP1: The next significant support level around 34,000 - 35,000.
TP2: The lower boundary of the ascending channel (currently around 32,000 - 33,000, and rising over time).
Important Considerations:
Weekly Timeframe Significance: Trading setups on the weekly chart require patience and can take time to play out.
Confirmation is Crucial: Wait for clear confirmation signals, including price action and signals from the Stochastic indicator, before entering any trades.
Channel Dynamics: The ascending channel trendlines are dynamic and will change over time.
Risk Management: Employ appropriate position sizing and always use stop-loss orders.
If you found this analysis valuable, kindly consider boosting and following for more updates.
Disclaimer: This content is intended for educational purposes only and does not constitute financial advice.
EURJPY --- bullish or bearish detailed analysis EURJPY is currently offering a high-conviction long opportunity as the pair completes a classic falling wedge breakout pattern on the daily timeframe. Price is now trading around 162.45 and has just broken out of a well-defined descending trendline, validating the bullish momentum shift. With the recent higher low formation and the wedge breakout confirming bullish market structure, the next leg toward the 167.36 zone is on the table, aligning with a clean resistance level and historical price reaction zone.
Fundamentally, the Euro is underpinned by the ECB’s cautious stance on rate cuts, as inflation in the Eurozone remains above the 2% target. Meanwhile, the Japanese Yen continues to weaken amid growing divergence between the Bank of Japan’s ultra-loose monetary policy and other global central banks maintaining relatively tight conditions. BoJ’s reluctance to tighten, combined with consistent intervention threats, hasn’t been enough to halt the Yen’s decline, making EURJPY an attractive long in the current macro backdrop.
Technicals align perfectly here—after a solid rally from the wedge bottom, EURJPY consolidated in a descending channel and has now broken out for a second time, repeating a bullish continuation pattern. The structure remains clean with clear invalidation below 161.26, offering a strong reward-to-risk ratio on continuation toward 167+. The multiple confluences of trendline breakouts, bullish market structure, and macro divergence make this a premium swing setup.
Highly searched keywords like “EURJPY breakout,” “falling wedge pattern,” and “JPY weakness” will drive additional traffic to this idea. With both price action and fundamentals in sync, this trade idea is structured to maximize upside potential while keeping risk controlled. A clean, strategic long setup that reflects disciplined execution and market awareness.

US30 – Monthly Market Structure Analysis (April 2025) – OLHC BUY
As we analyze the monthly structure of the US30 index for April 2025, several key technical developments and strategic insights are worth noting:
1. Monthly Low Established:
The price action for this month has thus far established a significant low, indicating a potential bottoming pattern that may signal the beginning of a bullish move.
2. Key Support Level and First Rejection:
A strong bullish rejection was observed at the 37,000 level, which has proven to be a substantial support zone. This level held firmly, suggesting strong buyer interest and institutional accumulation.
3.Target Projection:
My primary take-profit target for this upward move is projected at **41,834.42** , which aligns with higher timeframe resistance and Fibonacci extension levels. This offers a favorable risk-to-reward scenario for long entries.
4. Waiting for Confirmation:
At present, I am closely monitoring price behavior near a **minor support zone**, where I anticipate another rejection that could provide the ideal entry signal for initiating buy positions. Patience remains key as we await further confirmation.
5. Strategic Considerations:
- Risk Management: Traders are advised to apply proper risk management protocols. Avoid over-leveraging, and ensure your trade size is appropriate to your account equity.
- Discipline: Do not rush into trades. Wait for solid confirmation signals, such as bullish candlestick patterns or momentum shifts, before committing capital.
- Market Conditions: Be aware of upcoming economic events or fundamental news that may impact US indices, and adjust your strategy accordingly.
6. Community Engagement:
If you found this analysis insightful and aligned with your trading view, feel free to like, share, and follow for more structured market updates and trading ideas.
Let’s trade smart, stay patient, and manage risk with precision. All the best this month!

CHFJPY TECHNICAL AND FUNADEMENTALS DETAILS ANALYSISCHFJPY has just broken out of a long-term descending channel on the daily chart, currently trading near 174.09. This breakout is technically significant, as it marks the end of a prolonged downtrend and suggests the beginning of a potential bullish reversal. The price action shows a clean breakout above the upper channel resistance, followed by a healthy retest—textbook price behavior when momentum shifts to the upside. With this structure flip, we are now positioning for a continuation towards the 182.40 zone, which aligns with a previous key resistance and measured move projection.
This breakout is supported by strong fundamentals. The Swiss Franc remains firm, driven by Switzerland’s resilient economic data and the Swiss National Bank’s cautious monetary stance. Meanwhile, the Japanese Yen continues to struggle as the Bank of Japan maintains its ultra-loose policy, despite recent signs of inflation picking up. The yield differential and risk-on sentiment are weighing heavily on JPY, making it an ideal quote currency for this bullish CHF move. Traders are increasingly favoring CHFJPY in the current macro landscape due to this divergence.
What makes this setup even more attractive is the clean technical structure paired with a favorable risk-reward ratio. The stop below the retest area around 171.63 offers tight risk management, while the upside potential toward 182.40 presents a strong 1:3+ R/R swing opportunity. These types of breakouts—especially after extended consolidation—often lead to trend-following momentum plays that institutions favor.
CHFJPY is now on many watchlists across TradingView due to this breakout from a descending channel, which is a highly searched pattern by technical traders. This pair is poised to deliver a profitable swing trade backed by both technical strength and macro alignment. If momentum continues, we could see a strong bullish leg throughout Q2.

Bearish drop?Dow Jones (US30) is reacting off the pivot nd could drop to the 1st support that lines up with the 61.8% Fibonacci extension.
Pivot: 39,291.00
1st Support: 37,024.36
1st Resistance: 40,624.32
Risk Warning:
Trading Forex and CFDs carries a high level of risk to your capital and you should only trade with money you can afford to lose. Trading Forex and CFDs may not be suitable for all investors, so please ensure that you fully understand the risks involved and seek independent advice if necessary.
Disclaimer:
The above opinions given constitute general market commentary, and do not constitute the opinion or advice of IC Markets or any form of personal or investment advice.
Any opinions, news, research, analyses, prices, other information, or links to third-party sites contained on this website are provided on an "as-is" basis, are intended only to be informative, is not an advice nor a recommendation, nor research, or a record of our trading prices, or an offer of, or solicitation for a transaction in any financial instrument and thus should not be treated as such. The information provided does not involve any specific investment objectives, financial situation and needs of any specific person who may receive it. Please be aware, that past performance is not a reliable indicator of future performance and/or results. Past Performance or Forward-looking scenarios based upon the reasonable beliefs of the third-party provider are not a guarantee of future performance. Actual results may differ materially from those anticipated in forward-looking or past performance statements. IC Markets makes no representation or warranty and assumes no liability as to the accuracy or completeness of the information provided, nor any loss arising from any investment based on a recommendation, forecast or any information supplied by any third-party.

Trade Idea: US30 Short (SELL STOP)Technical Analysis Summary:
Daily Chart (Macro View):
• Trend: Bearish short-term (price is below the moving average, sharp recent drop).
• MACD: Bearish momentum building with a deepening histogram.
• RSI: At 42.22, pointing down – no oversold condition yet, so further downside is probable.
15-Minute Chart (Mid-Term Momentum):
• Trend: Recently broke down from consolidation, failed to reclaim previous high.
• MACD: Strong bearish crossover, deep in negative territory.
• RSI: At 39.20, not oversold – room to fall.
3-Minute Chart (Entry Timing):
• Trend: Weak recovery attempt stalled below moving average.
• MACD: Flat to downtrend.
• RSI: Around 40, suggesting more downside pressure without being oversold.
⸻
Fundamental Context (if relevant to US30):
• Rising geopolitical tensions and weak earnings reports (assumed).
• Dovish Fed fading, bond yields rising — bearish for equities.
• Fear-driven sentiment often hurts cyclical indices like US30.
⸻
Trade Setup (SHORT):
• Entry: 39595 (current price area as per charts).
• Stop Loss (SL): 40087
(Above minor resistance and 15M consolidation top)
• Take Profit (TP): 38650
(Recent support zone, room for price to breathe before demand zone)
FUSIONMARKETS:US30

Dow INTRADAY key resistance at 41333Key Support and Resistance Levels
Resistance Level 1: 41333
Resistance Level 2: 42000
Resistance Level 3: 42800
Support Level 1: 39220
Support Level 2: 37554
Support Level 3: 36620
This communication is for informational purposes only and should not be viewed as any form of recommendation as to a particular course of action or as investment advice. It is not intended as an offer or solicitation for the purchase or sale of any financial instrument or as an official confirmation of any transaction. Opinions, estimates and assumptions expressed herein are made as of the date of this communication and are subject to change without notice. This communication has been prepared based upon information, including market prices, data and other information, believed to be reliable; however, Trade Nation does not warrant its completeness or accuracy. All market prices and market data contained in or attached to this communication are indicative and subject to change without notice.
