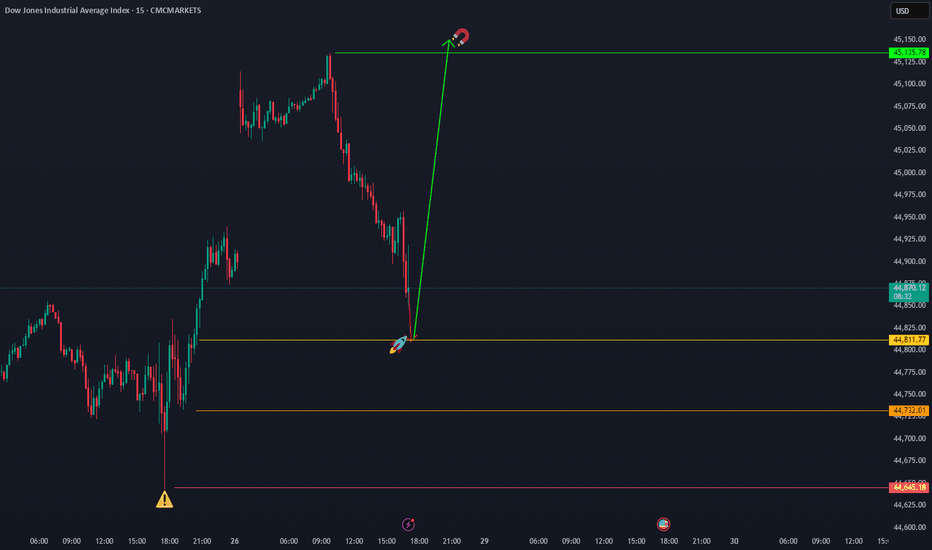
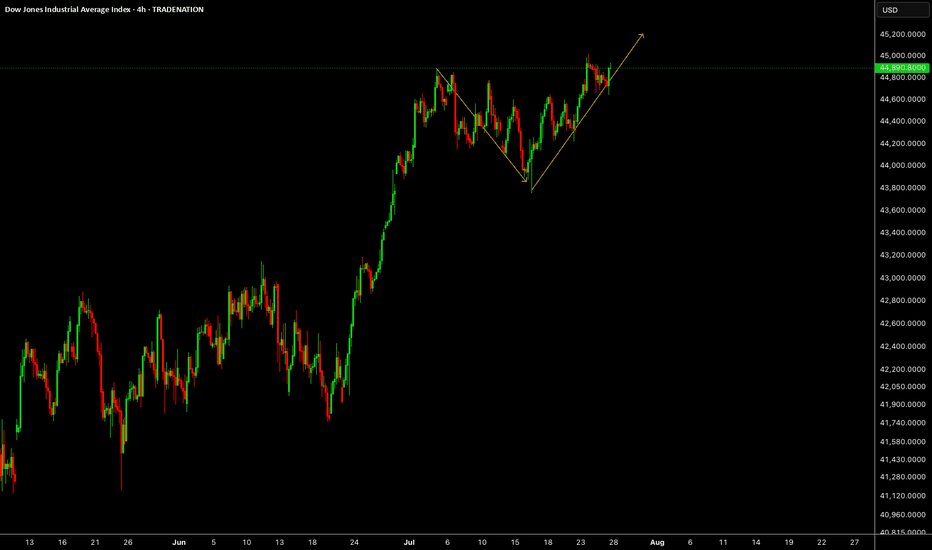
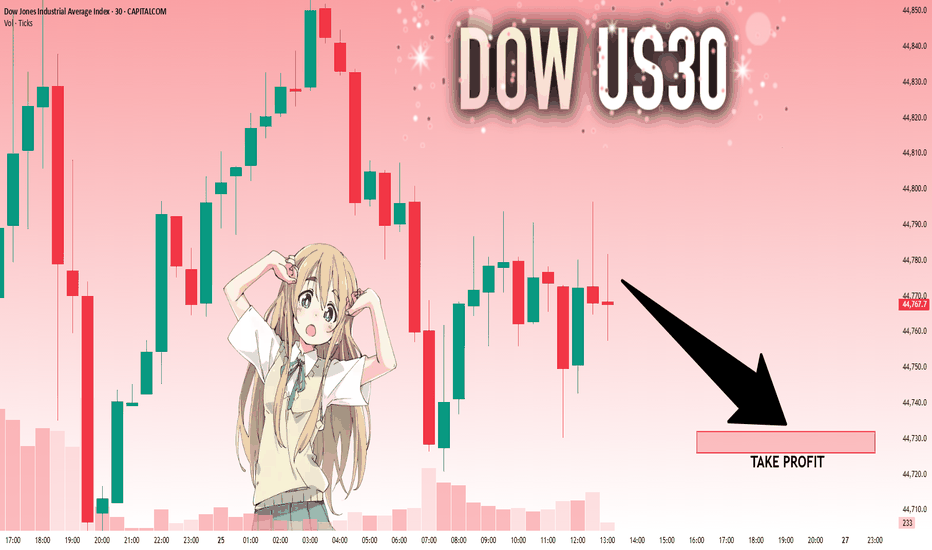
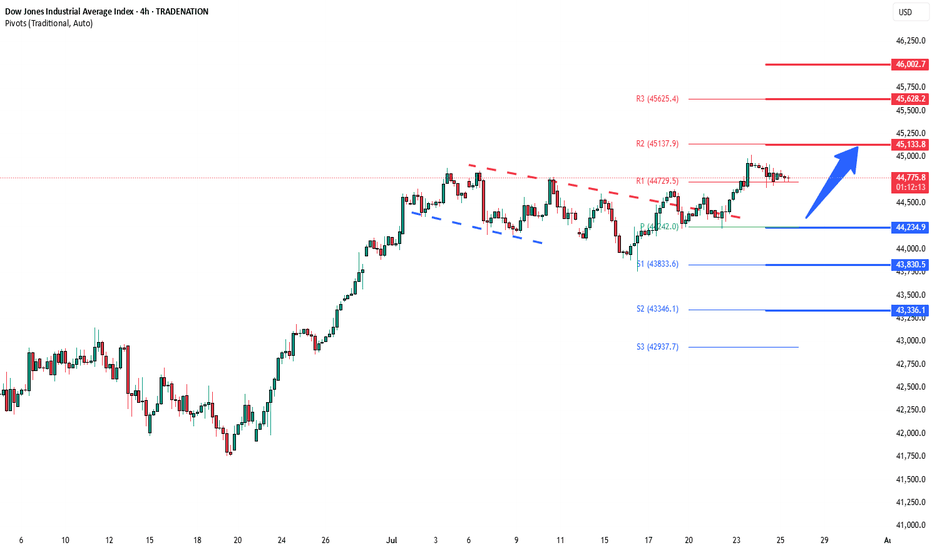
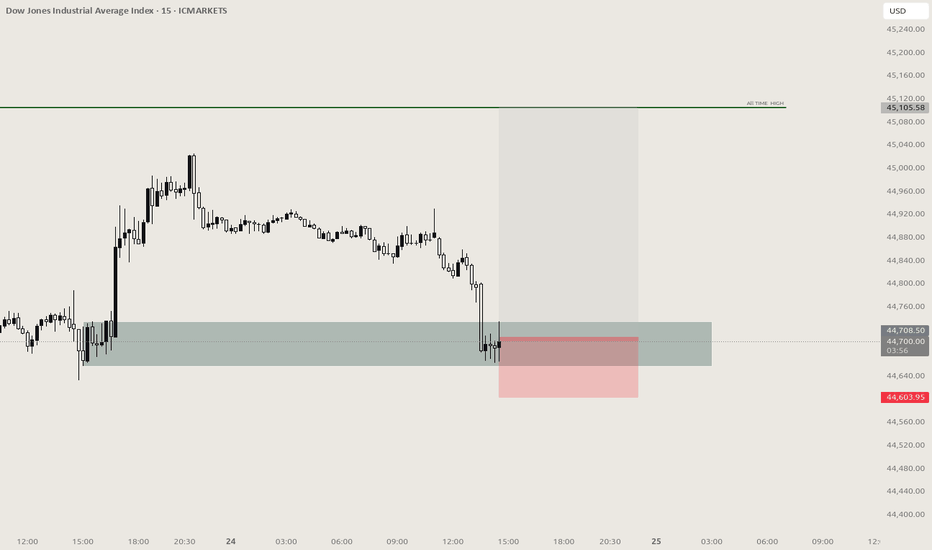
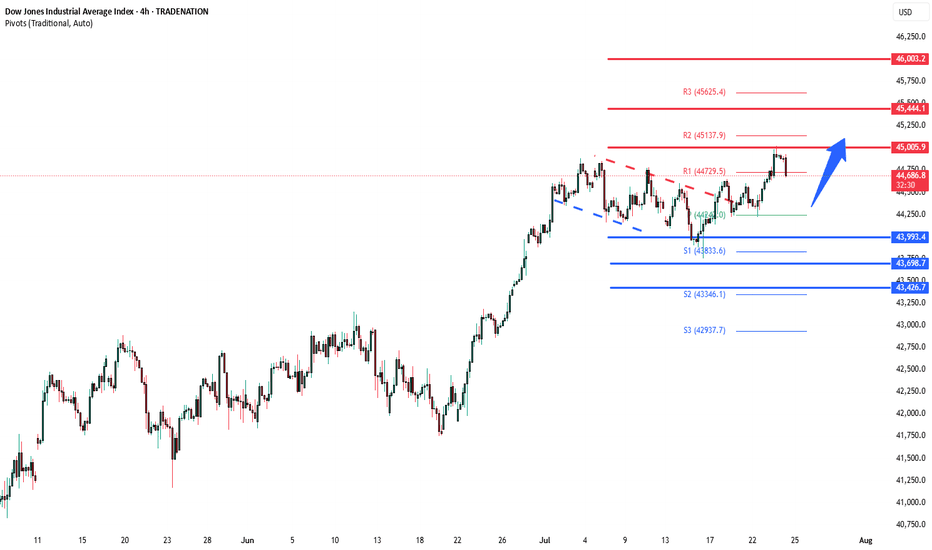
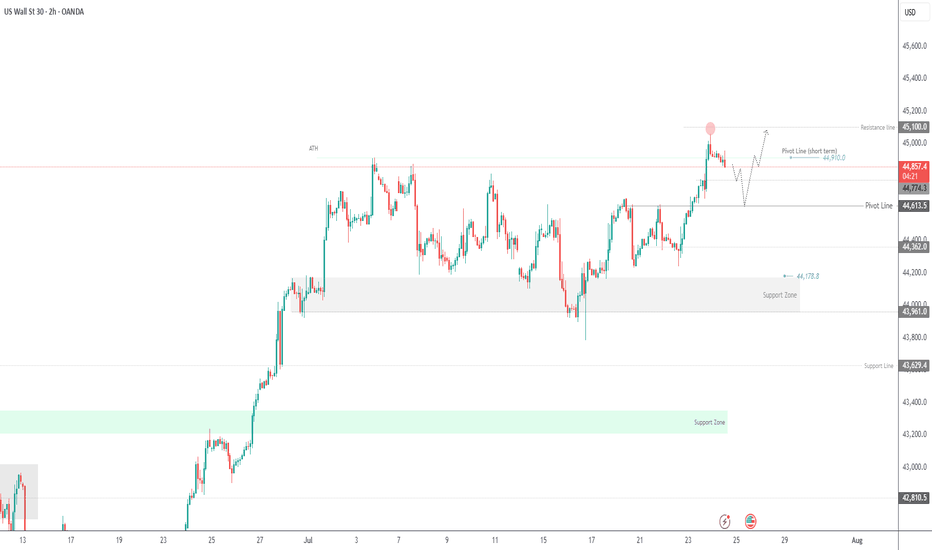
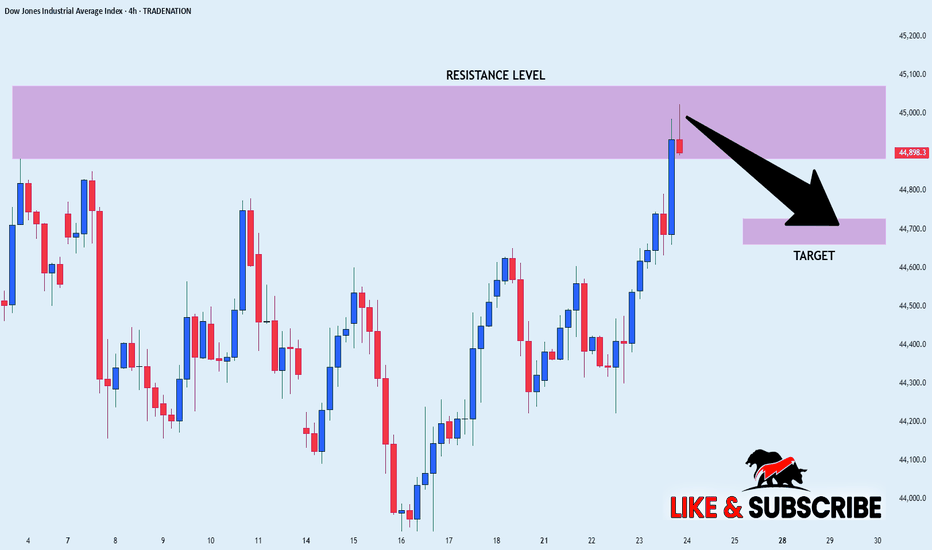
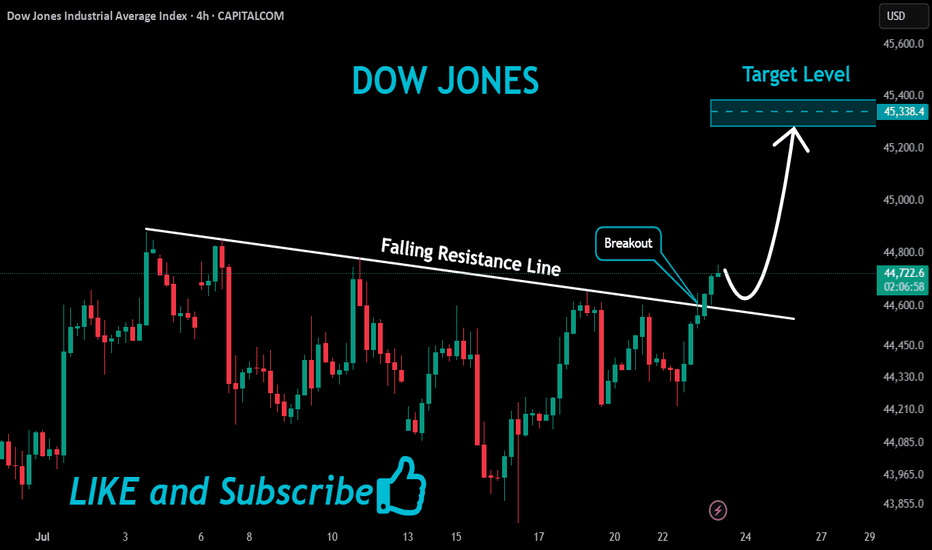
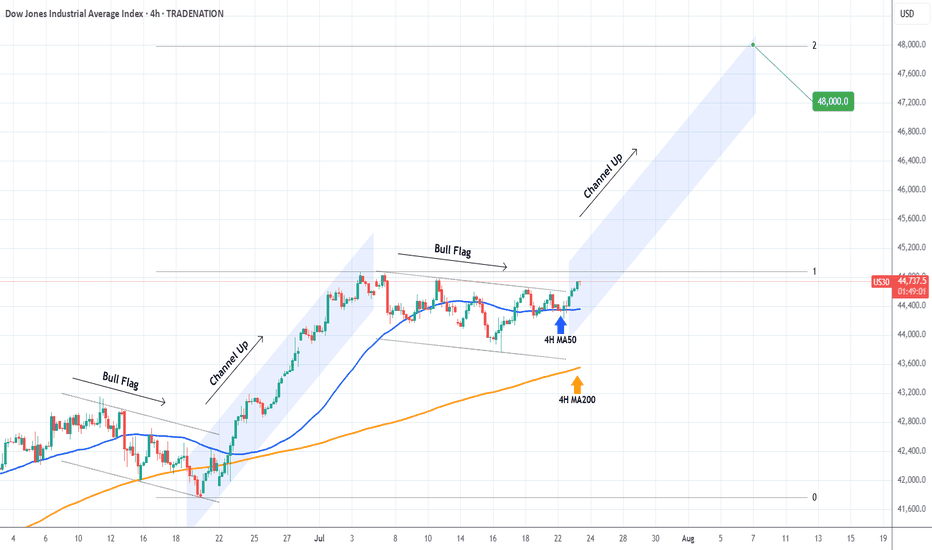
US30 Will Go Up From Support! Buy!
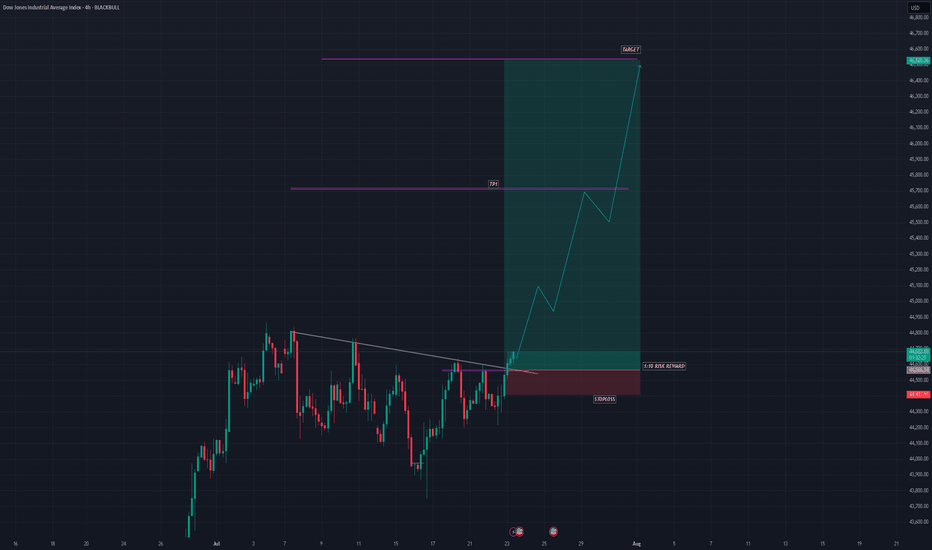
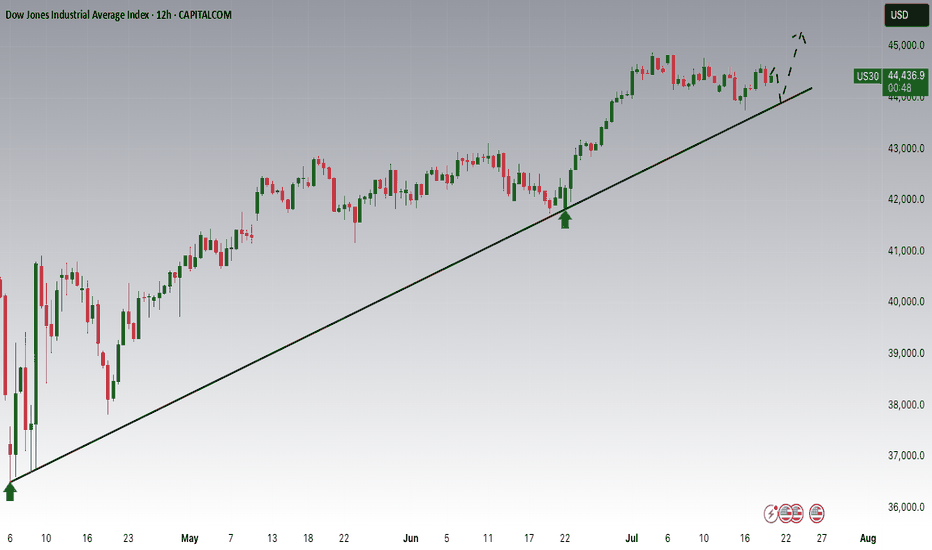
Take a look at our analysis for US30.
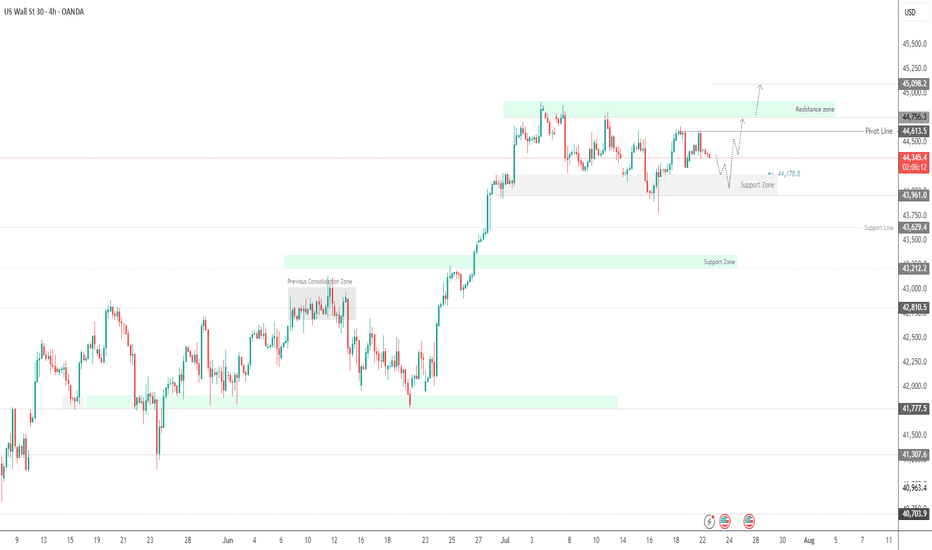
Time Frame: 4h
Current Trend: Bullish
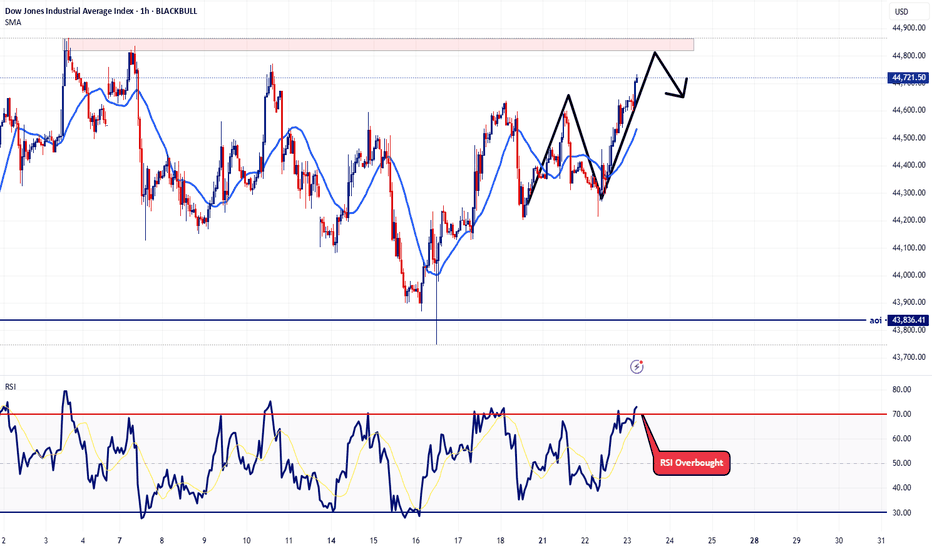
Sentiment: Oversold (based on 7-period RSI)
Forecast: Bullish
The market is approaching a significant support area 44,546.65.
The above-mentioned technicals clearly indicate the dominance of sellers on the market. I recommend shorting the instrument, aiming at 45,015.58 level.
P.S
Overbought describes a period of time where there has been a significant and consistent upward move in price over a period of time without much pullback.
Like and subscribe and comment my ideas if you enjoy them!
US30
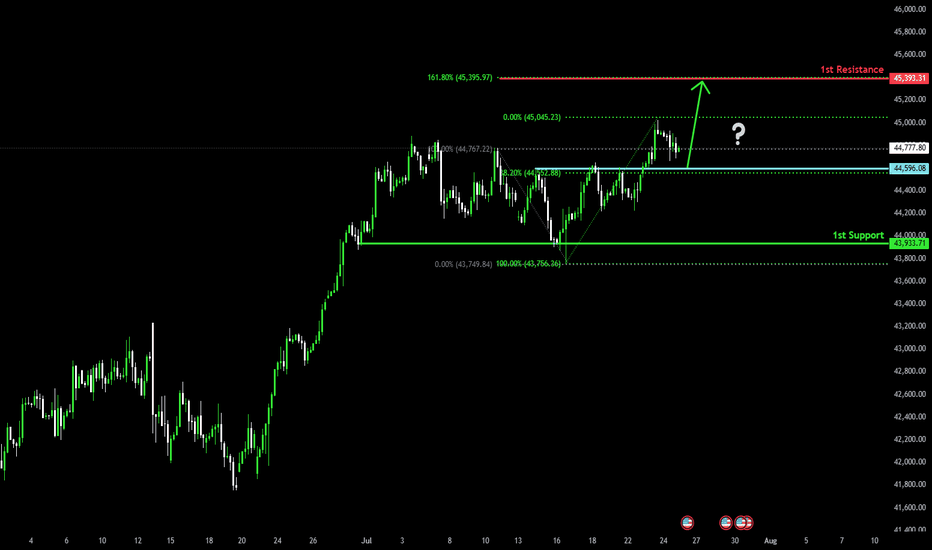
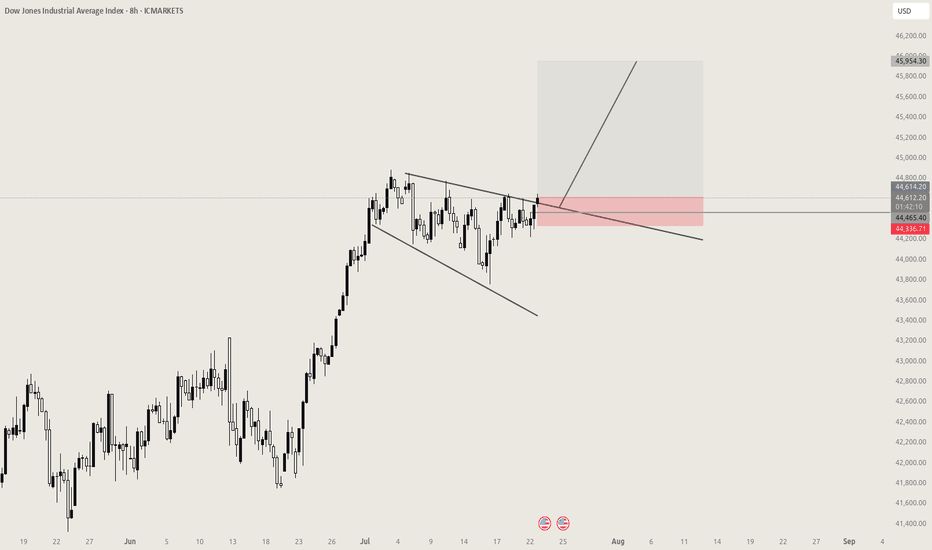
Bullish rise?Dow Jones (US30) has reacted off the pivot and could potentially rise to the pullback resistance.
Pivot: 44,449.91
1st Support: 43,945.23
1st Resistance: 45,014.39
Risk Warning:
Trading Forex and CFDs carries a high level of risk to your capital and you should only trade with money you can afford to lose. Trading Forex and CFDs may not be suitable for all investors, so please ensure that you fully understand the risks involved and seek independent advice if necessary.
Disclaimer:
The above opinions given constitute general market commentary, and do not constitute the opinion or advice of IC Markets or any form of personal or investment advice.
Any opinions, news, research, analyses, prices, other information, or links to third-party sites contained on this website are provided on an "as-is" basis, are intended only to be informative, is not an advice nor a recommendation, nor research, or a record of our trading prices, or an offer of, or solicitation for a transaction in any financial instrument and thus should not be treated as such. The information provided does not involve any specific investment objectives, financial situation and needs of any specific person who may receive it. Please be aware, that past performance is not a reliable indicator of future performance and/or results. Past Performance or Forward-looking scenarios based upon the reasonable beliefs of the third-party provider are not a guarantee of future performance. Actual results may differ materially from those anticipated in forward-looking or past performance statements. IC Markets makes no representation or warranty and assumes no liability as to the accuracy or completeness of the information provided, nor any loss arising from any investment based on a recommendation, forecast or any information supplied by any third-party.
"US30/DJ30" Indices CFD Market Bearish Heist Plan🌟Hi! Hola! Ola! Bonjour! Hallo!🌟
Dear Money Makers & Robbers, 🤑 💰🐱👤🐱🏍
Based on 🔥Thief Trading style technical and fundamental analysis🔥, here is our master plan to heist the "US30/DJ30" Indices CFD Market. Please adhere to the strategy I've outlined in the chart, which emphasizes short entry. Our aim is the high-risk Green Zone. Risky level, oversold market, consolidation, trend reversal, trap at the level where traders and bullish thieves are getting stronger. 🏆💸Book Profits Be wealthy and safe trade.💪🏆🎉
Entry 📈 : "The heist is on! Wait for the breakout (44,000.0) then make your move - Bearish profits await!"
however I advise placing Sell Stop Orders below the breakout MA or Place Sell limit orders within a 15 or 30 minute timeframe. Entry from the most recent or closest low or high level should be in retest.
Stop Loss 🛑: Thief SL placed at 44,600.0 (swing Trade Basis) Using the 4H period, the recent / swing high or low level.
SL is based on your risk of the trade, lot size and how many multiple orders you have to take.
Target 🎯: 43,000.0 (or) Escape Before the Target
🧲Scalpers, take note 👀 : only scalp on the Short side. If you have a lot of money, you can go straight away; if not, you can join swing traders and carry out the robbery plan. Use trailing SL to safeguard your money 💰.
📰🗞️Fundamental, Macro, COT, Sentimental Outlook:
"US30/DJ30" Indices CFD Market is currently experiencing a Bearish trend., driven by several key factors.
⚪Fundamental Analysis
The US30 index is influenced by the overall performance of the US economy, including GDP growth rate, inflation, and interest rates. Currently, the US economy is experiencing a moderate growth rate, with a slight increase in inflation.
🔴Macroeconomic Analysis
The Federal Reserve has maintained a hawkish stance, with interest rates expected to remain high in the short term. This has led to a strengthening of the US dollar, which may impact the US30 index.
🟢COT Data Analysis
The Commitments of Traders (COT) report shows that commercial traders are net short, while non-commercial traders are net long. This indicates a potential trend reversal.
🟡Sentimental Analysis
Market sentiment is slightly bearish, with 55% of traders holding short positions.
🟤Positioning Data Analysis
Institutional traders are holding short positions, while corporate traders are holding long positions. Banks are maintaining a bearish stance.
🔵Market Sentiment
- Institutional Traders: 60% bearish, 40% bullish
- Hedge Funds: 70% bearish, 30% bullish
- Retail Traders: 55% bullish, 45% bearish
🟣Overall Outlook
The US30 index is expected to remain volatile in the short term, with a slight bearish bias due to the hawkish stance of the Federal Reserve. However, the index's movement will largely depend on the overall performance of the US economy and global economic trends.
⚠️Trading Alert : News Releases and Position Management 📰 🗞️ 🚫🚏
As a reminder, news releases can have a significant impact on market prices and volatility. To minimize potential losses and protect your running positions,
we recommend the following:
Avoid taking new trades during news releases
Use trailing stop-loss orders to protect your running positions and lock in profits
📌Please note that this is a general analysis and not personalized investment advice. It's essential to consider your own risk tolerance and market analysis before making any investment decisions.
📌Keep in mind that these factors can change rapidly, and it's essential to stay up-to-date with market developments and adjust your analysis accordingly.
💖Supporting our robbery plan will enable us to effortlessly make and steal money 💰💵 Tell your friends, Colleagues and family to follow, like, and share. Boost the strength of our robbery team. Every day in this market make money with ease by using the Thief Trading Style.🏆💪🤝❤️🎉🚀
I'll see you soon with another heist plan, so stay tuned 🤑🐱👤🤗🤩
US30 Key Levels: Breakout or Breakdown Ahead?US30 at a Crossroads: Will Coca-Cola Earnings Drive a Breakout or Breakdown?
📊 US30 Technical Analysis
The price has broken below the pivot line at 44,404, signaling potential bearish continuation. As long as it remains below this level, we can expect further downside.
🔻 Bearish Scenario:
If price stays below 44,404, the next target is 44,270.
A confirmed 4H close below 44,270 could accelerate the decline toward 43,910 and 43,763.
The descending channel structure suggests continued bearish movement unless a strong reversal occurs.
🔹 Bullish Scenario (Earnings Impact):
If price stabilizes above 44,404, driven by a positive reaction to Coca-Cola’s earnings, we may see a continuation toward 44,575 and 44,756.
A breakout above 44,926 would confirm a stronger bullish trend, targeting higher resistance levels.
Key Levels
Pivot Point: 44404
Resistance Levels: 44575, 44756, 44926
Support Levels: 44270, 44070, 43760
📢 Trend Outlook:
Bearish below 44,404 📉
Bullish breakout potential above 44,926 🚀
💬 Do you think US30 will hold 44,404 or break lower? Drop your thoughts in the comments! 👇🔥
BNXUSDT Double Bottom Pattern s Potential 100%-150% GainBNXUSDT has recently shown signs of a promising bullish reversal pattern known as the Double Bottom Pattern, which has garnered significant investor interest. The Double Bottom is a well-known chart pattern that signals a potential reversal of a downtrend, and its presence suggests that the price could soon make a sharp move upward. With strong volume behind this pattern, it indicates that the market sentiment is shifting positively, with more traders entering the market. This could lead to a significant price rally in the coming days or weeks, with potential gains ranging from 100% to 150% or more.
Investors are closely watching BNXUSDT, as this coin has caught attention due to its solid technical setup. The good volume accompanying the pattern is a key signal of confidence in the market, and it increases the likelihood of this breakout becoming a reality. As the market sentiment grows more bullish, traders may see this as a perfect entry point for capturing substantial gains. The combination of solid technicals and growing investor interest positions BNXUSDT as one of the most talked-about crypto pairs for the near future.
Additionally, this pattern reflects a strong level of support that BNXUSDT has established, further validating the potential for a reversal. If the price manages to break above the resistance level, it could trigger a new bullish trend that sees the price move higher. The increase in volume suggests that buyers are ready to take control, and this trend could continue, especially if the broader crypto market shows positive movement. Investors who enter at the right time could benefit from explosive returns as the price looks to retest its previous highs.
As always, it’s important to monitor the broader market conditions, including the performance of Bitcoin and other major altcoins, as they can impact the movements of BNXUSDT. Traders should also keep an eye on key support and resistance levels to make informed decisions. Overall, BNXUSDT presents a compelling opportunity for traders looking for high-reward setups, and with a solid Double Bottom Pattern in play, it could be primed for a major breakout in the near future.
Bearish drop?Dow Jones (US30) is rising towards the pivot and could drop to the 1st support which has been identified as a pullback support.
Pivot: 44,615.69
1st Support: 43,759.97
1st Resistance: 44,991.93
Risk Warning:
Trading Forex and CFDs carries a high level of risk to your capital and you should only trade with money you can afford to lose. Trading Forex and CFDs may not be suitable for all investors, so please ensure that you fully understand the risks involved and seek independent advice if necessary.
Disclaimer:
The above opinions given constitute general market commentary, and do not constitute the opinion or advice of IC Markets or any form of personal or investment advice.
Any opinions, news, research, analyses, prices, other information, or links to third-party sites contained on this website are provided on an "as-is" basis, are intended only to be informative, is not an advice nor a recommendation, nor research, or a record of our trading prices, or an offer of, or solicitation for a transaction in any financial instrument and thus should not be treated as such. The information provided does not involve any specific investment objectives, financial situation and needs of any specific person who may receive it. Please be aware, that past performance is not a reliable indicator of future performance and/or results. Past Performance or Forward-looking scenarios based upon the reasonable beliefs of the third-party provider are not a guarantee of future performance. Actual results may differ materially from those anticipated in forward-looking or past performance statements. IC Markets makes no representation or warranty and assumes no liability as to the accuracy or completeness of the information provided, nor any loss arising from any investment based on a recommendation, forecast or any information supplied by any third-party.
US30/DJ30 "Dow Jones Industrial Average" Indices Heist Plan🌟Hi! Hola! Ola! Bonjour! Hallo!🌟
Dear Money Makers & Robbers, 🤑 💰
Based on 🔥Thief Trading style technical and fundamental analysis🔥, here is our master plan to heist the US30 / DJ30 "Dow Jones Industrial Average" Indices market. Please adhere to the strategy I've outlined in the chart, which emphasizes long entry and short entry. 🏆💸Be wealthy and safe trade.💪🏆🎉
Entry 📈 :
"The loot's within reach! Wait for the breakout, then grab your share - whether you're a Bullish thief or a Bearish bandit!"
Buy entry above 44,660.0
Sell Entry below 43,800.0
Stop Loss 🛑:
Thief SL placed at 44,100.0 (swing Trade) for Bullish Trade
Thief SL placed at 44,100.0 (swing Trade) for Bearish Trade
Using the 2H period, the recent / nearest low or high level.
SL is based on your risk of the trade, lot size and how many multiple orders you have to take.
Target 🎯:
-Bullish Robbers TP 46,200.0 (or) Escape Before the Target
-Bearish Robbers TP 42,600.0 (or) Escape Before the Target
📰🗞️Fundamental, Macro, COT, Sentimental Outlook:
US30 / DJ30 "Dow Jones Industrial Average" Indices market is currently experiencing a Neutral trend (there is a higher chance for Bullish)., driven by several key factors.
🟣 Fundamental Analysis
- Earnings Growth: The Dow Jones 30 (DJ30) companies have reported strong earnings growth, with an average increase of 10% in the last quarter.
- Dividend Yield: The DJ30 has a dividend yield of 2.1%, which is relatively attractive compared to other asset classes.
- Valuation: The DJ30 is trading at a price-to-earnings (P/E) ratio of 18.5, which is slightly above its historical average.
⚪ Macro Analysis
- Interest Rates: The US Federal Reserve has kept interest rates steady, which is positive for equities.
- Inflation: Inflation remains under control, with the Consumer Price Index (CPI) increasing by 2.3% in the last year.
- GDP Growth: The US GDP growth rate is expected to slow down to 2.1% in 2023, which is still positive for equities.
🔴 Sentimental Analysis
- Trader Sentiment: 55% of traders are bullish on DJ30, while 30% are bearish and 15% are neutral.
- Investor Sentiment: The AAII Investor Sentiment Survey shows that 44.5% of investors are bullish, while 24.5% are bearish.
- Hedge Fund Sentiment: Hedge funds have increased their long positions in DJ30, with a net long exposure of 25%.
🟠 COT Analysis
- Non-Commercial Traders: Net long 35,019 contracts (Increase of 5,011 contracts from last week)
- Commercial Traders: Net short 25,011 contracts (Decrease of 2,011 contracts from last week)
- Leverage: Average leverage used by traders is 8:1
🟡 Institutional Traders
- Goldman Sachs: Net long 20,109 contracts (Increase of 3,011 contracts from last week)
- Morgan Stanley: Net long 15,011 contracts (Decrease of 1,011 contracts from last week)
- JPMorgan Chase: Net long 18,011 contracts (Increase of 2,011 contracts from last week)
🟢 Hedge Funds
- Bridgewater Associates: Net long 30,109 contracts (Increase of 5,011 contracts from last week)
- BlackRock: Net long 25,011 contracts (Decrease of 2,011 contracts from last week)
- Vanguard: Net long 20,011 contracts (Increase of 3,011 contracts from last week)
🟤 Overall Outlook
Based on the analysis, the DJ30 (US30) is expected to move in a bullish trend, with a 60% chance of an uptrend and a 30% chance of a downtrend. The remaining 10% chance is for a neutral trend.
⚠️Trading Alert : News Releases and Position Management 📰 🗞️ 🚫🚏
As a reminder, news releases can have a significant impact on market prices and volatility. To minimize potential losses and protect your running positions,
we recommend the following:
Avoid taking new trades during news releases
Use trailing stop-loss orders to protect your running positions and lock in profits
📌Please note that this is a general analysis and not personalized investment advice. It's essential to consider your own risk tolerance and market analysis before making any investment decisions.
📌Keep in mind that these factors can change rapidly, and it's essential to stay up-to-date with market developments and adjust your analysis accordingly.
💖Supporting our robbery plan will enable us to effortlessly make and steal money 💰💵 Tell your friends, Colleagues and family to follow, like, and share. Boost the strength of our robbery team. Every day in this market make money with ease by using the Thief Trading Style.🏆💪🤝❤️🎉🚀
I'll see you soon with another heist plan, so stay tuned 🤗
Potential bearish drop?Dow Jones (US30) has reacted off the pivot which has been identified as a pullback resistance and could drop to the 1st support that lines up with the 50% Fibonacci retracement.
Pivot: 45,056.62
1st Support: 43,298.77
1st Resistance: 46,066.08
Risk Warning:
Trading Forex and CFDs carries a high level of risk to your capital and you should only trade with money you can afford to lose. Trading Forex and CFDs may not be suitable for all investors, so please ensure that you fully understand the risks involved and seek independent advice if necessary.
Disclaimer:
The above opinions given constitute general market commentary, and do not constitute the opinion or advice of IC Markets or any form of personal or investment advice.
Any opinions, news, research, analyses, prices, other information, or links to third-party sites contained on this website are provided on an "as-is" basis, are intended only to be informative, is not an advice nor a recommendation, nor research, or a record of our trading prices, or an offer of, or solicitation for a transaction in any financial instrument and thus should not be treated as such. The information provided does not involve any specific investment objectives, financial situation and needs of any specific person who may receive it. Please be aware, that past performance is not a reliable indicator of future performance and/or results. Past Performance or Forward-looking scenarios based upon the reasonable beliefs of the third-party provider are not a guarantee of future performance. Actual results may differ materially from those anticipated in forward-looking or past performance statements. IC Markets makes no representation or warranty and assumes no liability as to the accuracy or completeness of the information provided, nor any loss arising from any investment based on a recommendation, forecast or any information supplied by any third-party.
XAUUSD Analysis Retest, and Target of 3000XAUUSD, which represents the price of gold (XAU) against the US dollar (USD), is currently trading at 2860. The target price is set at 3000, indicating a bullish outlook. The market is following the support and resistance pattern, a common technical analysis method. Currently, a small retesting phase is occurring, where the price is momentarily pulling back before resuming its upward trend. This retest is a natural market movement that helps confirm the breakout strength. If the support holds, buyers will likely push the price toward the 3000 level. The psychological resistance at 3000 might cause some fluctuations. However, if momentum remains strong, the price could surpass this level. Traders should monitor volume and market sentiment for further confirmation. Proper risk management is crucial, as unexpected reversals can occur.
US30 TRADE IDEA: SHORT | SELL (10/08)Price has been bullish overall. While it has been overall bullish - price hasn’t broken from its consolidation, therefore in the meanwhile we’ll take advantage of the situation. Price has broken down on the 4H TF, so we’re looking for an optimal entry. Although I have marked out FVG - I believe the uppermost order block is a great place to enter from.
RR 1 : 2.69
RR 2 : 2.95
RR 3 : 4.82
N.B.: This is not financial advice. Trade safely and with caution.
Gold ATH to $2,912?!We are currently seeing a re-distribution schematic play out on Gold ahead of its sell off. Re-distribution schematics normally take place in between Wave 3 high, Wave 4 low & Wave 5 high. This sell off schematic normally builds up within a 'Flat Correction' channel which traps in early sellers and lead buyers. This is why it is a hard pattern to recognise.
Falling towards pullback support?Dow Jones (US30) is falling towards the pivot and could bounce to the 1st resistance which has been identified as a pullback resistance.
Pivot: 44,276.40
1st Support: 43,763.49
1st Resistance: 44,991.93
Risk Warning:
Trading Forex and CFDs carries a high level of risk to your capital and you should only trade with money you can afford to lose. Trading Forex and CFDs may not be suitable for all investors, so please ensure that you fully understand the risks involved and seek independent advice if necessary.
Disclaimer:
The above opinions given constitute general market commentary, and do not constitute the opinion or advice of IC Markets or any form of personal or investment advice.
Any opinions, news, research, analyses, prices, other information, or links to third-party sites contained on this website are provided on an "as-is" basis, are intended only to be informative, is not an advice nor a recommendation, nor research, or a record of our trading prices, or an offer of, or solicitation for a transaction in any financial instrument and thus should not be treated as such. The information provided does not involve any specific investment objectives, financial situation and needs of any specific person who may receive it. Please be aware, that past performance is not a reliable indicator of future performance and/or results. Past Performance or Forward-looking scenarios based upon the reasonable beliefs of the third-party provider are not a guarantee of future performance. Actual results may differ materially from those anticipated in forward-looking or past performance statements. IC Markets makes no representation or warranty and assumes no liability as to the accuracy or completeness of the information provided, nor any loss arising from any investment based on a recommendation, forecast or any information supplied by any third-party.
US30 H4 I Bearish Drop Based on the H4 chart, the price is testing our sell entry level at 44,728.54, a pullback resistance. This level is expected to act as a potential reversal point in the bearish setup.
A successful rejection at this resistance could drive prices lower toward our take profit at 44,029.64, where buyers may step in near a previous support level.
The stop loss is placed at 45,433.97, just above the 127.2% Fibonacci extension, allowing room for price fluctuations while ensuring the bearish outlook remains valid.
High Risk Investment Warning
Trading Forex/CFDs on margin carries a high level of risk and may not be suitable for all investors. Leverage can work against you.
Stratos Markets Limited (fxcm.com/uk):
CFDs are complex instruments and come with a high risk of losing money rapidly due to leverage. 63% of retail investor accounts lose money when trading CFDs with this provider. You should consider whether you understand how CFDs work and whether you can afford to take the high risk of losing your money.
Stratos Europe Ltd (fxcm.com/eu):
CFDs are complex instruments and come with a high risk of losing money rapidly due to leverage. 63% of retail investor accounts lose money when trading CFDs with this provider. You should consider whether you understand how CFDs work and whether you can afford to take the high risk of losing your money.
Stratos Trading Pty. Limited (fxcm.com/au):
Trading FX/CFDs carries significant risks. FXCM AU (AFSL 309763), please read the Financial Services Guide, Product Disclosure Statement, Target Market Determination and Terms of Business at fxcm.com/au
Stratos Global LLC (fxcm.com/markets):
Losses can exceed deposits.
Please be advised that the information presented on TradingView is provided to FXCM (‘Company’, ‘we’) by a third-party provider (‘TFA Global Pte Ltd’). Please be reminded that you are solely responsible for the trading decisions on your account. There is a very high degree of risk involved in trading. Any information and/or content is intended entirely for research, educational and informational purposes only and does not constitute investment or consultation advice or investment strategy. The information is not tailored to the investment needs of any specific person and therefore does not involve a consideration of any of the investment objectives, financial situation or needs of any viewer that may receive it. Kindly also note that past performance is not a reliable indicator of future results. Actual results may differ materially from those anticipated in forward-looking or past performance statements. We assume no liability as to the accuracy or completeness of any of the information and/or content provided herein and the Company cannot be held responsible for any omission, mistake nor for any loss or damage including without limitation to any loss of profit which may arise from reliance on any information supplied by TFA Global Pte Ltd.
The speaker(s) is neither an employee, agent nor representative of FXCM and is therefore acting independently. The opinions given are their own, constitute general market commentary, and do not constitute the opinion or advice of FXCM or any form of personal or investment advice. FXCM neither endorses nor guarantees offerings of third-party speakers, nor is FXCM responsible for the content, veracity or opinions of third-party speakers, presenters or participants.
NFP Feb 25 - US30 NFP Trading Plan Feb 2025.
Weaker NFP data with higher UNEMPLOYMENT CLAIMS (Bullish)
Higher NFP data with Lower UNEMPLOYMENT CLAIMS (Bearish)
Weaker NFP data with Neutral UNEMPLOYMENT CLAIMS (Choppy)
NFP - Forecast 169K vs Previous 256K
Unemployment Claims - Forecast 4.1% vs Previous 4.1%
Here's the tricky Part. If data comes out as expected (NFP 169K - UEC 4.1%) thats Bullish, but a choppy market up & down until market finds a valid support/trend.
Plan Of Action.
Wait 5 - 15 min after data release.
Identify the S&R zones. Wait for Break or Retest.
Wait for confirmation (Candle close/Volume Break/Retest).
Execute with Proper Risk Management.
STICK TO PLAN OF ACTION!!!
Support & Resistence
Resistence - 44725 - 44750
Support - 44525 -44500
Technicals
Monitor DXY for a weaker Dollar. Currently on the 4hr DXY chart we got a H&S Pattern with MA20 downside cross MA50 and RSI in sell area below 50.
US30 we inverted H&S Pattern with MA20 trading close to MA50 for upside cross and RSI in Buy area above 50.
US30 Technical Outlook: Bullish Momentum Holds Above 44410US30 Technical Analysis
The price maintains bullish momentum as it has already stabilized above the pivot line at 44410.
As long as it trades above 44410, the price is expected to push higher toward 44620 and 44760.
However, if a 1-hour or 4-hour candle closes below 44410, a bearish move is likely, with potential targets at 44250 and 44075.
Key Levels:
Pivot Point: 44410
Resistance Levels: 44620, 44760, 44920
Support Levels: 44260, 44150, 44075
Trend Outlook:
Bullish while above 44410
Bearish below 44410
EURNZD Analysis , Support Bounce and Bullish PotentialEURNZD is currently trading at 1.83300, with a target price of 1.89000. This suggests a potential upward movement of 500+ pips. The price is bouncing off a strong support level, indicating a possible bullish reversal. The support and resistance pattern highlights key price zones where buying and selling pressure increase. A successful bounce from support strengthens the bullish outlook. Traders anticipate the price moving towards the next resistance level at 1.89000. Confirmation through candlestick patterns and volume analysis is essential. Risk management should include a stop-loss below the support level. Fundamental factors like interest rate decisions can impact price action. Monitoring market sentiment and economic news is crucial for trade execution.
US30 H8 - Short SignalUS30 H8
We are yet again approaching that key psychological price level, 45,000 coming into play. We are very close currently, but alerts have been set. Last time this setup came into this 45,000 territory, we sold off an attractive 5R.
Looking to see if this setup can offer something similar again, we would love to see price trade closer to 44,000 this time round.