US30 / DJ30 / DJI Market Money Heist Plan on Bullish SideMy Dear Robbers / Money Makers & Newbies,
This is our master plan to Heist US30 / DJ30 / DJI Market based on Thief Trading style Technical Analysis.. kindly please follow the plan I have mentioned in the chart focus on Long entry. Our target is Red Zone that is High risk Dangerous level, market is overbought / Consolidation / Trend Reversal at the level Bearish Robbers / Traders gain the strength. Be safe and be careful and Be rich.
Note: If you've got a lot of money you can get out right away otherwise you can join with a swing trade robbers and continue the heist plan, Use Trailing SL to protect our money.
Entry : Can be taken Anywhere, What I suggest you to Place Buy Limit Orders in 15mins Timeframe Recent / Nearest Swing Low
Stop Loss : Recent Swing Low using 2h timeframe
Warning : Fundamental Analysis comes against our robbery plan. our plan will be ruined smash the Stop Loss. Don't Enter the market at the news update.
Loot and escape on the target 🎯 Swing Traders Plz Book the partial sum of money and wait for next breakout of dynamic level / Order block, Once it is cleared we can continue our heist plan to next new target.
Support our Robbery plan we can easily make money & take money 💰💵 Follow, Like & Share with your friends and Lovers. Make our Robbery Team Very Strong Join Ur hands with US. Loot Everything in this market everyday make money easily with Thief Trading Style.
US30

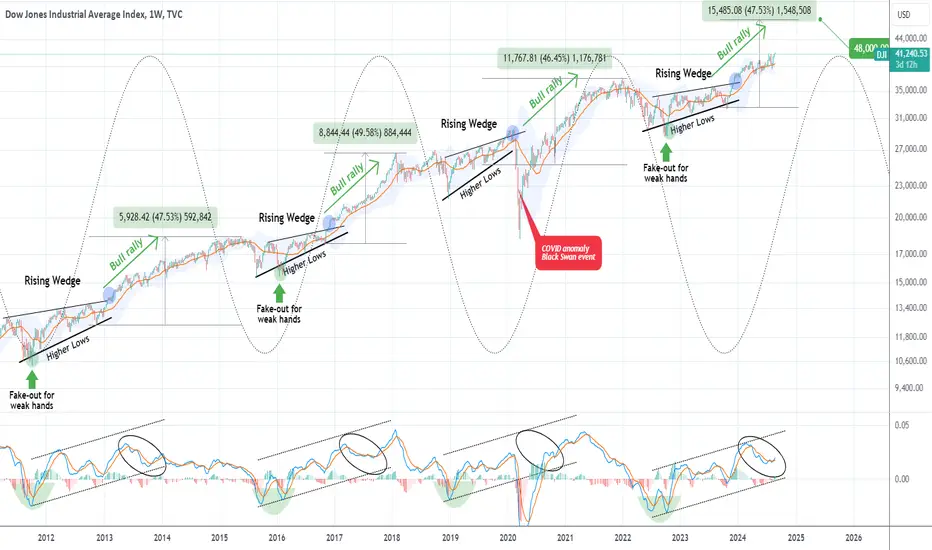
DOW JONES The pattern that never failed is now targeting 48000Dow Jones (DJI) gave us the best bullish break-out signal of the year 8 months ago (December 13 2023, see chart below), as our buy entry at 36577 is very close to hitting our 42900 Target:
At that time we made a clear point why that rally 'shouldn't surprise you' and now you see why. This 1W time-frame chart shows the cyclical behavior of the index, which peaks (Sine Wave top) then pulls back and starts forming a Rising Wedge (Sine Wave bottom) and when it breaks above the Rising Wedge, is where it flashed the bullish break-out signal we got back in December.
As you can see it then starts a gradual rise on the BB20 and completes the Cycle again (Sine Wave top) after roughly a +47% rally. The title mentions that this pattern 'never failed', in practice it only broke during the COVID flash crash, which is a non-technical event than occurs once every 100 years. As you can see even the 1W MACD sequences between the cyclical patterns are identical.
As a result, our Target towards the Sine Wave peak is 48000.
-------------------------------------------------------------------------------
** Please LIKE 👍, FOLLOW ✅, SHARE 🙌 and COMMENT ✍ if you enjoy this idea! Also share your ideas and charts in the comments section below! This is best way to keep it relevant, support us, keep the content here free and allow the idea to reach as many people as possible. **
-------------------------------------------------------------------------------
💸💸💸💸💸💸
👇 👇 👇 👇 👇 👇
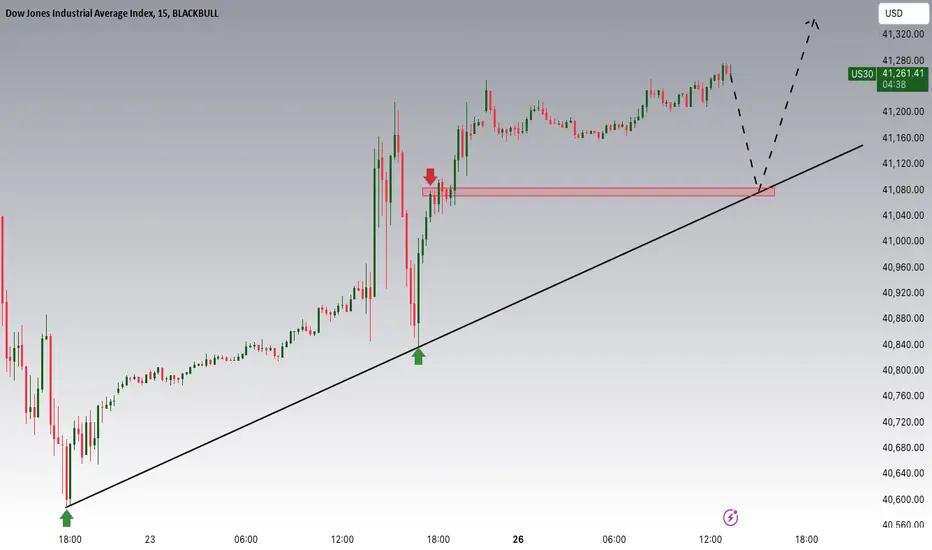
Dow Jones Potential UpsidesHey Traders, in today's trading session we are monitoring US30 for a buying opportunity around 41000 zone, Dow Jones is trading in an uptrend and currently is in a correction phase in which it is approaching the trend at 41000 support and resistance area.
Trade safe, Joe.
Prepare to short US30 - read belowTeam, I am preparing to short US30 once the price pull down toward 41165, then I would set stop loss at 41260 with target at 40930-40876
Option 2 - If the US continue uptrend, wait until it hit 41230 ranges, then SHORT, with stop loss at 41285, while target at 41115, then 40930.
DYOR

DJI 8/26~30 LONG Forecast
1D Chart / LONG
Technical Grounds
-NV > +250M
-TV Strong buy
-LinReg Pearson <0.95
-Pivots HL still Long-Green
-LinReg > 90 degrees (uptrend)
-Reverse Head & Shoulders Formation
-NV shows a declination trend of negative bars
-Price crossed up SMA100, SMA20 & LinReg Mid Line
-Price crossed up index resistance on past Aug 15th
-Price level far from cyclic ending point of Sep 13th
-POLITICAL FACTOR: Elections coming / +Media Influence
-Fed announcing interest rate cuts (as political influence in elections / investors mindset)
SHIBUSDT / LONG ....

US30/DJ30 Bullish Robbery Plan on Long SideMy Dear Robbers / Traders,
This is our master plan to Heist DOW JONES US3O market based on Thief Trading style Technical Analysis.. kindly please follow the plan I have mentioned in the chart focus on Long entry. Our target is Red Zone that is High risk Dangerous level, market is overbought / Consolidation / Trend Reversal at the level Bearish Robbers / Traders gain the strength. Be safe and be careful and Be rich.
Note: If you've got a lot of money you can get out right away otherwise you can join with a swing trade robbers and continue the heist plan, Use Trailing SL to protect our money.
Stop Loss : Recent Swing Low using 2h timeframe
Warning : Fundamental Analysis comes against our robbery plan. our plan will be ruined smash the Stop Loss. Don't Enter the market at the news update.
Loot and escape on the target 🎯 Swing Traders Plz Book the partial sum of money and wait for next breakout of dynamic level / Order block, Once it is cleared we can continue our heist plan to next new target.
Support our Robbery plan we can easily make money & take money 💰💵 Follow, Like & Share with your friends and Lovers. Make our Robbery Team Very Strong Join Ur hands with US. Loot Everything in this market everyday make money easily with Thief Trading Style.

Dow Jones Index (US30): New All Time High Soon?!
US30 may update the all time high soon.
The market closed, testing a major daily structure resistance
based on a current all time high.
A bullish breakout of the underlined blue area will give us a strong bullish signal.
A bullish continuation will be expected at least to 42000.
❤️Please, support my work with like, thank you!❤️

US30 Bearish trend continuesPrice still hasn't been able to close above 40.970 and continues to reject.
The lower time frames confirm bearish candle patterns.
Looking to see yesterday's low taken out before the bearish trend continues.

Don't miss the great SEE Opportunity in US30The chart predicts a bearish reversal from the identified selling zone near 41,000, with potential targets around 40,820 and 40,780. The arrows indicate the possibility of a downtrend following the price's interaction with the selling zone.
This analysis suggests that a short position might be considered if the price shows rejection in the selling zone. However, monitoring the market closely for confirmation signals before executing any trades is always important.

PREPARE TO SHORT THE US30 at 40915 - wait for confirmationI am waiting for the confirmation - Current market price at 40928, im waiting for price drop down to 40915. My target will be at 41069, target 1 at 40756, and target 2 at 40612. Please note: please wait for the FED speech after 5-10 minutes. It would give more clear direction on the markets trend.
If the price reach above 41070, then we would wait for to short the market at 41235-45 (with stop loss at 41285, while target would be around 40990 and 40867

Dow30 - US30 Faces DownturnBLACKBULL:US30 has returned to a crucial resistance zone, which aligns with a bearish technical setup. After the recent decline, this move back to the resistance suggests that a further drop may be imminent, especially if the index fails to break above this zone. The pattern indicates that TVC:DJI could start its downward trend again following a retest of this level, where sellers are likely to re-enter the market.
Fundamentally, the rising unemployment claims in the U.S. have heightened fears of a recession. With more individuals out of work, consumer spending could slow down, which negatively impacts corporate earnings and the broader economy. This situation could exert additional downward pressure on the Dow Jones, making the possibility of a significant decline more likely as investors brace for potential economic contraction.

US30 Market breadth EMA50 [INVESTIC]
Introducing the 50-day Exponential Moving Average (EMA) Market Breadth for the Dow Jones Industrial Average (DJIA). This tool is designed for traders who want to assess the market’s short- to mid-term momentum with precision. By tracking how many of the 30 Dow Jones stocks are trading above their 50-day EMA, the indicator gives a clear view of market strength or weakness over a moderate timeframe.
Traders may use the indicator to identify and confirm the market's medium-term trends. It strikes a balance between the sensitivity of shorter-term indicators like the 20-day EMA and the long-term perspective of the 200-day EMA. Displayed as a histogram ranging from 0 to 30, this indicator provides a quick and effective way to see how many Dow Jones stocks are maintaining their trends over this mid-range period.
🔶Usage
The 50-day EMA Market Breadth is incredibly versatile, catering to different trading styles. For example:
Intraday Trading:
While the 50-day EMA is more commonly associated with swing or mid-term trading, intraday traders can still use this indicator to confirm the broader market trend, which is crucial for trading with confidence throughout the day.
If the majority of stocks are above their 50-day EMA, it suggests strong underlying momentum. Use this information to support your intraday trades in the direction of the trend. For example, if the histogram shows 20 or more stocks above the 50-day EMA, you might prioritize long positions, knowing that the overall market sentiment is positive. Conversely, if the histogram is low, it may be better to focus on short positions or be more cautious with longs.
Swing Trading:
For swing traders, the 50-day EMA Market Breadth Histogram is a key tool for timing entries and exits within the market's medium-term trends.
You can monitor the histogram regularly to gauge whether the market is supporting your swing trades. If you notice the histogram starting to decline, consider tightening your stop losses or scaling out of positions, as this may signal weakening momentum. Additionally, use the histogram to confirm breakout trades or to stay in trades that are running strong, ensuring that you are aligned with the market’s mid-term direction.
Longer-Term Trading:
Long-term traders can leverage the Market Breadth to gain insights into the market's medium-term health, helping to fine-tune their long-term strategies.
Use the histogram as a barometer for market strength when making decisions about your long-term portfolio. A consistently high histogram suggests a strong mid-term uptrend, which could reinforce your conviction to hold or add to long-term positions. On the other hand, if you see a sustained decline in the histogram, it may be a signal to reassess your portfolio and consider implementing risk management strategies. The indicator can also help you identify potential market lows, when you see the number of stocks on the histogram goes near bottom.
No matter your trading style, the 50-day EMA Market Breadth Indicator offers a comprehensive view of market momentum. By integrating this tool into your daily, weekly, or monthly analysis, you can make more informed decisions that align with the prevailing market trends.

US30 Market breadth EMA20 [INVESTIC]Introducing our Market Breadth Indicator for the Dow Jones Industrial Average (DJIA), based on the 20-day Exponential Moving Average (EMA). This tool is designed for traders looking to gauge short-term market sentiment and momentum within the Dow. By tracking how many of the 30 Dow Jones stocks are trading above their 20-day EMA, this indicator offers a quick and precise snapshot of the market’s short-term strength or weakness.
Traders can use this shorter-term market breadth indicator to identify emerging trends, confirm the direction of the market, and make more timely trading decisions. The 20-day EMA provides a more responsive view of market conditions compared to the longer days EMA, making it ideal for traders focused on capturing near-term movements. Displayed as a histogram ranging from 0 to 30, the indicator helps you quickly assess how many Dow Jones stocks are in a bullish or bearish stance over the short term.
🔶Usage
The Market Breadth based on the 20-day EMA is perfect for traders of all styles, from those who thrive on fast-paced intraday action to those with a longer-term view. Here’s how you can apply this indicator in different trading scenarios:
Intraday Trading:
Market Breadth is a powerful tool to spot shifts in momentum throughout the trading day. As the market moves, the histogram will quickly reflect changes in the number of stocks trading above their 20-day EMA, helping you identify potential entry or exit points.
As an example, this tool can be use to find short-term lows or peaks. As the histogram rises above the green zone in the session it may indicate increasing buying pressure, suggesting opportunities for quick long positions from the low.
Also it can help spot potential rebound in the near term, for example, a rising number of stocks while the index declines could signal a quick short-term trades.
Swing Trading:
Swing traders can use the Market Breadth to time trades more effectively within short- to medium-term trends. When the histogram is consistently high, it indicates that the majority of Dow stocks are experiencing short-term uptrends, making it a favorable environment to hold onto positions. However, if the histogram starts to drop, it may be an early warning that the trend is losing strength, prompting you to consider exiting or tightening your stop losses. This indicator helps you stay in tune with the market’s short-term direction, optimizing your swing trade entries and exits.
Longer-Term Trading:
While the 20-day EMA is more commonly associated with short-term analysis, it can still be valuable for longer-term traders who want to keep a pulse on shorter-term market movements. By monitoring the Market Breadth over weeks or months, you can spot when the market is reaching its peak or its low on a shorter timescale.
The 20-day EMA Market Breadth is a versatile tool that provides actionable insights across various trading horizons. Whether you’re looking to capture quick intraday moves, time your swing trades with precision, or keep an eye on short-term trends as part of a longer-term strategy, this indicator is designed to enhance your market analysis and trading decisions.

Could price reverse from here?Dow Jones (US30) is rising towards the pivot which acts as a pullback resistance and could revers to the 23.6% Fibonacci support.
Pivot: 41,036.40
1st Support: 40,643.17
1st Resistance: 41,405.66
Risk Warning:
Trading Forex and CFDs carries a high level of risk to your capital and you should only trade with money you can afford to lose. Trading Forex and CFDs may not be suitable for all investors, so please ensure that you fully understand the risks involved and seek independent advice if necessary.
Disclaimer:
The above opinions given constitute general market commentary, and do not constitute the opinion or advice of IC Markets or any form of personal or investment advice.
Any opinions, news, research, analyses, prices, other information, or links to third-party sites contained on this website are provided on an "as-is" basis, are intended only to be informative, is not an advice nor a recommendation, nor research, or a record of our trading prices, or an offer of, or solicitation for a transaction in any financial instrument and thus should not be treated as such. The information provided does not involve any specific investment objectives, financial situation and needs of any specific person who may receive it. Please be aware, that past performance is not a reliable indicator of future performance and/or results. Past Performance or Forward-looking scenarios based upon the reasonable beliefs of the third-party provider are not a guarantee of future performance. Actual results may differ materially from those anticipated in forward-looking or past performance statements. IC Markets makes no representation or warranty and assumes no liability as to the accuracy or completeness of the information provided, nor any loss arising from any investment based on a recommendation, forecast or any information supplied by any third-party.

US30Dow Jones 4-hour time frame analysis
I expect the price to start correcting from this area until the swap zone is determined.
By seeing confirmation in these areas, we can expect price correction.

US30 shortsConfirmations:
1. Bearish 4hr 1hr Structure, 15 min and 5 min chart
2. Liquidity swept in 4hr 886 zone on 1hr
3.15 min institutional candle in 4hr 886 zone
4. Liquidity was taken on 1hr and trend line liquidity trend line target
5. 4hr imbalance as targets
