Market Heist in Progress! US30/DJI Long Trade – Ride or Escape?🔥 "The US30/DJI Heist: Bullish Loot & Escape Before the Trap!" 🔥
🌟 Hi! Hola! Ola! Bonjour! Hallo! Marhaba! 🌟
Dear Money Makers & Market Robbers, 🤑💰💸✈️
Based on the 🔥Thief Trading Style🔥 (technical + fundamental analysis), here’s our master plan to heist the US30/DJI (Dow Jones Industrial Average). Follow the strategy on the chart—long entry is the play! Aim to escape near the high-risk RED Zone (overbought, consolidation, potential reversal). The bears are lurking, so take profits and treat yourself—you’ve earned it! 💪🏆🎉
🚀Entry (The Vault is Open!)
"Swipe the bullish loot at any price!"
For precision, place buy limit orders within 15-30min timeframe (recent swing lows/highs).
Set alerts! Don’t miss the heist.
🛑 Stop Loss (Safety Net)
Thief-style SL at nearest swing low (3H timeframe) → 41,400 (adjust based on risk/lot size).
🏴☠️ Target 🎯: 44,200.00
Bullish momentum is fueling this heist—ride the wave but exit before the trap!
📰 Fundamental Backing (Why This Heist Works)
Macroeconomic trends, COT data, geopolitics, and sentiment align for bullish moves.
Full analysis? Check our bio0 linkk! 👉🔗🌎
⚠️ Trading Alerts (News & Risk Mgmt)
Avoid new trades during high-impact news (volatility = danger).
Use trailing stops to lock profits and dodge sudden reversals.
💥 Boost This Heist!
Hit 👍 (Boost Button) to strengthen our robbery squad!
More heists = More profits—stay tuned for the next steal! 🚀🤑
See you soon, fellow thieves! 🤝🎉
US30

US30 looking for the short on Bearish PAI believe we can expect a pull back down to JuBias: Short-term Bearish (Contingent Setup)
Context: Price is currently trading just below a high-probability supply zone between 44,048 – 44,277. This area aligns with prior highs and liquidity, making it a prime zone to look for a short-term rejection if strong bearish price action (PA) appears on the 4H or Daily timeframes.
We are currently seeing strong bullish momentum on the Weekly, Daily, and H4 candles. Any short positions from this zone must be reactive — not anticipatory. A clear bearish signal (e.g., engulfing, structure break, supply confirmation) is required to consider entry.
Key Zone:
Seek bearish PA between 44,048 – 44,277
Contingency: If price breaks and closes above 44,250 (2024 highs), expect continuation toward 45,000
Short Targets if Rejection Occurs:
Target 1: 43,350
Target 2: 42,500
Extended Target: 41,734 (June Low)
Post-Rejection Bullish Scenario:
If we do get a rejection and targets are met, we will then look for bullish PA in the demand zones (42,500 or 41,700) to consider long setups back toward the 2024 highs and potentially beyond.
Breakout Scenario:
If price breaks and closes above the 44,277 zone early this week, we anticipate the next leg to 45,000 before any meaningful reversal.
At this stage, it’s a waiting game — let price action lead. We don’t predict, we react.ne lows before an

Dollar Bullish Correction To $103 - $105While we expected to see some Dollar upside in Q2, the economy was in such a bad state that the Dollar could not hold its value. Since the start of 2025 the Dollar is down 12% and this is only the beginning.
I believe we will see more downside in the future. But for the coming quarter there is a chance for the Dollar to get some breathing space & recover in the short term. Overall, the trend of the Dollar remains bearish, so what we want to keep an eye on is small pumps (short term recovery) into price zones which will allow us to short the Dollar back down.
I want to see a dip lower towards $96 - $94 before sellers lose bearish momentum. If this move takes place, then we can slowly see buyers step back into the market & start pushing back to the upside. Once price hits our ‘Supply Zone’ of $103 again, it’ll give us a more clear indication of what the Dollar will do next; whether that’s a longer term uptrend or a continuation to the downside.

GOLD - SHORT TO $2,800 (UPDATE)Our original sell bias from $3,347 which I posted live for you all, is now running in deep profits! Market is now down & running 810 PIPS in profit in just 2 days.
We have broken structure to the downside, crossing below our previous 'Wave E' low, indicating & acting as stronger confluence that Gold will carry on down towards our $2,800 target. Huge profits en-route for us all in this free channel.

US30: Local Bearish Bias! Short!
My dear friends,
Today we will analyse GOLD together☺️
The price is near a wide key level
and the pair is approaching a significant decision level of 43,673.57 Therefore, a strong bearish reaction here could determine the next move down.We will watch for a confirmation candle, and then target the next key level of 43,576.88..Recommend Stop-loss is beyond the current level.
❤️Sending you lots of Love and Hugs❤️

DOW JONES Will Keep Growing! Buy!
Hello,Traders!
US30 is trading in an
Uptrend and the index broke
The key horizontal level
Around 43,200 and the
Breakout is confirmed so
We are bullish biased
And we will be expecting a
Further bullish move up
Buy!
Comment and subscribe to help us grow!
Check out other forecasts below too!
Disclosure: I am part of Trade Nation's Influencer program and receive a monthly fee for using their TradingView charts in my analysis.

US 30 Potential longUS30 – Wyckoff Spring Setup for NY Session | Intraday Execution Play
Price rallied in the London session with rising volume and structure breaks —
Now we’re anticipating a classic Wyckoff spring scenario just ahead of NY open.
📍 Key Expectations:
Sweep of intraday support around 43,482
Strong buyer reaction (spring confirmation)
Expansion into the 43,600+ zone — possible 1.5R+ continuation
⚠️ Volume buildup + stop placement below prior structure make this zone ripe for a fakeout → reversal.
I’m watching for a quick flush below the line → wick rejection → engulfing confirmation to trigger longs.
This is a trap trade — smart money baits shorts, I’m betting they get squeezed.
🔫 Entry: On confirmation after spring
📉 Invalidation: Below the spring low
🎯 Target: 43,610 zone and trailing after break of 43,570
Let them walk into the trap. Then pull the trigger.

Dow Jones Retesting 43,020 | Bullish Bias Intact Above 42,810US30 OVERVIEW
Dow Jones Holds Bullish Momentum | Eyes on Retest and Continuation
US30 (Dow Jones) remains under bullish pressure, supported by recent macro developments and improving sentiment.
The price appears to be forming a retest toward 43,020, which could act as a springboard for further upside.
As long as the index trades above 42,810, the bullish trend remains intact, targeting 43,350, and potentially 43,765.
However, a confirmed break below 42,810 would shift the outlook to bearish in the short term.
Resistance Levels: 43,350 → 43,765
Support Levels: 43,020 → 42,810
Previous idea:

Dow Jones (US30) — Bullish Momentum, But a Retest AheadUS30 — Preparing for a Retest Before Higher Push
Subtitle: Technical Outlook — 27 June 2025
📈 Current Market Condition
The US30 index has shown strong bullish momentum, breaking above prior resistance around 43,000 and extending towards 43,500. Price is currently above both the 50 EMA (blue) and 200 EMA (red), reflecting a bullish structure. However, the Stochastic indicator signals overbought conditions, suggesting the index may be due for a pullback or consolidation before attempting to break higher into the 44,500–44,750 resistance zone.
🔑 Key Technical Highlights
Structure: Price broke above consolidation zone 42,750–43,000, retesting higher levels.
50 EMA (blue): Positioned near 42,750, acting as dynamic support.
200 EMA (red): Below at 42,200, major trend support.
Stochastic: Overbought — risk of a short-term correction or sideways move before continuation.
Resistance: Major resistance at 44,500–44,750.
Support: Immediate support at 43,000–43,250, deeper at 42,500.
📝 Trade Plan
Bullish Breakout (Long)
Trigger: Retest and hold of 43,000–43,250 zone with bullish confirmation (e.g. bullish engulfing, hammer).
Target: 44,500 / 44,75
Stop-loss: Below 42,900
Bearish Rejection (Short)
Trigger: Strong rejection from 44,500 with bearish reversal pattern.
Target: 43,250 / 42,750
Stop-loss: Above 44,700
Dip Buy
Trigger: Price tests 42,750 (50 EMA) and shows bullish reversal.
Target: 43,500 / 44,500
Stop-loss: Below 42,500
⚠️ Risk Management Note
US30 is trading in extended conditions, so chasing price here carries risk of getting caught in a pullback. Use staggered entries and adjust position size relative to volatility. Watch out for upcoming macroeconomic releases that could trigger sharp moves.
If you found this analysis valuable, kindly consider boosting and following for more updates.
Disclaimer: This content is intended for educational purposes only and does not constitute financial advice.

Nasdaq100OANDA:NAS100USD
3. And Then price will begin to push down strong. This will happen only if there will be a very strong spike meaning an incredible amount of sells pushing the price down.

DOW JONES INDEX (US30): Consolidation is Over
Dow Jones Index completed a bullish accumulation on a daily.
The price violated a key horizontal resistance cluster and closed above that.
Next goal for bulls is 43790.
❤️Please, support my work with like, thank you!❤️
I am part of Trade Nation's Influencer program and receive a monthly fee for using their TradingView charts in my analysis.

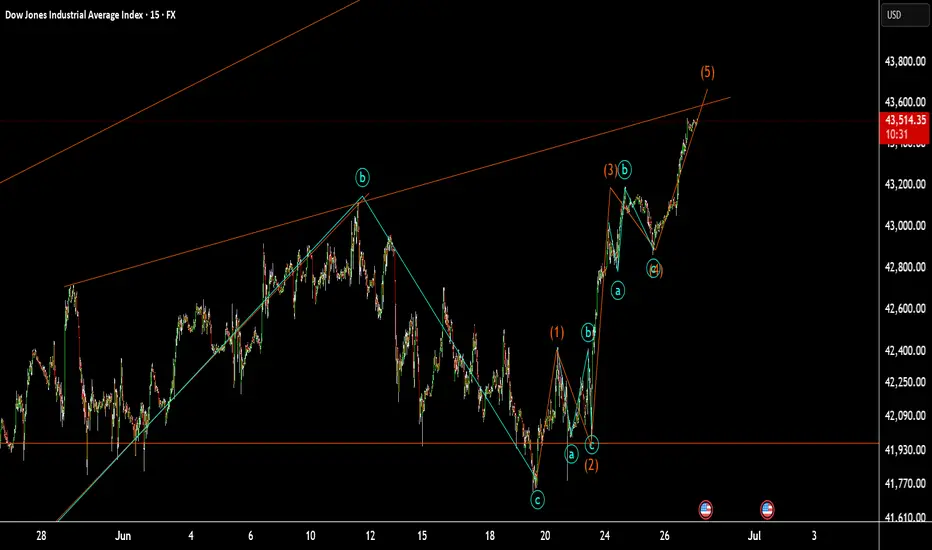
US30 at small resistanceUS30 at small resistance:
as I counter these wave we are in wave 5. it might be goes up to the maim trend Line in previous analysis.
Dollar Index Bearish to $96 (UPDATE)I posted this DXY sell thesis yesterday for you all while price was still at $97.70. Since then sellers have taken out the previous Wave 3 low, creating a new daily low today at $96.90📉
We still have more downside yet to come towards our $96.60 target. So, use this 'DXY Sell Thesis' to help you with your trading, so once you can use this as a confluence to buy inverse correlated markets

US30 - ShortLooking for the Short on US30 final pull back before we see extension to the upside 45,000.

DOW JONES: Technical pullback possible but 43,700 target remainsDow Jones is bullish on its 1D technical outlook (RSI = 62.550, MACD = 276.720, ADX = 11.070), extending the bullish wave of the 1 month Channel Up. This is only the second such wave of this pattern and its first pulled back to the 0.5 Fiboancci retracement level after making a +3.75% rise. It is possible to see such a retrace start either now or tomorrow but on the medium term the bullish target on the 1.236 Fibonacci extension is intact (TP = 43,700).
## If you like our free content follow our profile to get more daily ideas. ##
## Comments and likes are greatly appreciated. ##

DowJones bullish breakout supported at 42240Key Support and Resistance Levels
Resistance Level 1: 43200
Resistance Level 2: 43544
Resistance Level 3: 43900
Support Level 1: 42240
Support Level 2: 41740
Support Level 3: 41280
This communication is for informational purposes only and should not be viewed as any form of recommendation as to a particular course of action or as investment advice. It is not intended as an offer or solicitation for the purchase or sale of any financial instrument or as an official confirmation of any transaction. Opinions, estimates and assumptions expressed herein are made as of the date of this communication and are subject to change without notice. This communication has been prepared based upon information, including market prices, data and other information, believed to be reliable; however, Trade Nation does not warrant its completeness or accuracy. All market prices and market data contained in or attached to this communication are indicative and subject to change without notice.

US30 - Long 43,150Still looking for that 43,150 lets get a test of FVG then on bullish PA above we can plan trade. Stops would go below the order block.

Bullish bounce for the Dow Jones?The price is falling towards the pivot which has been identified as an overlap support and could bounce from this level to our take profit.
Pivot: 42,588.80
1st Support: 42,119.27
1st Resistance: 43,222.33
Risk Warning:
Trading Forex and CFDs carries a high level of risk to your capital and you should only trade with money you can afford to lose. Trading Forex and CFDs may not be suitable for all investors, so please ensure that you fully understand the risks involved and seek independent advice if necessary.
Disclaimer:
The above opinions given constitute general market commentary, and do not constitute the opinion or advice of IC Markets or any form of personal or investment advice.
Any opinions, news, research, analyses, prices, other information, or links to third-party sites contained on this website are provided on an "as-is" basis, are intended only to be informative, is not an advice nor a recommendation, nor research, or a record of our trading prices, or an offer of, or solicitation for a transaction in any financial instrument and thus should not be treated as such. The information provided does not involve any specific investment objectives, financial situation and needs of any specific person who may receive it. Please be aware, that past performance is not a reliable indicator of future performance and/or results. Past Performance or Forward-looking scenarios based upon the reasonable beliefs of the third-party provider are not a guarantee of future performance. Actual results may differ materially from those anticipated in forward-looking or past performance statements. IC Markets makes no representation or warranty and assumes no liability as to the accuracy or completeness of the information provided, nor any loss arising from any investment based on a recommendation, forecast or any information supplied by any third-party.

GOLD - SHORT TO $2,800 (VIDEO ANALYSIS)Confluences👇
⭕️Wave 3 Peaked at Psychological Number of $2,500 (LQ Point).
⭕️Minor Wave 1 & 2 of Major Wave 4 Complete. But Wave 3 Pending.
⭕️Thin Liquidity In The Markets.
⭕️Gold Overbought/DXY Oversold.
✅HUGE 4,700 PIPS (14% ROI) POTENTIAL PROFIT✅

US30 - Entries ActiveAs anticipated got the sweep below then break above our area with a U shape formation. Looking to the upside.
US30 - Final Push before PullbackPotentially another push to upper levels of supply potentially 43,150-43,200. Can see this retest before seeing a potential pull back based off larger time frame.

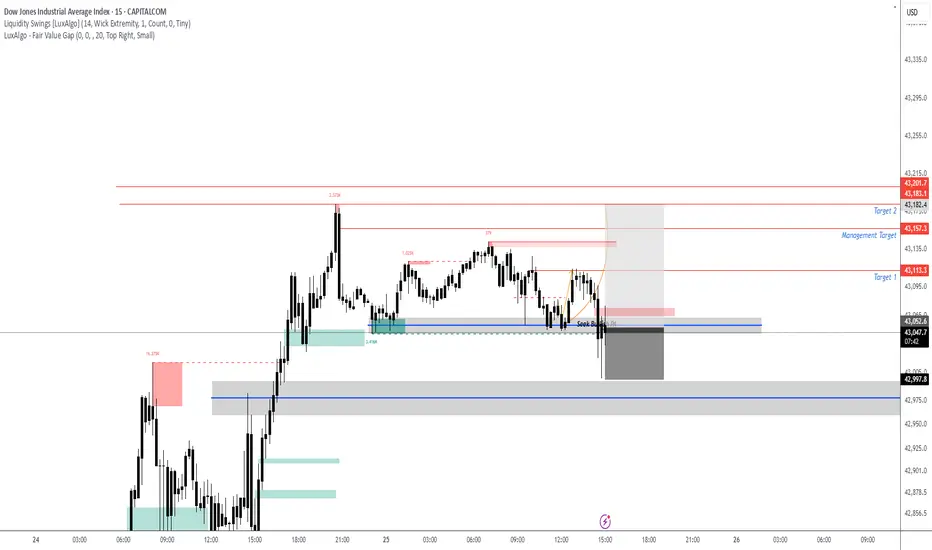
Why I’m Sitting Out: US30 Reaches Critical Range HighI’m currently keeping a close eye on the US30, along with the other major indices 🧐. What stands out the most right now is how overextended this rally has become across the board 📈.
The key concern here is that price has now pushed into a previous external range high, sweeping liquidity resting just above that level 💧. This area is a textbook zone where big money often steps in to offload positions — it’s the perfect place for institutions to find willing counterparties after prior accumulation 📍💼.
Given the aggressive nature of this move and how far price has stretched, I’m extremely hesitant to get involved at this stage 🚫. I have zero interest in buying into a market that’s trading at a premium and sitting at a potential reversal zone ⚠️.
The prudent move here is to wait for a retrace, followed by a bullish break in structure before considering re-entry 🔁📈. Sometimes, the most powerful edge in trading is knowing when not to trade — and for me, today is one of those days.
⚠️ This is not financial advice — just sharing my current perspective on the market.

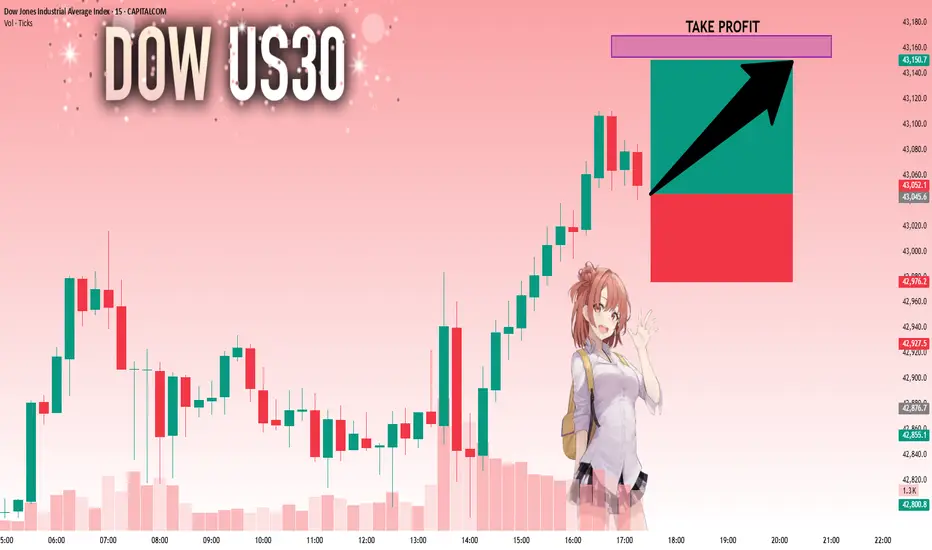
US30: The Market Is Looking Up! Long!
My dear friends,
Today we will analyse US30 together☺️
The price is near a wide key level
and the pair is approaching a significant decision level of 43,045.6 Therefore, a strong bullish reaction here could determine the next move up.We will watch for a confirmation candle, and then target the next key level of 43,152.9.Recommend Stop-loss is beyond the current level.
❤️Sending you lots of Love and Hugs❤️