US30: The Next Big Move? Bullish Breakout or Bearish DropUS30 Intraday Setup
Technical Outlook — 10 June, 2025
Market Context:
The Dow Jones (DJI) is currently consolidating around 42,730, hovering near the "Previous Day High" after several attempts to break higher. Price action is forming a potential ascending triangle or a tight range, suggesting a crucial decision point for the intraday trend. The market is showing indecision at key resistance.
Key Levels & Trade Plan:
Resistance:
Immediate: ~$42,890 - $42,950 (Previous Day High / Upper boundary of consolidation).
Major: ~$43,100 - $43,150.
Support:
Immediate: ~$42,700 - $42,750 (Lower boundary of consolidation / Ascending trendline).
Strong: ~$42,545 - $42,600.
Lower/Previous Day Low: ~$42,280 - $42,390.
Trade Plan:
Bullish Breakout (Long):
Trigger: Clear 1-hour close above $42,950 with good volume, confirming breakout from consolidation/Previous Day High.
Target: $43,100, then $43,150.
Stop Loss: Below breakout level (e.g., $42,850).
Bearish Breakdown (Short):
Trigger: Clear 1-hour close below $42,700 with strong selling volume, breaking the ascending trendline/consolidation.
Target: $42,600, then $42,390.
Stop Loss: Above breakdown level (e.g., $42,780).
Dip Buy (Long):
Trigger: Price holds $42,545 - $42,600 with clear bullish reversal signals (e.g., strong wick, bullish engulfing) on the 1-hour timeframe.
Target: Resistance levels.
Stop Loss: Below the confirmed support (e.g., $42,500).
Risk Management: Always use proper position sizing and set a stop loss.
If you found this analysis valuable, kindly consider boosting and following for more updates.
Disclaimer: This content is intended for educational purposes only and does not constitute financial advice.
US30

US30: The Market Is Looking Down! Short!
My dear friends,
Today we will analyse US30 together☺️
The market is at an inflection zone and price has now reached an area around 42,877.4 where previous reversals or breakouts have occurred.And a price reaction that we are seeing on multiple timeframes here could signal the next move down so we can enter on confirmation, and target the next key level of 42,798.2..Stop-loss is recommended beyond the inflection zone.
❤️Sending you lots of Love and Hugs❤️

DowJones INTRADAY support at 42100Key Support and Resistance Levels
Resistance Level 1: 43190
Resistance Level 2: 43620
Resistance Level 3: 44290
Support Level 1: 42100
Support Level 2: 41420
Support Level 3: 40990
This communication is for informational purposes only and should not be viewed as any form of recommendation as to a particular course of action or as investment advice. It is not intended as an offer or solicitation for the purchase or sale of any financial instrument or as an official confirmation of any transaction. Opinions, estimates and assumptions expressed herein are made as of the date of this communication and are subject to change without notice. This communication has been prepared based upon information, including market prices, data and other information, believed to be reliable; however, Trade Nation does not warrant its completeness or accuracy. All market prices and market data contained in or attached to this communication are indicative and subject to change without notice.

Dow Jones H1 | Overlap support at 50% Fibonacci retracementThe Dow Jones (US30) is falling towards an overlap support and could potentially bounce off this level to climb higher.
Buy entry is at 42,562.05 which is an overlap support that aligns with the 50.0% Fibonacci retracement.
Stop loss is at 42,196.55 which is a level that lies underneath a swing-low support and the 61.8% Fibonacci retracement.
Take profit is at 42,865.41 which is a multi-swing-high resistance.
High Risk Investment Warning
Trading Forex/CFDs on margin carries a high level of risk and may not be suitable for all investors. Leverage can work against you.
Stratos Markets Limited (tradu.com ):
CFDs are complex instruments and come with a high risk of losing money rapidly due to leverage. 63% of retail investor accounts lose money when trading CFDs with this provider. You should consider whether you understand how CFDs work and whether you can afford to take the high risk of losing your money.
Stratos Europe Ltd (tradu.com ):
CFDs are complex instruments and come with a high risk of losing money rapidly due to leverage. 63% of retail investor accounts lose money when trading CFDs with this provider. You should consider whether you understand how CFDs work and whether you can afford to take the high risk of losing your money.
Stratos Global LLC (tradu.com ):
Losses can exceed deposits.
Please be advised that the information presented on TradingView is provided to Tradu (‘Company’, ‘we’) by a third-party provider (‘TFA Global Pte Ltd’). Please be reminded that you are solely responsible for the trading decisions on your account. There is a very high degree of risk involved in trading. Any information and/or content is intended entirely for research, educational and informational purposes only and does not constitute investment or consultation advice or investment strategy. The information is not tailored to the investment needs of any specific person and therefore does not involve a consideration of any of the investment objectives, financial situation or needs of any viewer that may receive it. Kindly also note that past performance is not a reliable indicator of future results. Actual results may differ materially from those anticipated in forward-looking or past performance statements. We assume no liability as to the accuracy or completeness of any of the information and/or content provided herein and the Company cannot be held responsible for any omission, mistake nor for any loss or damage including without limitation to any loss of profit which may arise from reliance on any information supplied by TFA Global Pte Ltd.
The speaker(s) is neither an employee, agent nor representative of Tradu and is therefore acting independently. The opinions given are their own, constitute general market commentary, and do not constitute the opinion or advice of Tradu or any form of personal or investment advice. Tradu neither endorses nor guarantees offerings of third-party speakers, nor is Tradu responsible for the content, veracity or opinions of third-party speakers, presenters or participants.

DOW JONES: Turning sideways for summer. Massive rise afterwards.Dow Jones is bullish on its 1D technical outlook (RSI = 58.389, MACD = 425.040, ADX = 23.083) but 1W is neutral, a natural outcome of the ranged trading within the 1D MA200 and 1D MA50in the last 3 weeks. It is possible to see the index staying sideways until the end of August and then attempt to complete a +39.50% rise from its bottom, like both prior bullish waves did. Regardless of this a test of the Channel Up top trendline, gives us a fair TP = 48,000 for the end of the year.
## If you like our free content follow our profile to get more daily ideas. ##
## Comments and likes are greatly appreciated. ##

Quick Look: Dow Jones - Don't Miss These Levels!US30 Intraday Setup
Technical Outlook — 9 June, 2025
Market Context:
The Dow Jones (DJI) is currently consolidating around 42,760 after a recent rally. Price action suggests a potential "bear flag" formation near the "Previous Day High," indicating a crucial decision point for the short-term trend.
Key Levels & Trade Plan:
Resistance:
Immediate: ~$42,850 - $42,925 (Upper flag boundary / Previous Day High).
Major: ~$43,100.
Support:
Immediate: ~$42,690 - $42,720 (Lower flag boundary).
Strong: ~$42,590.
Lower/Previous Day Low: ~$42,390 - $42,280.
Trade Plan:
Bullish Breakout (Long):
Trigger: Clear 1-hour close above $42,925 with good volume.
Target: $43,100.
Stop Loss: Below breakout level (e.g., $42,800).
Bearish Breakdown (Short):
Trigger: Clear 1-hour close below $42,690 with strong selling volume.
Target: $42,590, then $42,390.
Stop Loss: Above breakdown level (e.g., $42,750).
Dip Buy (Long):
Trigger: Price holds $42,590 or $42,280-$42,390 with bullish reversal.
Target: Resistance levels.
Stop Loss: Below the confirmed support.
Risk Management: Always use proper position sizing and set a stop loss.
If you found this analysis valuable, kindly consider boosting and following for more updates.
Disclaimer: This content is intended for educational purposes only and does not constitute financial advice.

US30 JUNE 9Happy Mondays! Why are libraries so tall? Because they have many stories, like you will once you lock in on trading.
Now we can only do three things when it comes to trading Buy, Sell or nothing.
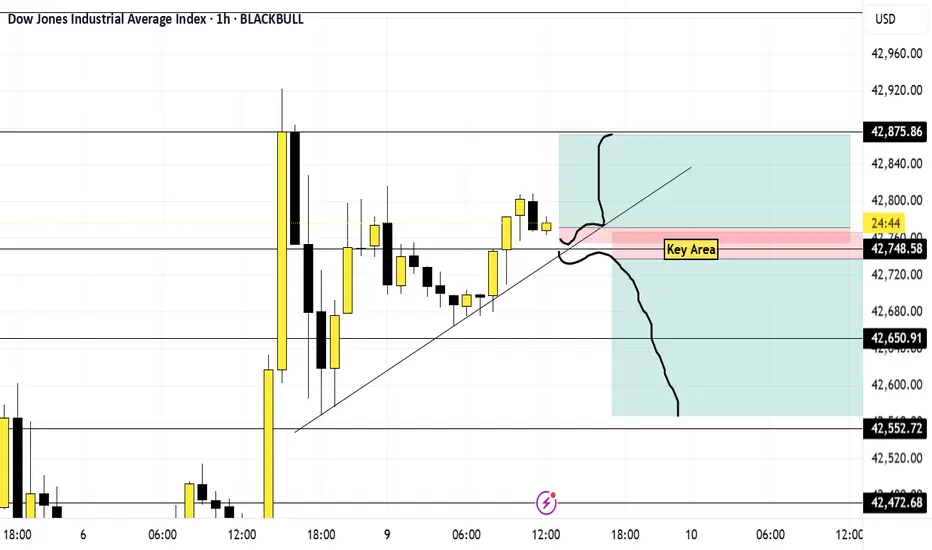
Price is moving up right now. If price breaks and retests my trend line and key area then I'm going to sell. However, if price rejects those same areas and starts to create higher highs and lows then I'll buy it.
If price decides to act like that one friend who got too high and decides to go nowhere then I shall do nothing and wait. That it that all.
Have fun and enjoy the process
US30US30 getting ready for another push up towards 43.5K.
Disclosure: We are part of Trade Nation's Influencer program and receive a monthly fee for using their TradingView charts in our analysis.

US30 Breakout Alert: Is 43,100 the Next Stop?📈 US30 30M Chart Outlook – Breakout Potential Ahead
Technical Outlook — June 6, 2025
Current Market Condition:
US30 (Dow Jones Industrial Average) is currently consolidating on the 30-minute chart following a sharp rally, trading around 42,754.50 with a marginal dip of -0.01%. Price is hovering between a key intraday support zone at 42,737.31 and resistance at 42,900.00, creating a high-probability setup for a breakout in either direction.
Key Technical Highlights:
Price is trading above both the 50 EMA (blue line) and 200 MA (red line), with both lines converging — a typical precursor to an impulsive move.
A tight consolidation range has developed, with bulls and bears battling between 42,737.31 and 42,900.00.
The Stochastic Oscillator is hovering near the 40 level, suggesting neutral to slightly oversold conditions — an early sign that bulls might regain control.
A breakout above 42,900.00 could pave the way for a rally toward 43,100.00.
On the flip side, a breakdown below 42,737.31 may trigger a correction back to the 42,600.00 support zone.
Possible Scenarios:
🔼 Bullish Case:
A clean break and hold above 42,900.00, supported by rising momentum, could fuel a short-term rally toward the 43,100.00 resistance area. If bullish continuation persists, further upside expansion is possible.
🔽 Bearish Case:
Failure to break 42,900.00 followed by a bearish close below 42,737.31 may indicate rejection, opening the door for a retracement toward 42,600.00. Increased selling volume at that point could invite deeper pullbacks.
Important Note:
Be cautious of increased volatility from upcoming economic data or geopolitical catalysts. Watch closely how price behaves around 42,900.00 and 42,737.31 to catch the next directional move early.
If you found this analysis valuable, kindly consider boosting and following for more updates.
Disclaimer: This content is intended for educational purposes only and does not constitute financial advice.

US30 Set to Break Records? Bulls Eyeing 46K–52K US30 Weekly Chart Outlook – Eyes on New Highs
Technical Outlook — June 6, 2025
Current Market Condition:
US30 (Dow Jones Industrial Average) is showing strong bullish momentum on the weekly chart after rebounding from the key 38,000–39,000 support zone. Price is now trading above the 50 EMA and maintaining distance from the 200 MA, indicating sustained strength in trend structure.
Key Technical Highlights:
Price bounced from the strong demand zone around 38,500.
Sustained recovery above EMA 50 (blue) and holding above short-term swing highs.
Weekly stochastic has crossed bullishly from oversold territory, supporting continued upward movement.
Price currently aims for retesting previous highs around 46,000.
If bullish momentum sustains, the next resistance levels are at 48,000 and 52,000.
Possible Scenarios:
🔸 Bullish Case:
If the current weekly structure holds and no major reversal signs appear, US30 could rally toward 46,000 in the coming weeks. A breakout above that could open the way to 48,000 and eventually 52,000.
🔸 Bearish Case:
Any strong rejection around 46,000 paired with a break back below 41,000 could expose the 38,000 support zone again.
Important Note:
NFP and major U.S. inflation data are due in the upcoming week. Watch out for volatility, especially near key resistance zones.
If you found this analysis valuable, kindly consider boosting and following for more updates.
Disclaimer: This content is intended for educational purposes only and does not constitute financial advice.

US30: Target Is Up! Long!
My dear friends,
Today we will analyse US30 together☺️
The price is near a wide key level
and the pair is approaching a significant decision level of 42.596.9 Therefore, a strong bullish reaction here could determine the next move up.We will watch for a confirmation candle, and then target the next key level of 42.690.5. Recommend Stop-loss is beyond the current level.
❤️Sending you lots of Love and Hugs❤️

US30 Will Move Lower! Short!
Here is our detailed technical review for US30.
Time Frame: 12h
Current Trend: Bearish
Sentiment: Overbought (based on 7-period RSI)
Forecast: Bearish
The market is approaching a significant resistance area 42,464.8.
Due to the fact that we see a positive bearish reaction from the underlined area, I strongly believe that sellers will manage to push the price all the way down to 41,145.2 level.
P.S
The term oversold refers to a condition where an asset has traded lower in price and has the potential for a price bounce.
Overbought refers to market scenarios where the instrument is traded considerably higher than its fair value. Overvaluation is caused by market sentiments when there is positive news.
Disclosure: I am part of Trade Nation's Influencer program and receive a monthly fee for using their TradingView charts in my analysis.
Like and subscribe and comment my ideas if you enjoy them!

US500 potential buyUS500 is setting up for a classic Wyckoff spring. This is a high probability set up with high risk to reward (5R+)
Here is what needs to happen
For situations 1 and 2,
a. price should break blue support (traps sellers and shakes out weak hands)
b. price should then close above any of the 2 blue supports with high volume
c. enter at the close of that bar or retest of the blue line
d. T.P @ recent high.
What do you think? how would you approach this better?

SHORT ON US30US30 Has given us a change of character to the downside with a nice retest creating a lower high.
I will be selling us30 to the next demand zone looking to catch 500-1000 points.

S&P500 Index (US500): Bullish Accumulation Pattern
I spotted a nice example of an ascending triangle pattern on a daily time frame.
To confirm a bullish continuation, we will need a bullish breakout
of its neckline.
A daily candle close above 5996 will provide a reliable confirmation.
A rise will be anticipated at least to 6080 resistance then.
❤️Please, support my work with like, thank you!❤️
I am part of Trade Nation's Influencer program and receive a monthly fee for using their TradingView charts in my analysis.

US30 I Bearish Reversal Based on the M30 chart, the price is rising toward our sell entry level at 42,481.32, a pullback resistance that aligns with the 38.2% Fib retracement.
Our take profit is set at 42,326.96, a pullback support that aligns closely with the 50% Fib retracement.
The stop loss is set at 42,646.90, a swing high resistance.
High Risk Investment Warning
Trading Forex/CFDs on margin carries a high level of risk and may not be suitable for all investors. Leverage can work against you.
Stratos Markets Limited (tradu.com ):
CFDs are complex instruments and come with a high risk of losing money rapidly due to leverage. 63% of retail investor accounts lose money when trading CFDs with this provider. You should consider whether you understand how CFDs work and whether you can afford to take the high risk of losing your money.
Stratos Europe Ltd (tradu.com ):
CFDs are complex instruments and come with a high risk of losing money rapidly due to leverage. 63% of retail investor accounts lose money when trading CFDs with this provider. You should consider whether you understand how CFDs work and whether you can afford to take the high risk of losing your money.
Stratos Global LLC (tradu.com ):
Losses can exceed deposits.
Please be advised that the information presented on TradingView is provided to Tradu (‘Company’, ‘we’) by a third-party provider (‘TFA Global Pte Ltd’). Please be reminded that you are solely responsible for the trading decisions on your account. There is a very high degree of risk involved in trading. Any information and/or content is intended entirely for research, educational and informational purposes only and does not constitute investment or consultation advice or investment strategy. The information is not tailored to the investment needs of any specific person and therefore does not involve a consideration of any of the investment objectives, financial situation or needs of any viewer that may receive it. Kindly also note that past performance is not a reliable indicator of future results. Actual results may differ materially from those anticipated in forward-looking or past performance statements. We assume no liability as to the accuracy or completeness of any of the information and/or content provided herein and the Company cannot be held responsible for any omission, mistake nor for any loss or damage including without limitation to any loss of profit which may arise from reliance on any information supplied by TFA Global Pte Ltd.
The speaker(s) is neither an employee, agent nor representative of Tradu and is therefore acting independently. The opinions given are their own, constitute general market commentary, and do not constitute the opinion or advice of Tradu or any form of personal or investment advice. Tradu neither endorses nor guarantees offerings of third-party speakers, nor is Tradu responsible for the content, veracity or opinions of third-party speakers, presenters or participants.

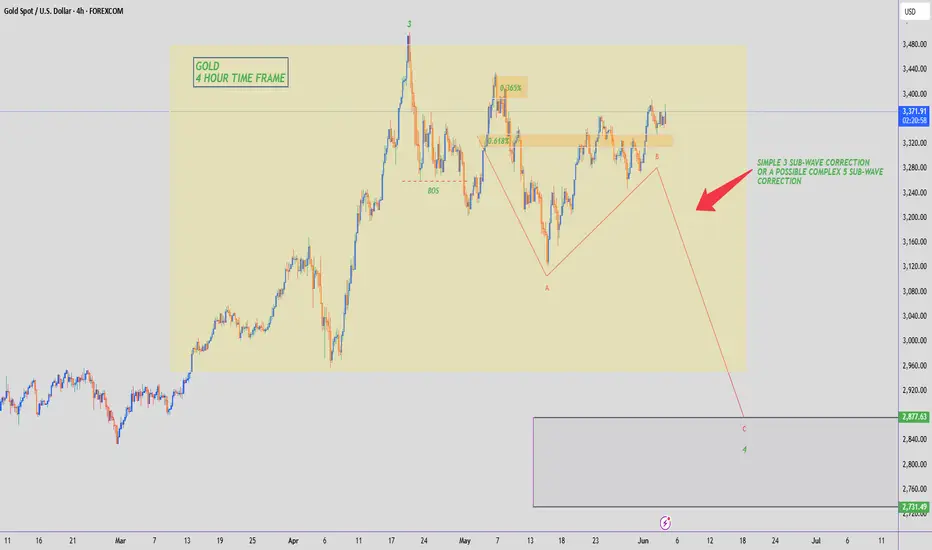
GOLD - WAVE 4 CORRECTION TO $2,800 (UPDATE)The 'resistance turned support' which I mentioned yesterday is holding up well. After the retest of the support zone, we're currently seeing bullish momentum keep Gold prices up.
As soon as Gold surpasses $3,400 & closes WITHIN the previous 0.365% zone, I will be sure that the 3 Sub-Wave (A,B,C) correction for sellers is over & buyers are now heading towards a new ATH. Until then I am still wary & being careful of sellers.
NASDAQ INDEX (US100): More Growth Ahead
For some unknown reason, I was asked by a dozen
of my subscribers to provide the update for US100.
Since early May, the index successfully updates the highs on a daily.
Such a tendency will remain at least till a test of a current ATH.
I think that the market is going to grow and reach at least 22100 level soon.
❤️Please, support my work with like, thank you!❤️

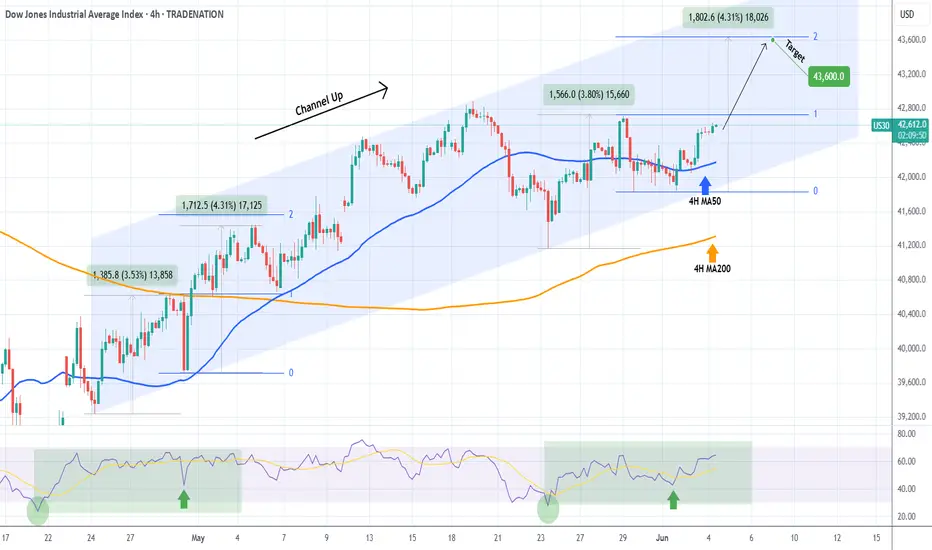
DOW JONES starting the new Bullish Leg.Dow Jones (DJI) is rallying off its 4H MA50 (blue trend-line), shortly after making a new Higher Low on its 6-week Channel Up. Technically that is the start of its new Bullish Leg.
With the 4H RSI being identical to the Bullish Leg at the start of the Channel Up, we expect it to again rise by +4.30% and touch the 2.0 Fibonacci extension. Target 43600.
-------------------------------------------------------------------------------
** Please LIKE 👍, FOLLOW ✅, SHARE 🙌 and COMMENT ✍ if you enjoy this idea! Also share your ideas and charts in the comments section below! This is best way to keep it relevant, support us, keep the content here free and allow the idea to reach as many people as possible. **
-------------------------------------------------------------------------------
Disclosure: I am part of Trade Nation's Influencer program and receive a monthly fee for using their TradingView charts in my analysis.
💸💸💸💸💸💸
👇 👇 👇 👇 👇 👇
US30 – Key Resistance at 42690 Ahead of ADP-Driven VolatilityUS30
The indices market is expected to be highly volatile today due to upcoming data releases, especially the ADP employment report.
Dow Jones (US30) appears to be continuing its bullish scenario toward 42690.
A break above 42690 may push the price further toward 42810, and if momentum holds, toward 43200.
However, stability below 42690 could trigger a strong correction toward 42460.
A sustained move below the pivot line at 42570 would shift the trend to bearish.
Resistance: 42690, 42810, 43200
Support: 42460, 42260, 42080

US30: Next Move Is Down! Short!
My dear friends,
Today we will analyse US30 together☺️
The recent price action suggests a shift in mid-term momentum. A break below the current local range around 42,499.2 will confirm the new direction downwards with the target being the next key level of 42,320.2.and a reconvened placement of a stop-loss beyond the range.
❤️Sending you lots of Love and Hugs❤️

DowJones INTRADAY broader concern over global trade headwindsTrade Tensions: US-China, US-Europe
Trump and Xi May Speak This Week: The call—if it happens—comes amid rising tensions over critical mineral exports, crucial for electronics and clean tech.
Market Implication: Ongoing uncertainty in US-China trade could pressure tech, EVs, and semiconductors, which rely on these materials. Watch for volatility in those sectors.
Europe Talks Stalling: Trade negotiations with Europe are also breaking down, with new tariff threats emerging.
Trading Angle: Defensive positioning in multinationals and exporters may be prudent. Currency pairs like EUR/USD could see movement on headline risk.
Corporate Layoffs: Disney, Microsoft
Disney & Microsoft Cut Jobs: Hundreds of layoffs in media and tech highlight continued weakness in entertainment and enterprise software demand.
Trading Relevance: Signals profit-margin pressure and shifting labor costs. Potential bearish signal for media ETFs and tech sector if layoff trend broadens.
China E-Commerce Firms Shift to Europe
Strategic Pivot: Chinese platforms are diversifying away from US markets due to tariffs and restrictions.
Market Watch: Could benefit European retail and logistics stocks. May also impact Chinese ADRs traded in the U.S.
Elon Musk’s xAI Debt Sale
$5B Debt Offering: Musk is raising capital for his AI venture, xAI Corp., while stepping back from politics.
Investor Focus: Watch Tesla and other Musk-related equities for capital allocation impacts. The move could dilute attention and increase risk premiums on his companies.
Harvard Legal Battle
Free Speech Lawsuit: Harvard pushes back on a Trump-era funding freeze.
Trading Impact: Limited direct effect, but feeds into broader political noise. May influence education sector stocks or legal/regulatory sentiment.
Wall Street Trade Idea (Nomura)
Strategy: Short S&P 500 on Trump trade threats, cover 5 days later → yielded 12% since February.
Application: Suggests short-term tactical trades can exploit volatility driven by political rhetoric. Useful for active traders focused on news-driven momentum.
Market Outlook
Futures Lower Today: Reflects broader concern over global trade headwinds.
Key Sectors to Watch: Tech (semis, EVs), Media, Chinese ADRs, European exporters, and AI-related plays.
Key Support and Resistance Levels
Resistance Level 1: 42920
Resistance Level 2: 43300
Resistance Level 3: 43620
Support Level 1: 41470
Support Level 2: 41160
Support Level 3: 40890
This communication is for informational purposes only and should not be viewed as any form of recommendation as to a particular course of action or as investment advice. It is not intended as an offer or solicitation for the purchase or sale of any financial instrument or as an official confirmation of any transaction. Opinions, estimates and assumptions expressed herein are made as of the date of this communication and are subject to change without notice. This communication has been prepared based upon information, including market prices, data and other information, believed to be reliable; however, Trade Nation does not warrant its completeness or accuracy. All market prices and market data contained in or attached to this communication are indicative and subject to change without notice.

DOW JONES: Inverse Head and Shoulders looking for a breakout.Dow Jones is marginally bullish on its 1D technical outlook (RSI = 55.600, MACD = 267.860, ADX = 21.901) as just now it is attempting to be detached from the 4H MA50. Technically this could be the attempt to break towards the 2.0 Fibonacci extension, after having formed the RS of an Inverse head and Shoulders pattern. With the 4H MACD close to a Bullish Cross, we are bullish, TP = 44,250.
## If you like our free content follow our profile to get more daily ideas. ##
## Comments and likes are greatly appreciated. ##
