US30 2024/04/1115min bearish range, waiting op premium for possible shorts
also looking to go for buys possibly from A-low during London Sesh
Us30analysis

US30 2024/04/10Still within 15 min Bearish range
POI's Marked out for CPI, wil be looking for MSS on said POI's, also trendline liq forming above price anticipating it to be run at some point

US30 will start the bullish move to break 40,000 level**Monthly Chart**
Last month's candle closed bullish and created a new high at 39910.47 (slightly shy from 40000.00 round number - a new historical high). This month opened from the high of the previous high and paused at 40023.09 only to reject it and move lower. This suggests that the long-term trend might be over and we should start looking for the start of a downward trend move.
**Weekly Chart**
Last week candle closed as a bearish manipulated candle as there was a huge sell of around 40,000 level. This has provided a counter-trend trade for a bearish move. However, till now US30 has tried to break below the 38500 level but fails. In addition, given the FOMC announcement today, we will see how US30 will react to it. This might provide another push to the upside to break the 40,000 level once more and create a new high.
**Daily Chart**
The last daily candle closed as a “ Key reversal” as it sweeps the liquidity from the daily MC candles near the demand zone, this provides a strong trajectory that there will be another push to the upside to break 40,000 level. Today FOMC will create this momentum.

US30 trade idea 2024/04/0815min bearish range
looking for possible sell from supply
also looking to to see if 15min high holds as we are in discount of the daily range could possible see price go higher

YM (US30, Dow Jones Industrial Aveage) Puts in a Double TopYM (US30) 4 Hour, Fibs: Traded the first bear fib after the double top and saw it trade past its objective yesterday. The Dow has been one of the weaker indices of late, after outperforming most of the year. It didn't even make it up to the 50% line, selling off at the 38.2% line in the initial down move. Then, yesterday, on the rebound, it traded it's halfway back short. ####TRADE ALERT####
YM (DOW 30)
Call: Short
Entry Type: Market 39320
SL: 39500
TP1 / TP2: 38636
################### Normal Size Position - Much Better Entry at A Series Fib with a Much Larger Reward:Risk 900 points of reward:200Points of Risk

US30 Dow Jones Technical Analysis and Trade IdeaIn this video, we delve into a prospective trading opportunity within the US30 Dow Jones index. Our analysis entails evaluating the prevailing trend, scrutinizing price movements, assessing market dynamics, and identifying a potential entry point under favorable conditions, as elaborated in the video. Incorporating robust risk management principles into your trading strategy is crucial. It's imperative to emphasize that this content is presented solely for educational purposes and should not be construed as financial advice.

US30 DJ30 DOWJONES ROBBERY PLANHI Traders,
NFP Trade master plan to Heist US30 Market. my dear Looters U can enter after the NFP data there is high chance to go down side, Our target is Green Zone if it goes bearish side, Bullish side our target is Red Zone that is High risk Caution Pullback area, If There is any Bad news it make our heist very sad and if the news is favorable for us then we can continue our looting from there with help of trailing stop.
My dear Robbers please book some partial money it will manage our risk. Be safe and be careful.. Make money and take money.

US30 Trade Idea 2024/04/05Sell POI's based op Current bearish range
NFT today expecting some sort of liq build up to be sweeped

US30 HIT 38850, BEAR RALLY IS ONOver 350 pips bagged successfully on Dow jones
PA is melting hard, what are you doing about it?
We have 2,150 pips to go.
stuck in profit

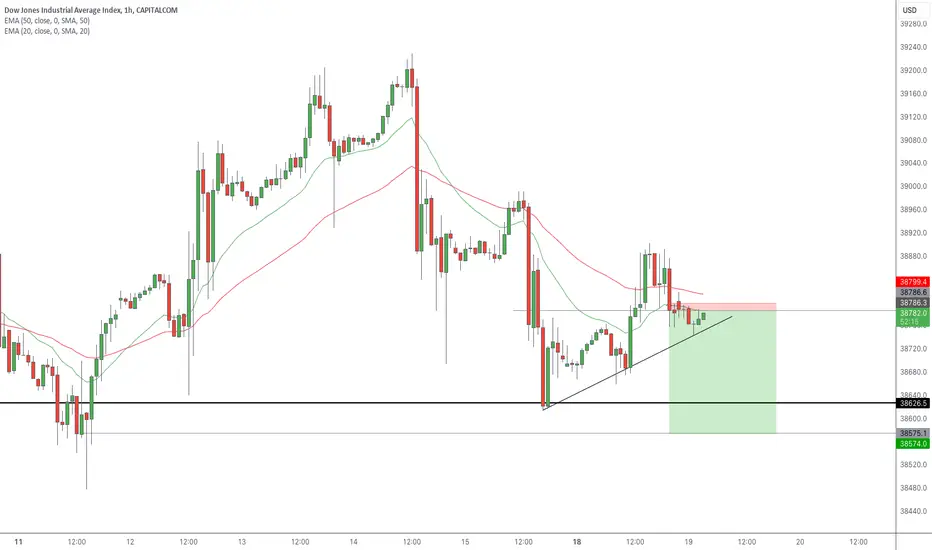
its possible to test te highs again This technical analysis sounds promising! Here's a breakdown:
Support Line Test: The price reached a level (support line) where previous buying pressure halted the decline. This suggests demand for the asset at that price point.
Retest of Support: The price dipped back towards the support line but didn't break through. This retest can be seen as a confirmation of the support level's validity.
Together, these pattern suggests a potential reversal:
The price might be bouncing off the support, indicating a possible upswing.

US30 POI's 2024/04/04 Possible intraday movement
PLEASE SEE POI'
POSSIBLE long and short zones marked out

US30 2,700 PIPS TARGETJust found this Gem on Dow after bagging Bulls
I am betting on bears power if PA break below this support zone.
Massive swing trade..

US30/DJ30 Bearish Robbery Plan Short SideHELLO LOOTERS,
This is our master plan to Heist Bearish side of US30 Market. my dear looters U can enter at the pullback, Our target is Trap Zone. We can escape in the Target area. Guys If you loot some money please take it partial.

US30 Technical Analysis: Counter-Trend Short OpportunityThe US30's bullish momentum has encountered a key resistance level. This presents a potential counter-trend shorting opportunity. Here's the trade idea:
Entry: Sell short at the current resistance level.
Stop-Loss: Place a stop-loss order above the recent high.
Target: Aim for the previous support/imbalance zone established at a prior low.
Rationale: The US30's extended rally into resistance increases the likelihood of a pullback. This setup offers a favorable risk-reward ratio for a short-term counter-trend trade.
Important Note: Market conditions can change rapidly. Manage risk diligently and adapt your strategy as needed.

Looking for US30 to rise back upWaiting for a internal liquidity sweep of today's low for a possible buying opportunity up to march 21st high. There is liquidity on lower time frames more visible (30min,15min & 5min). I'm personally using 1Hr and 5 min combination for this entry. When there is confirmation on the 5 min chart I'll enter around 39345- 39336 area located in the discount. That huge dump was distribution, we've consolidated in a range monday through tuesday, then made a lower low and got a market structure shift to the upside showing reversal signs. Good luck!


US30 remains bullish ( 39200.0 or 38800.0 longs?)This week, I'm bullish on US30. I'm waiting for a pullback followed by a re-accumulation within the demand zone. Once I receive confirmation on the lower time frame, specifically in the 21-hour or 18-hour demand zone, I'll consider taking long positions along the trend.
With the recent breach of all-time highs and significant bearish momentum, there's a possibility of price dipping further to capture liquidity and address imbalances before initiating a new upward rally.
Confluences for US30 Buys are as follows:
- Price broke structure to the upside once again.
- Lower and higher time frame remains extremely bullish.
- Two clean demand zones that have caused BOS to the upside.
- Imbalances left above that need to get filled before price comes in to zone
- After this imminent retracement we can expect a new rally.
P.S. If the price declines and breaches my Points of Interest (POIs), I won't be surprised. Since price has absorbed all liquidity to the upside, a decrease in bullish pressure is possible. With major news behind us, the trading week ahead appears promising!
Have a great trading week guys and lets catch those pips!

US 30 FALLThe analysis suggests a potential selling opportunity for US 30 (Dow Jones Industrial Average) on the daily and 4-hour timeframes.
On the daily timeframe, a selling entry zone is identified between 39,800 to 39,950 points. This range represents a level where significant selling interest has historically emerged, potentially acting as a resistance zone for the index. Traders often look for such areas to initiate short positions, anticipating a downward movement in price from these levels.
Additionally, on the 4-hour timeframe, a fresh selling zone is noted between 39,590 to 39,650 points. This zone represents a recent area where selling pressure has been observed, indicating potential renewed bearish momentum for US 30.
The trading strategy includes setting a target of 130 pips, representing the expected downside movement in US 30 from the identified selling zones. This target suggests the anticipated decrease in price from the entry zones to the desired profit level.
Furthermore, two target prices are set to manage the trade effectively. Setting multiple targets allows traders to lock in profits at different levels and adjust their positions accordingly as the trade progresses.
In summary, the analysis indicates a potential selling opportunity in US 30, with selling entry zones identified on both the daily and 4-hour timeframes. Traders may consider entering short positions with the expectation of a 130-pip downside movement, aiming to capitalize on the potential price decline from the identified selling zones.

US30 NEW TARGET 38580BEAR FORMATION: if this formation holds, i am expecting a IBO on US30
A retest might be inbound but risk is tight.
Watching this pair at this hour only mean I am hungry.
Is there anyone else hungry to eat some pips today?
US30 START OF A BEARISH MELTDOWN?Short positions on US30 appear compelling this week. We've observed significant bearish momentum lately, leading to a shift in character towards the downside, hinting at a potential trend reversal. Despite not having breached major structural levels yet, two robust supply zones remain, from which we can expect a bearish response.
The slowdown in price movement suggests distribution on higher time frames and hints at an impending reversal. Moreover, there's considerable liquidity to the downside, attracting price action, potentially resulting in a sweep of those equal lows.
Confluences for US30 Sells are as follows:
- Price has changed character on the 4-hourly time frame to the downside.
- Lots if liquidity to the downside in the form of equal lows.
- Two good supply zones in which we can expect a major bearish reaction to take place.
- Price has been heavily bullish and its due for a retracement.
- On the higher time frame price has slowed down momentum, good sign for a reversal.
P.S. However, on the higher time frames, the price remains notably bullish, with equal highs recently established at the latest swing high. These highs represent significant liquidity points, and it wouldn't be surprising if the price retraces to take them out.
FOMC news this Wednesday, trade safe and have a great week!

US30 SELLSUS30 once again had come into the Main 4H & Daily supply zone where I expected rejections. Also 12.30 UK time we had critical new on USD.
I was targeting entry @39235.00 where I entered aggressively with sl@39320.00 (80pts) at 11.30 UK time. Price then came down and broke structure on both 30mins & 1h Once positive USD news was released but then spiked back up to 39247.00 as manipulation but was calm and held.
Aim is to take partial profits at TP
TP1: 39860.00 Tp2: 38500.00 TP3:38300.00

US30 Pair : US30 Dow Jones
Description :
Completed " 12345 " Impulsive Waves
RSI - Divergence
Break of Structure
Bullish Channel as an Corrective Pattern in Short Time Frame
Impulse Correction

US30 SELL Looking at US30 I was expecting price to reach main supply zone @39050.00 and start to show rejections as I believed the early sell offs were a build up of liquidity. So I was patiently waiting for price to tap into Liquidity and take out these early sellers.
At around 2.30 NYC open volume always comes in and saw price shoot up to 39080.00 where I manually entered sells after seeing price come into my entry range and also seeing a 1min bearish candle. So sell entry @39080.00 with sl@39145.00.
TP1: 38900.00 TP2: 38700.00 TP3:38500.00 TP4:38300.00
