US30 SELL*THIS TRADE IS AN UPDATED VERSION OF THE PREVIOUS IDEA ON US30.
In the last post we had a very successful sniper entry. The setup however was not well predicted but our selling zones were respected !!
Technical is very strong for a bearish view ! --> triangle
Expecting a break of the triangle !
Target is the green circle !
Make sure to keep following for updates !!
Us30analysis

We might see new ATH in DJIA (US30) soon 41k levelsNow I changed my view on all global Indices, any dip looking forward to buy the dip. My stop losses is in place and tight stop losses for now until it breaks last month high. I think we are in major wave 5 and we are in 3(5) in minor cycle considering Elliot wave theory.
this is just my study and I might change my view depending on price action.

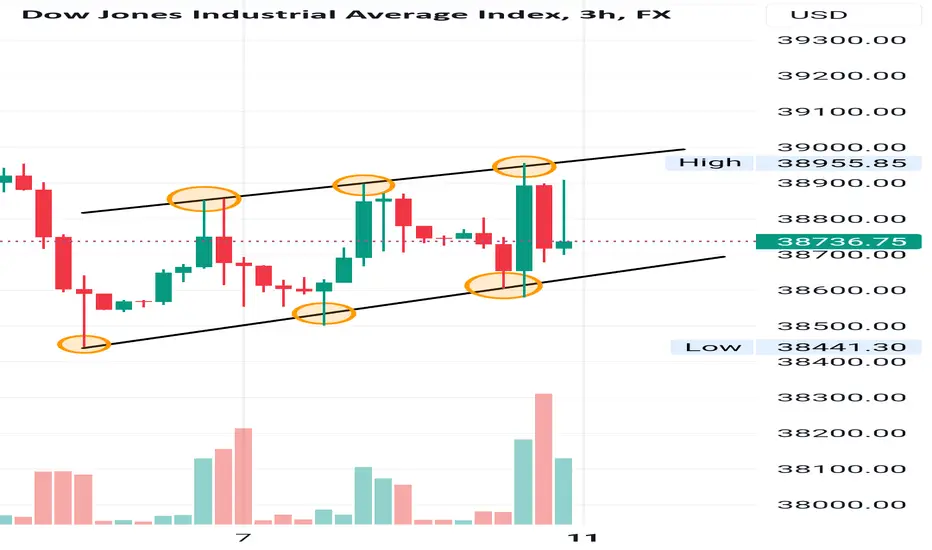
US30 Trade IdeaUS530: Riding the Ascending Channel to New Heights
The US30 index has been tracing an ascending channel on the 4-hour chart, a bullish pattern that suggests a continuation of the current uptrend. This pattern is characterized by two parallel upward-sloping trend lines that have been containing the price action.
Key Observations:
Bullish Sentiment: The ascending channel indicates a strong bullish sentiment as it is formed by a series of higher highs and higher lows.
Support and Resistance: The lower trend line serves as support, while the upper trend line acts as resistance.
Trading Strategy: Traders might consider buying at the lower trend line or on a breakout above the upper trend line.
Trade Execution:
Entry Point: A pullback towards the lower trend line could be a potential entry point, offering a favorable risk-reward ratio.
Stop Loss: A stop loss can be placed just below the lower trend line to protect against a potential breakdown.
Take Profit: The height of the channel can be used to project potential take profit levels, either from the point of entry or from the upper trend line if trading a breakout.
Risk Consideration:
Ensure to monitor for any signs of a breakdown below the lower trend line, which could invalidate the pattern.
Adjust positions according to the evolving market conditions and maintain a disciplined approach to risk management.
Trade ideas are speculative and should be considered within the context of your overall market analysis and trading strategy.
This trade idea is based on the ascending channel pattern, which is a common bullish signal in technical analysis. It’s important to combine this with other indicators and market analysis for a well-rounded trading decision. Happy trading!
US30 finally breaking down? (sells from 39000.0)My bias for US30 this week is bullish, anticipating a further upward movement before encountering a 2-hour supply zone around 39000.0. Afterward, I expect a slowdown and distribution within this area before a potential downward move.
Upon receiving confirmation on lower time frames, selling could target the new trendline liquidity above the 23-hour demand zone. If this scenario doesn't unfold initially, I'll wait for a break in structure to the downside to buy back up, as the overall trend remains bullish.
My confluences for US30 Sells are as follows:
- Price changed character to the downside on the higher time frame
- Lots of liquidity to the downside i.e. trend line liquidity and equal lows.
- We've experienced lots of bullish pressure and now bulls are getting exhausted.
- Nice supply zone left on the 2 hourly that caused the move to the downside.
- In order for price to keep going up it must retrace for healthy price action to continue.
P.S. Given the shift in price action to the downside on higher time frames, it appears that a bearish trend is beginning as bullish momentum wanes. Nonetheless, it's crucial to stay flexible and responsive to price movements, adapting to whichever direction it ultimately takes.

US30 sellI had been waiting days for this move and during the week US30 had created equal highs and built liquidity where I was waiting for price to eventually tap into the main supply zone also taking out early sellers.
Upon seeing that volume was coming back into the market at around 2.30pm Uk time I set a sell limit @38950.00 with sl@39000.00 (risking 50pts). Zooming into the 1min once price entered into zone and broke structure to the downside this gave me added confluence.
TP1: 38800.00 TP2: 38650.00 TP3:38450.00 TP4: 38300.00
* Where has the market moved since I entered my trade? PROFITS
* If I looked at the market now, would I take the same trade? yes
* How do I feel about my trade? optimistic
* What do I like about this trade ? precise entry, patience stalking the move
* What do I dis-like about this trade now? nothing just that it may go into next week
* On a scale of 1 to 10, where would I rate this Trade now? 8/10
* If I were not in a trade now, would I take the opposite trade ? no

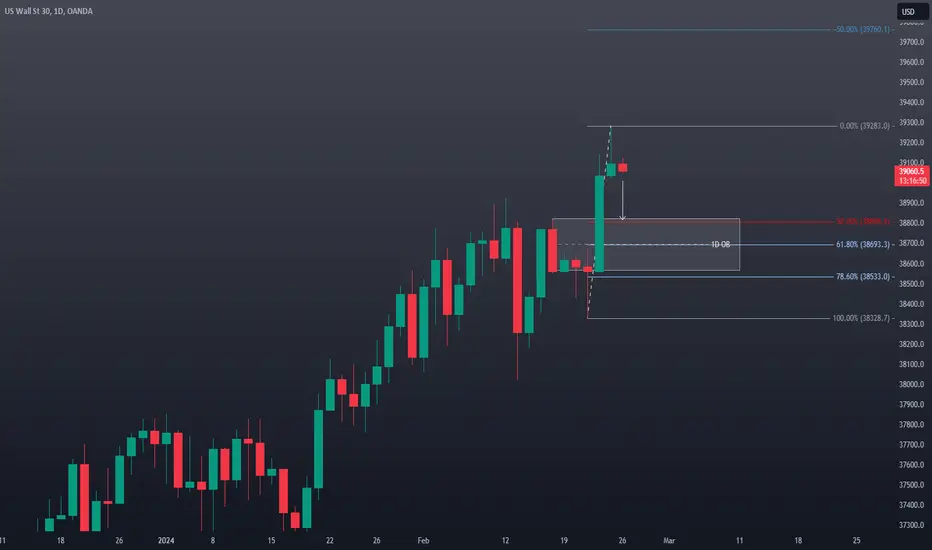
DOWJONES - Buy Zone!Hi there!
I'm a buyer on the DOW JONES:
-RMID (Range Manipulation Initiation Distribution)
-We have liquidity uptake.
-We're in an interesting zone.
-We have the optimal Fibonacci.
-We have accumulation before/on the zone.
-We're in the trend.
Let's not forget that we also have good profit results from companies, and we have Nvidia's report coming up, which looks very promising!
🚀 If you liked it and want more, don't hesitate to subscribe and boost the post!
Questions? Leave a comment!

US30 BEARISH IDEA This is just another sell idea ( yellow arrow ) following our entry ( previous post ) which is risk free and running at around 175 pips !!
Technical remains a strong bearish view --> expecting a break of structure very soon
Main target is the ( 4H ) demand zone !
Trade only during N-Y session and only if price is in the rectangle
KEEP FOLLOWING IF YOU WOULD LIKE MORE PRECISION TRADES ( 1 : 7 ) - ( 1 : 10 ) !!

DOWJONES - Buy Zone!Hi there!
I'm a buyer on the DOW JONES:
-RMID (Range Manipulation Initiation Distribution)
-We have liquidity uptake.
-We're in an interesting zone.
-We have the optimal Fibonacci.
-We have accumulation before/on the zone.
-We're in the trend.
Let's not forget that we also have good profit results from companies, and we have Nvidia's report coming up, which looks very promising!
🚀 If you liked it and want more, don't hesitate to subscribe and boost the post!
Questions? Leave a comment!

US30 - DOW JONES INDUSTRIALS AVERAGE US30 has been in a major bearish divergence from Jan 2018, I think march 2024 will be a month of correction (10%-15%) and then a pickup from April 2024 all the way to September/October when I think the market will hit the top for the US30 that will be around $44,200.
- Monthly MACD (Bearish)
- Monthly Pekipek's Divergence BETA (Bearish)
- Monthly RSI (Bullish)
- Monthly Stochastic RSI (Bearish)

DOWJONES - Buy Zone!Hi there!
I'm a buyer on the DOW JONES:
-RMID (Range Manipulation Initiation Distribution)
-We have liquidity uptake.
-We're in an interesting zone.
-We have the optimal Fibonacci.
-We have accumulation before/on the zone.
-We're in the trend.
Let's not forget that we also have good profit results from companies, and we have Nvidia's report coming up, which looks very promising!
🚀 If you liked it and want more, don't hesitate to subscribe and boost the post!
Questions? Leave a comment!

Dow Jones / US30This Is My Anticipation On The Us30, Hopefully We See A Low Of The Week Formed On The Daily Mitigation Block And We Get A Change In State Of Delivery Bullishly On The H1 To Confirm The Bias I Hold Already.

DOWJONES - Buy Zone!Hi there!
I'm a buyer on the DOW JONES:
-RMID (Range Manipulation Initiation Distribution)
-We have liquidity uptake.
-We're in an interesting zone.
-We have the optimal Fibonacci.
-We have accumulation before/on the zone.
-We're in the trend.
Let's not forget that we also have good profit results from companies, and we have Nvidia's report coming up, which looks very promising!
🚀 If you liked it and want more, don't hesitate to subscribe and boost the post!
Questions? Leave a comment!

US30 DOW JONES Technical Analysis and Trade IdeaThe US30 has enjoyed a robust bullish run, but recent price action on the 1D and 4H charts indicates potential weakness. I'm anticipating a **sell opportunity** should we observe a decisive break below the current range low, followed by a retest and failure of that level. Potential targets for this trade would align with prior 1D accumulation range highs.
Remember that trading carries inherent risk. Before executing any trades, it's vital to conduct your own extensive research. Consider both fundamental market drivers and global macroeconomic conditions alongside your technical analysis. Always implement sound risk management practices to safeguard your investment.
**Disclaimer**: This analysis presents a technical viewpoint on the US30. It should not be interpreted as investment advice. Base your trading decisions on your own risk profile, comprehensive market research, and a thorough assessment of all relevant variables.
US30 Long Like with all the other indices the obvious trend is bullish and am waiting for the pull back and rejection from a key levels with 4h close and a bullish 30min candle to sign of continuation

US30 weekly analysis Hello traders as you can see US30 has been on a bullish trend in the past week and months, it created the ascending triangle pattern that signals the bullish continuation and the price broke above the pattern so now we have to wait for the pullback into that zone and look for bullish trades after the price has created reversing pattern on that zone.

US30/USD Longs from 38600.0My bias remains strongly bullish for US30 this week. We've witnessed another significant break in structure to the upside, accompanied by robust bullish momentum, reinforcing the prevailing trend. I anticipate a retracement back to a demand level to sustain this upward movement.
Upon reaching the daily demand zone, I'm eyeing a refined 10-hour demand zone for a potential bullish reaction. Additionally, I'll be on the lookout for a Wyckoff accumulation pattern within this area
My confluences for US30 Buys are as follows:
- Price broke structure to the upside once again leaving a clean daily demand.
- Overall trend and the current trend remain to be very bullish.
- Candlestick anatomy also shows that bulls remain stronger than bears.
- Can expect a pullback to mitigate the levels of demand.
- Wick left to the upside that needs to get filled and price has been moving impulsively.
P.S. We observed a minor sell-off two weeks ago, followed by a resurgence that breached the previous high. Currently, I'm not actively seeking selling opportunities. However, I wouldn't be surprised if price establishes a supply zone, offering a chance to sell back towards the marked demand zone.

⤵⤵(US 30 uptrend pullback short bearish analysis)H ello traders what do you think about us 30)
(technical analysis forecast📉📈📊
Traders US 30 upstand if barekout 38749.14 big 🐻 baerish moment short 38022.02Test support pullback $$$ resistance level US 30 uptrend pullback short bearish I think testing 38166.13) 📉📈📊
short and what moment bearish) ⤵⤵📊📈 BLACKBULL:US30
level) last week US 30 upstand if barekout Big baerish moment 38k support breakdown buyers will pullback reset resistance 38800.00 price breakdown breakout level sellers rejected bearish well back) 📈📈📈📉📊 short target 38166.13 BLACKBULL:US30
Safe trade 🙏♥️ pales like and comment's don't forget next analysis fol low me 🤝

US30 Long Expecting a bullish then bearish to tap the orderblock @2900 then we set for a long term buy position.

US30 imminent shorts down towards 37700.0Last week, the US30 exhibited significant potential for a more favourable market environment, offering several promising trading opportunities. Following the completion of a Wyckoff distribution on a higher time frame, validated by a CHOCH, I anticipate a selling opportunity as the price retraces into a distinct 16-hour supply zone.
Although the price closed within the zone, it underwent a redistribution phase on a lower time frame, signalling a selling position. Presently, I am awaiting the breach of the upcoming Asian high to access a clean Order Block (OB) for initiating my sell position.
Confluences for US30 Sells are as follows:
- Price has completed a Wyckoff distribution on a higher time frame confirmed with a CHOCH.
- Clean unmitigated 16hr supply zone that caused market shift has been tapped into.
- Wyckoff re-distribution has taken place within the lower time frames.
- Lots of liquidity to the downside in the form of Asian lows, trendlines and equal lows.
- Price has been moving very bearish and it's getting exhausted hence why we got that bearish drop recently.
- For price to keep going up it must go down so we can expect temporary sells maybe down to a better demand.
P.S. While the market remains predominantly bullish, the recent downward movement was anticipated, signaling exhaustion of bullish momentum. This could mark the beginning of a bearish trend, presenting potential opportunities for short-term selling positions.
HAVE A GREAT TRADING WEEK AHEAD GUYS!
