US30US30 is due correction, it can start now or just above the ALH.
Disclosure: We are part of Trade Nation's Influencer program and receive a monthly fee for using their TradingView charts in our analysis.
Us30analysis
DOW Jones go upCMCMARKETS:US30
Reaching the price level of 45,082.74 is inevitable. From the current closing price, there is a high probability of continuation toward the ATH.
However, the price levels 44,440 and 44,344.95 are also acceptable zones from which the move toward 45,082.74 may begin.
At the start of the upcoming week, as soon as the market opens, we are likely to move toward the ATH from one of these three levels.

US30 Scalp Buy SetupIf upside liquidation taken first before the entry is achieved then don't take the entry, wait for the entry and set tp & relax.

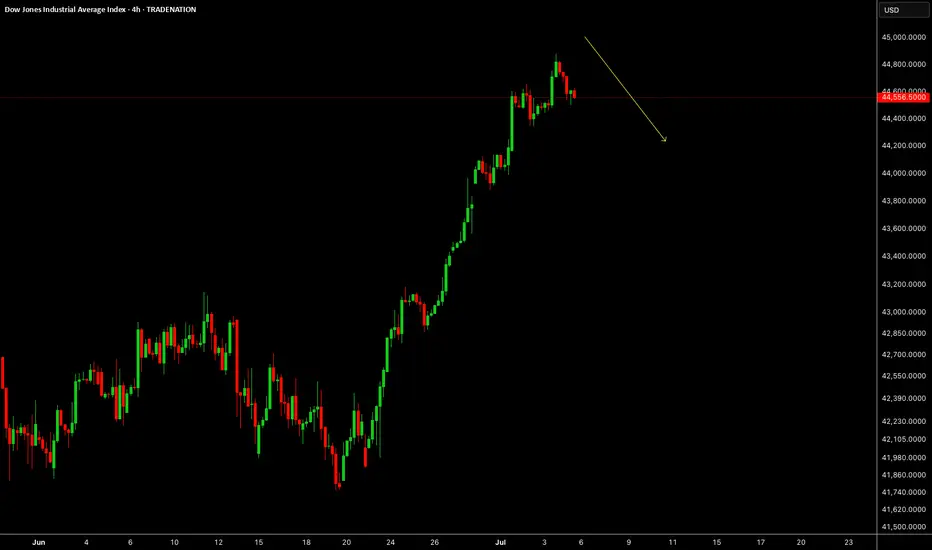
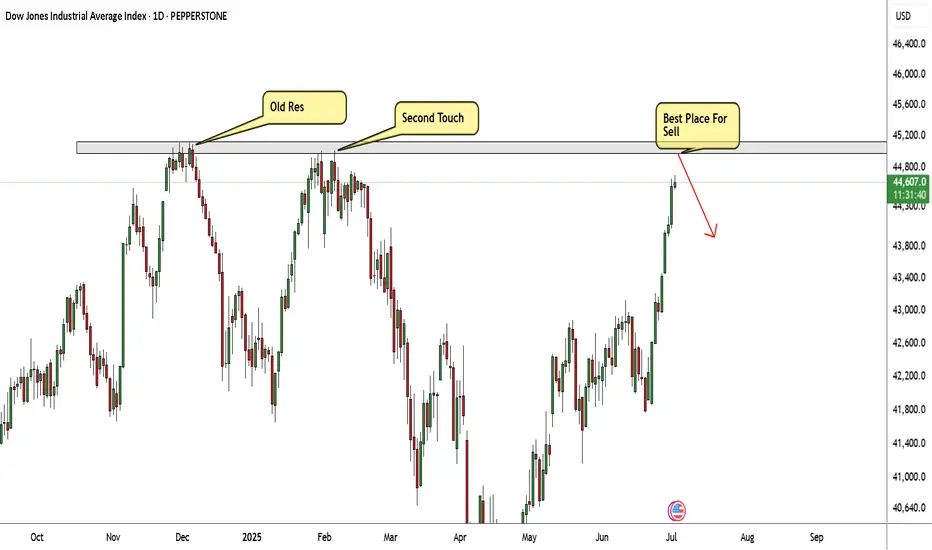
US30 Very Near Strong Res Area , Short Setup To Get 500 Pips !Here is my US30 Daily Chart , the price very near the highest price area , this res area forced the price to go down very hard 2 times so i think this time will be the biggest movement to downside , so i`m waiting the price to touch it and give me a good bearish price action and then we can enter a sell trade and targeting at least 500 pips . if we have a daily closure above then this idea will not be valid .
US30 BE PATIENT AND YOU WILL ALWAYS BE PROFITABLEEIGHTCAP:US30
After notices US30 is coming to new highs I would like to talk about key entry points I would love to enter at
Over the years I've notice no matter how low US30 goes it always come back to price action
as you can see, I've did an example that happened in March, it came back +3000 point now I know you're thinking I could have made more money or caught more setups, but this is guaranteed because no matter how long you held this trade it will always come back to price action yes, it took 35 days just to do nothing yes, it took another 45 days to gained 3000 points but we always know us30 is a graduate to go back in a upward trend no matter how long
BUY LOW AND HOLD TILL YOU MAKE PROFIT THAT'S WHAT THE RICH DO

Market Heist in Progress! US30/DJI Long Trade – Ride or Escape?🔥 "The US30/DJI Heist: Bullish Loot & Escape Before the Trap!" 🔥
🌟 Hi! Hola! Ola! Bonjour! Hallo! Marhaba! 🌟
Dear Money Makers & Market Robbers, 🤑💰💸✈️
Based on the 🔥Thief Trading Style🔥 (technical + fundamental analysis), here’s our master plan to heist the US30/DJI (Dow Jones Industrial Average). Follow the strategy on the chart—long entry is the play! Aim to escape near the high-risk RED Zone (overbought, consolidation, potential reversal). The bears are lurking, so take profits and treat yourself—you’ve earned it! 💪🏆🎉
🚀Entry (The Vault is Open!)
"Swipe the bullish loot at any price!"
For precision, place buy limit orders within 15-30min timeframe (recent swing lows/highs).
Set alerts! Don’t miss the heist.
🛑 Stop Loss (Safety Net)
Thief-style SL at nearest swing low (3H timeframe) → 41,400 (adjust based on risk/lot size).
🏴☠️ Target 🎯: 44,200.00
Bullish momentum is fueling this heist—ride the wave but exit before the trap!
📰 Fundamental Backing (Why This Heist Works)
Macroeconomic trends, COT data, geopolitics, and sentiment align for bullish moves.
Full analysis? Check our bio0 linkk! 👉🔗🌎
⚠️ Trading Alerts (News & Risk Mgmt)
Avoid new trades during high-impact news (volatility = danger).
Use trailing stops to lock profits and dodge sudden reversals.
💥 Boost This Heist!
Hit 👍 (Boost Button) to strengthen our robbery squad!
More heists = More profits—stay tuned for the next steal! 🚀🤑
See you soon, fellow thieves! 🤝🎉

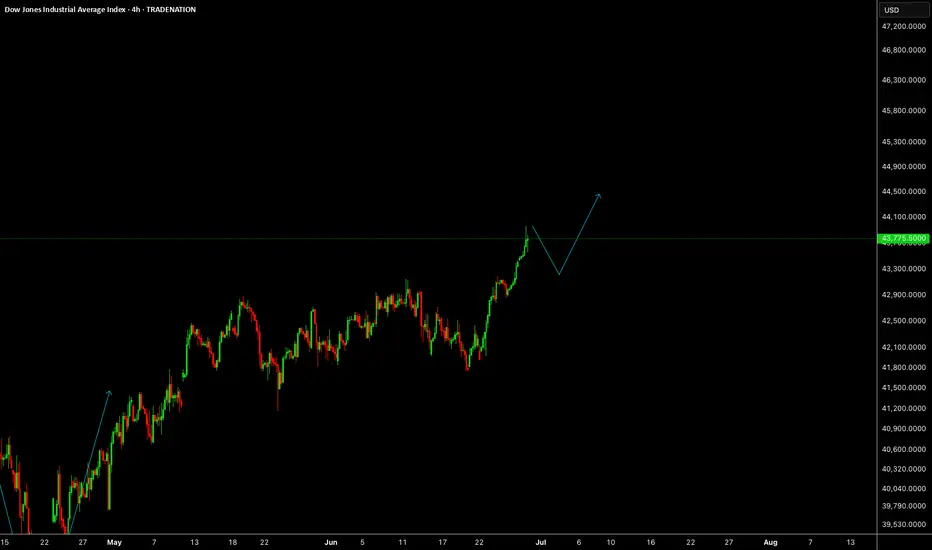
US30We expected US30 to give us a reaction from above 43.5K, market has given us more than 2K points move, now we will wait for the correction before any more buys.
Disclosure: We are part of Trade Nation's Influencer program and receive a monthly fee for using their TradingView charts in our analysis.
Dow Jones Retesting 43,020 | Bullish Bias Intact Above 42,810US30 OVERVIEW
Dow Jones Holds Bullish Momentum | Eyes on Retest and Continuation
US30 (Dow Jones) remains under bullish pressure, supported by recent macro developments and improving sentiment.
The price appears to be forming a retest toward 43,020, which could act as a springboard for further upside.
As long as the index trades above 42,810, the bullish trend remains intact, targeting 43,350, and potentially 43,765.
However, a confirmed break below 42,810 would shift the outlook to bearish in the short term.
Resistance Levels: 43,350 → 43,765
Support Levels: 43,020 → 42,810
Previous idea:

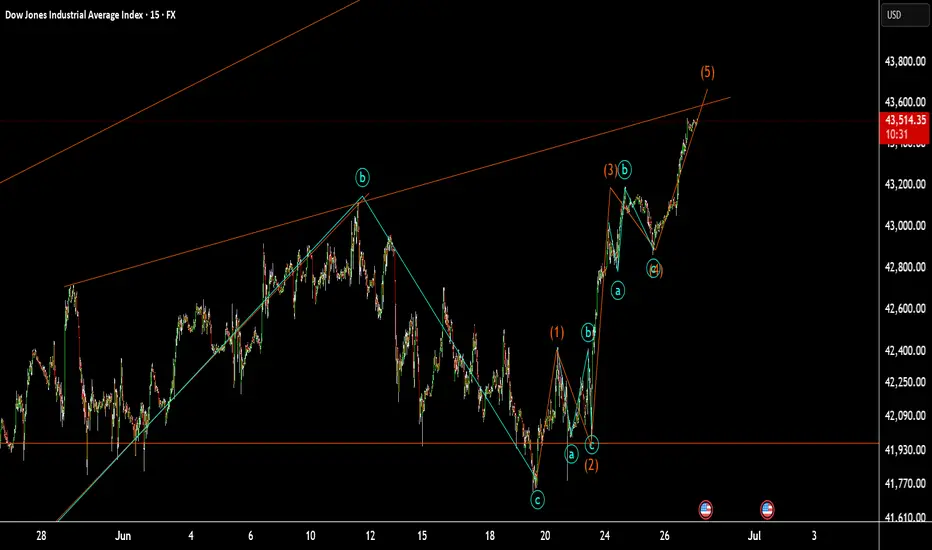
US30 at small resistanceUS30 at small resistance:
as I counter these wave we are in wave 5. it might be goes up to the maim trend Line in previous analysis.
Dow Jones Industrial Average Index - 4h Chart (FOREXCOM)4-hour chart of the Dow Jones Industrial Average Index (US30) shows the price movement from late June to early July 2025. The current value is 43,057.7, reflecting a slight increase of +78.0 (+0.18%). The chart highlights key price levels, including a resistance zone around 43,324.1 and a support zone near 42,875.8, with recent price action showing a breakout above the resistance level.

Why I’m Sitting Out: US30 Reaches Critical Range HighI’m currently keeping a close eye on the US30, along with the other major indices 🧐. What stands out the most right now is how overextended this rally has become across the board 📈.
The key concern here is that price has now pushed into a previous external range high, sweeping liquidity resting just above that level 💧. This area is a textbook zone where big money often steps in to offload positions — it’s the perfect place for institutions to find willing counterparties after prior accumulation 📍💼.
Given the aggressive nature of this move and how far price has stretched, I’m extremely hesitant to get involved at this stage 🚫. I have zero interest in buying into a market that’s trading at a premium and sitting at a potential reversal zone ⚠️.
The prudent move here is to wait for a retrace, followed by a bullish break in structure before considering re-entry 🔁📈. Sometimes, the most powerful edge in trading is knowing when not to trade — and for me, today is one of those days.
⚠️ This is not financial advice — just sharing my current perspective on the market.

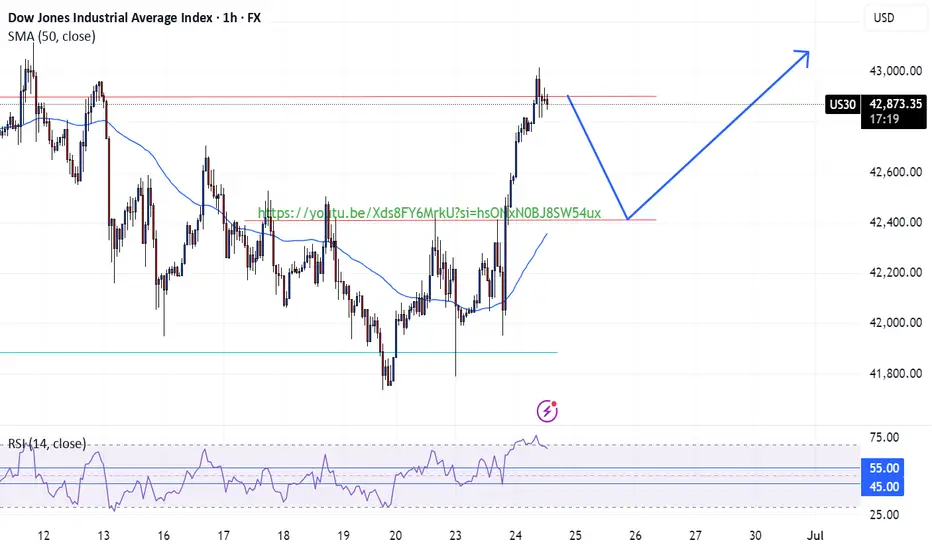
US30 Long Opportunity US30 shows strong bullish confluences at the opening of the week, currently testing the resistance level at 42,900. Price is above above the 50 SMA and favors bullish momentum per the RSI above 55.
Potentially retracement towards the break and retest level at 42,400 where we could see a potential continuation of the bullish trend after the market collects enough liquidity.
This is support by fundamentals of the day being the cease fire between Iran-Israel. investor more comfortable taking risks and stepping back into the indices.
US30 Will Grow!
HI,Traders !
#US30 is trading in an
Uptrend and the Indice
Made a bullish breakout
And a pullback so affter
The retest of the broken
Falling resistance which
Is now a support we will
Be expecting a further
Bullish move up !
Comment and subscribe to help us grow !

US 30 the 5th wave US 30 the 5th wave this is not an impulse wave totally.
just the conflict of is going to be peace so if we look at OIL we can see everything is good.

US30 H4 AnalysisUS30 Showing a bullish Flag to 42,762. If it breaks this zone, Most probably can fly upto 44,000 and higher. Trading Analysis from 23-06-25 to 27-06-25. Take your risk under control and wait for market to break support or resistance on smaller time frame. Best of luck everyone and happy trading.🤗

Dow Jones potential down side moveDow Jones is showing some sign of wanting to go short with also the potential dollar strength coming into the markets and the bond yield markets having a bullish trend for the last couple of months. Dow has reach a full fib extension and we could see some form of retracement continuation.

US30 TodayUS30 Today is still bearish
My SSM Reversal Pattern is comming.
This is just my view of course

US30 Potential Rebound from Key Support Zone
US30 Potential Rebound from Key Support Zone 🚀📊
📉 Analysis Overview:
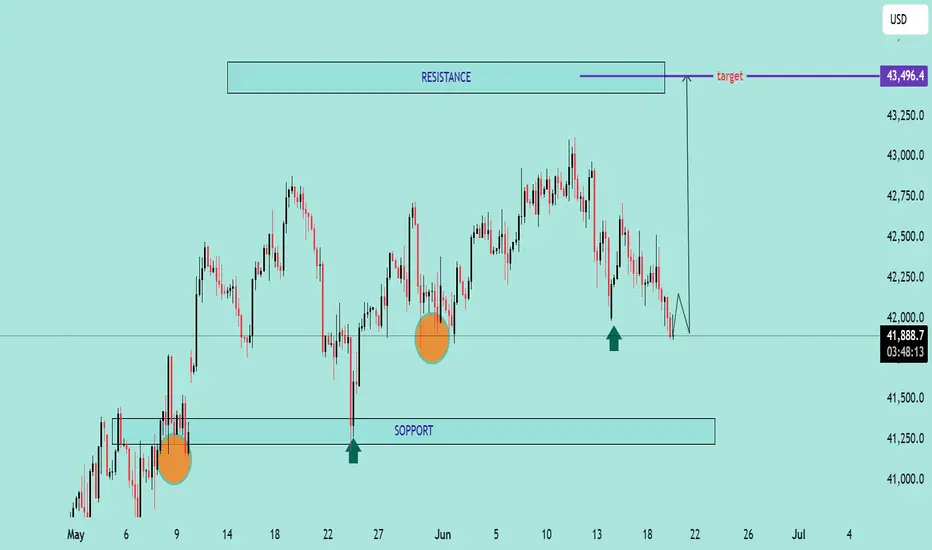
The US30 (Dow Jones Index) is currently testing a major support zone near the 41,800–41,900 range, a level that has held firm multiple times in the past (highlighted with green arrows and orange circles). This area has acted as a demand zone, leading to strong bullish reactions previously.
🔍 Key Technical Highlights:
🔸 Support Zone: Clearly respected at ~41,800. Price is once again bouncing here.
🔸 Resistance Zone: Around 43,250–43,500. This area has acted as a ceiling, where price struggled to break through.
🟢 Reversal Indicators: Multiple successful defenses of the support zone suggest accumulation and possible bullish reversal.
📈 Target Projection: If support holds, the price may rally toward the target zone near 43,496.4, as shown by the purple arrow.
📌 Conclusion:
As long as the 41,800 support holds, US30 shows bullish potential toward the 43,500 resistance. A break below this zone would invalidate the bullish scenario and shift focus back to the lower support near 41,250.
🛑 Risk Management Tip: Watch for confirmation candles and volume before entering long positions. Always set a stop-loss below the support zone.
US30 Under Pressure: Possible Short Setup Brewing on the 4HI'm currently eyeing the US30 (Dow Jones Index) for a potential short opportunity based on multi-timeframe structure 📊.
🔍 Weekly Overview:
The weekly chart continues to show sustained pressure, with this week and last week both closing bearish. The sellers are clearly in control at the macro level. 🔻
📆 Daily & 4H Structure:
Drilling down to the daily and 4-hour charts, we can clearly see a break of structure (BOS). The 4H specifically is showing textbook signs of a bearish trend with lower highs and lower lows forming consecutively 🪜🔽.
🎯 Trade Plan:
I'm watching for a pullback into equilibrium, ideally near the 50% level of the recent Fibonacci range. If price revisits that zone, I’ll be looking for short confirmations to ride the momentum back toward the previous lows, as marked on the chart. 🧠💸.

DOW30/US30 - ACTIVE TRADE - PROFITABLE SET UP TRADETeam,
today I have provide LIVE trading today provide you i did a good trade for
NAS100, DOW30 AND DAX30 - in real LIVE trading
OK, I prefer to SET UP my limit order today only. Remember, the market will be very volatile in the next 4 hours.
I expect the RATE should cut 25 points at least. Why
the employment data come out remain the same
inflation last week look under control
Retails is poorly come out today
The FED does not care about the America, they just care about taking advantage of America.
Lets now focus on the SETTING BUY LIMIT ORDER
I order small volume at 41975-42075
However I will double up at LIMIT BUY ORDER
The 1st target are looking at 4227542300
Target 2 - 42575-42675
REMEMBER - IF IT DOES NOT HIT YOUR ENTRY, JUST WALK AWAY.

US30 – Bearish Setup Below Resistance Zone US30 – Bearish Setup Below Resistance Zone 🚨🟥
The US30 index is exhibiting signs of bearish momentum after repeated rejections from the key resistance zone near 43,200. Let's break down the technical picture:
🔍 Technical Analysis
📌 Resistance Zone (🟥 43,200 area)
Price was rejected twice from this resistance (marked by red arrows), showing strong seller presence.
Bearish candlesticks followed each touch, confirming exhaustion near this level.
📌 Support Zone (🟦 40,800 area)
The area around 40,800 has acted as a strong demand zone in the past (highlighted with green arrows and orange circles).
Price might revisit this area if current bearish structure continues.
📌 Intermediate Support (🟪 41,828)
This level serves as short-term support.
If broken, it could accelerate the decline toward the major support.
📌 Market Structure
Lower highs forming after each bounce indicate weakening bullish strength.
A potential bearish breakout pattern is forming (highlighted by the projected path).
📈 Conclusion & Trade Outlook
Bias: Bearish 📉
Trigger: Break below 41,828 support
Target: 40,800 zone
Invalidation: Break and close above 43,200 resistance

DOW30/US30 - TIME TO MAKE MILLIONSTeam, Time to LONG SMALL POSTION ON US30 now
ADD DOUBLE UP at 41950-41800 - kill them if they drop this price range
Target 1 at 42400-42440
TAKE 50-70% volume for profit once it hit 1st target
BRING STOP LOSS TO BE and the remaning for 2nd target.

US30 Long OpportunityUS30 had a break out to the upside from $42560 and we are not seeing a potentially retracement to the break and retest level where we can expect a further jump to the upside. Seeing bullish structure on the 15 min and higher timeframes with confluence at the breakout.
Price is currently above the 50 SMA on all timeframes above the 15min and momentum is bullish per the RSI trading above the 55 level, adding to the bullish confluence
Looking to the ride the bullish wave from $42560 to $42920 where currently resistance level is sitting
