DOW JONES (US30) - Selloff started ✅Hello traders!
‼️ This is my perspective on US30 .
Here we can see that price filled the imbalances and rejected from bearish orderblock, so I expect we will see bearish price action upcoming days. We can correlate this move with DXY, as USD is expected to get stronger.
Like, comment and subscribe to be in touch with my content!
Us30analysis

US30 ( High Probability SELL Setup TP HIT !! )Here we can see Clearly how our previous post has worked perfectly as we predicted,
Thank you for believing in our analysis & posts,
Well Done to whoever took the trade with us,
Happy pip hunting traders.
FXKILLA.

US30 (High Probability SELL Setup SOON)!!
* Here we can see clearly the next move for Dow Jones Industrial Average ( US30 ) today,
* We can see clearly the formation of Head & Shoulder Reversal Trading Pattern ( M ),
* we've got our EP ( Blue Line ) & our TP ( Golden Line ),
* We're using M15 Time Frame for a Clearer View of our Analysis, hence we can't predict the duration of the market execution,
* Keep a close eye on your trading journey,
* Happy pip hunting traders.
FXKIllA.

Dow Jones (US 30) Weekly Analysis Dow Jones (US 30) Weekly analysis on a H4 chart. The price is currently at the resistance level. It may push more before it reject or it will reject from where it is, before it brake the trendline. If the price hold from the current trendline we will see the price breaking out of the resistance at push more up. We therefore need to wait for the price to breakout either up or down.

US30 top-down analysisHello traders, this is a complete multiple timeframe analysis of this pair. We see could find significant trading opportunities as per analysis upon price action confirmation we may take this trade. Smash the like button if you find value in this analysis and drop a comment if you have any questions or let me know which pair to cover in my next analysis.

SKY IS THE LIMIT ✈🚀🙌😎👌✔Price broke above my major key resistance trendline and seem to be testing the new found support. My FIBS are out, price currently on my key price retracement zone and seems to be bouncing off 🚀. We are definitely heading for a new HH. Ill be patiently waiting.

Current MARKUP on US30 ✔🙌😎👌Price currently testing 33996.0 Major key resistance on H1 in our current structure. overall trend is bullish our our major TFs so not looking to hold this short position on this particular trade. SL set tight above H1 Major key and TPs are set on my key zones on Fibonacci. We also have CPI at 15:30 (SA time) so I wont be capitalizing on this trade for now. lets wait and see. 🧨✈🛩🚀

I will be shorting US30 ( bearish flag) What do you think?I think we have a good bearish setup for US30. Let me know if I missed something
US30 Trading Plan - 9/Jan/2023Hello Traders,
Hope you all are doing good!!
I expect US30 to go Down after finishing the 4H correction.
Look for your SELL setups.
Please follow me and like if you agree or this idea helps you out in your trading plan.
Disclaimer: This is just an idea. Please do your own analysis before opening a position. Always use SL & proper risk management.
Market can evolve anytime, hence, always do your analysis and learn trade management before following any idea.

US30 top-down analysisHello traders, this is a complete multiple timeframe analysis of this pair. We see could find significant trading opportunities as per analysis upon price action confirmation we may take this trade. Smash the like button if you find value in this analysis and drop a comment if you have any questions or let me know which pair to cover in my next analysis.

Dow Jones ( US 30) Weekly Analysis for Dow Jones ( US 30) on a H4 chart.After the NFP on Friday, US 30 managed to breakout from the resistance level and close above. With that in hand one can just wait for a pullback and a price action that will indicate a buy.

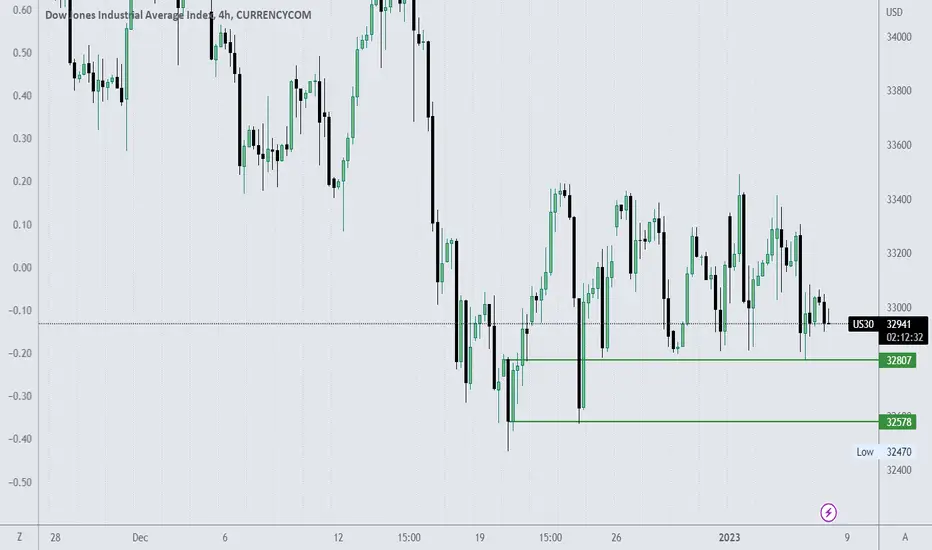
US30US30 is going to be down.
Reasons:
1.Liquidity sweep at 4H.
2.Bearish order block after the liquidity sweep.
3.Change of character formed at smaller time frame.
4.Break of structure formation.
Set TP and SL according to mention.

US30 (High Probability BUY Setup, TP HIT)!!Here we can see clearly how our SELL & BUY SETUP has worked up perfectly as we predicted in our previous post,
Keep your eyes close on your trading journey,
Happy pip hunting traders.
FXKILLA.

Take a look at this DOW US30 Potential Sell opportunityAs mentioned in the last post if price clears the lower end of the range the technical picture looks good for another nice leg down.
Check out the same levels on a weekly chart for the bigger picture.
Stocks may not be finished selling of yet.
*****************************************************************************************************************************************************
If you enjoy our work and what we share please take one moment to follow us on this platform at give us the thumbs up,
by doing so we gain the feedback needed for us to continue sharing our analysis here.
Thankyou

Looking to sell US30 back down to key areas notedYes we are Back.
It's been a while, here is our trade idea on the US30 this afternoon
Lets see what the volatility this afternoon has in store for us.
If we clear the range we see no reason why the DOW cant have another leg down similar in size to the one preceding this shrinking chop box.
US30 (High Probability BUY Setup SOON)!!* Here we can see clearly the next moves for DJ30 or US30 today, Forming a Double Bottom Soon ( W ),
* We're expecting a downside move first before we get a bigger uptrend move later on the day,
* We're using smaller time frame for a better view of our analysis, hence we can't predict the duration of our analysis,
* With ADP Non-Farm Employment Change released at 1:15pm (GMT + 00:00) London time,
* While on Wednesday, U.S. stocks closed in choppy trading session, markets had beed down early in the day on the back of a mixed bag of economic data,
* With November Job Openings & Labor Turnover ( JOLTS ) report showed the job market remained strong, bolstering concerns that the Feds could continue raising interest rates as long as there remained a hot market for workers,
* We've got our both EP for SELL & BUY SETUPS,
* We've got our both TP for SELL & BUY SETUPS,
* Keep a close eye on you trading journey,
* Happy pip hunting traders.
* FXKIllA. *

Bearish flag for us30 on 4h After the bearish move from the head and shoulders us30 is consolidating as a flag and waiting for the breakthrough to continue his bearish move

Dow Jones (US 30) Dow Jones (US 30) daily analysis on a 4h chart. The overall market structure is on a breakout after a downtrend channel that took over a 8 months. The price is currently on a ranging move, it therefore means that one will have to wait for a breakout.

US30 Long...US30 Buy... This is not signal... Dont risk more than 3% of your account on any trade...

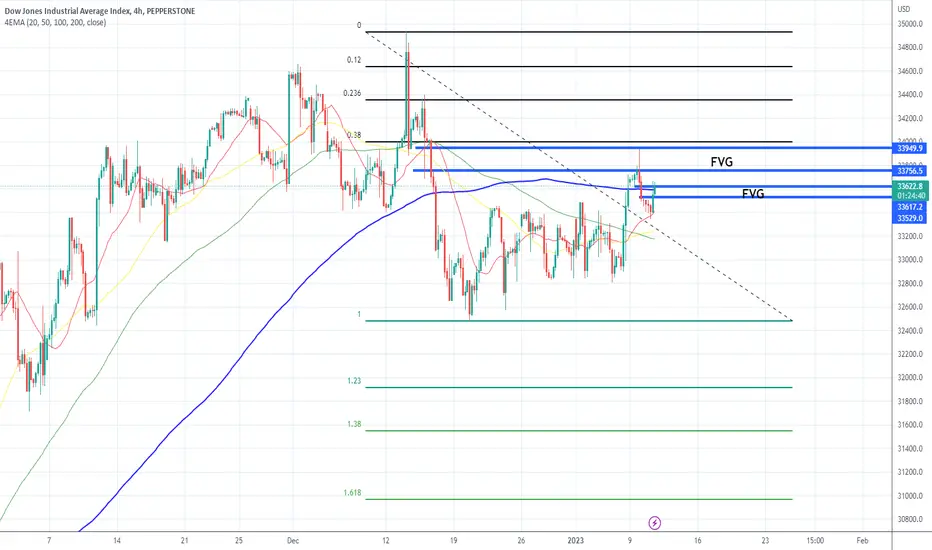
US30MY US30 Bias is Bullish now and US30 seemingly will break the recent highs sooner and will try to fill up all the FVGs.

Dow Jones (US 30)Dow Jones (US 30) daily analysis on H4 chart. The price is currently moving sideways after the breakout. We, therefore need to wait for a breakout, before one can can take a trade.

Dow Jones Analysis 02.01.2023Hello Traders,
welcome to this free and educational analysis.
I am going to explain where I think this asset is going to go over the next few days and weeks and where I would look for trading opportunities.
If you have any questions or suggestions which asset I should analyse tomorrow, please leave a comment below.
I will personally reply to every single comment!
If you enjoyed this analysis, I would definitely appreciate it, if you smash that like button and maybe consider following my channel.
Thank you for watching and I will see you tomorrow!
You can also check out my previous analysis of this asset:

us30 coming to fall I'm expecting price drop till zone of demand to get buy as you see on my chart this is my idea for share please leave comments and share it
