US30 is preparing for a breakdwon!!US30 has formed a reversal pattern and has broken out of local trends and retested with strong rejection. Price has created strong bearish price action and is likely to break down to the daily support as the market is over-extended.
A high probability setup is on the previous support as resistance.
Press like button if you enjoy this idea!!
Us30idea

US30 and US100 top-down analysisHello traders, this is the full breakdown of this pair. We will take this trade if all the conditions are satisfied as discussed in the analysis. Smash the like button if you find value in this analysis and drop a comment if you have any questions or let me know which pair to cover in my next analysis.

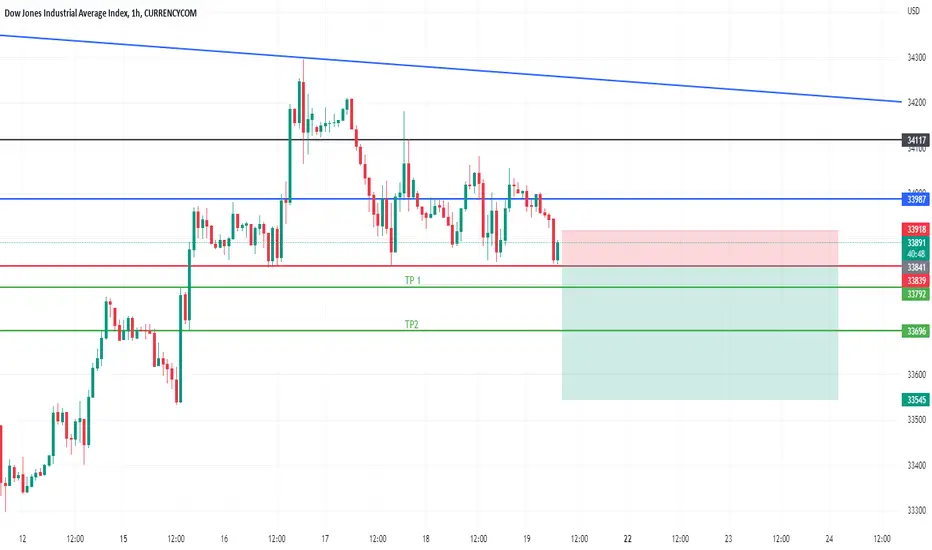
us30 potential sell after breaking the supportkind of head and shoulder with triple top and we can of descending triangle on 1H time frame
US 30 daily analysisMy US 30 daily analysis on H2 chart. At this point, the price is moving sideways. we therefore need a breakout either up or down.

US30 30 M GAPHello friends! US30 GAP on 30 M a break of the resistance will be interesting for a potential BUY .

US30 Head and shoulders on 1Hhello friends! here's a head and shoulders on 1H time frame a break of the support will be interesting for a potential SELL

US 30 daily analysisMy daily analysis on US 30. The price is at the support level. It can reject and push up or it will beak and move down.

Us30 ExecirseI have taken you through last week pointing day to day was was going to happen and every day went as I pinpointed. Today is your day to navigate your way through this annotations I have put on the chart do not try to chase the trades. today I'm sitting out due to so much heats(profits) since last week. For those that have been going following my Tradingview and have been executing with my help, do not trade today, rather study this chart and if the edge kicks in go with paper trading we have made so much from since last week. watch and learn

US 30 daily analysisThe US 30 daily analysis on H2 chart. The market has entered the bull market. Price is pushing up slowly.

US 30 daily analysisMy US 30 daily analysis. Price is on an up trend as to H1 timeframe. It is wise to look for buying opportunities.

US 30 daily analysis My US 30 daily analysis. We may see the price move down to retest one of the two level 33320.7 or level 33116.6 before it push up if the levels don't hold, we will see a strong move down.

US30 trading plan for next week!US30 (D) is moving in an uptrend and now the current price has broken weekly resistance. On the new trading week, it is highly likely that price will drop back to the weekly liquidity zone and daily 20EMA to test this previous resistance zone as support. And upon price action confirmation.
Press the like button if you enjoy this idea :)

US 30 weekly analysisThis is my US 30 weekly analysis. The price is currently at the resistance level. either the price will breakout and push or it will reject and move down,

US 30 daily analysis on H2 chart My US 30 daily analysis on H 2 chart. Price is at the high level at this moment . we therefore may see it move down to the support level before it push up or it can move up fro where it is now .

us30 METEO Hello, Investors following a rigorous analysis I expect this scenario
a possibility of having a manipulation in this area before the fall watch the price action

Us30 Bullish with Potential DrawdownUs30 is bullish but due to Distribution from yesterday leaving a big inefficiency, that could be a potential drawdown for repricing but it is not a must to pull back. If it does not offer me buying opportunities where it is now and it deeps I will be looking for buys after repricing if we start off with manipulating to The downside. Today I would say sit back if not participate with less risk today.

US 30 daily analysisMy US 30 daily analysis on H2 chart. Price is currently at the resistance level. we may see it return down to the support level or the price will breakout and push up.

US30 is preparing for a drop!US30 (4H) has formed a reversal pattern after a fake move to the upside. Price currently has bounced from the monthly Doji and started a local downtrend with bearish price action. There is a possibility for the price to continue to drop it has already grabbed liquidity.

US 30 daily analysisUS 30 daily analysis on H2 chart. The market is still bearish and it look like it will push down if it break the support level, but if not the price will make a U-turn and move up.

US 30 daily analysisMy US 30 daily analysis on H1 chart. The price is at the resistance level as per the higher timeframe. The best thing to do is to wait for a breakout. either from the support level or the resistance level.

US 30 daily analysisMy daily analysis on US 30. Based on the higher timeframe the price is at the resistance level and that. is an area of confluence. The are two things to take place 10 price breaking the resistance level and making move to the up or 2) the price respecting the level and moving down with the selling position.

US30 preparing for another wave up?US30 (D) has formed a weekly narrow doji which is a sign of strong bullish momentum in the market. As the monthly price action is still bullish, the daily trend is still up, there is a probability of another wave up on US30. On the test of the previous resistance as support, based on a lower timeframe bullish price action, a long trade is highly probable.
Thank you for visit this idea, press the like button if you find value in this idea:)

DeGRAM | US30 market previewUS30 reached a major resistance structure zone. Look left, the structure leaves clues.
Price action created a range before, and usually a range acts like a level.
Furthermore, we have a psychological number of 33 000.
A perfect signal to short is going to be a false break.
-------------------
Share your opinion in the comments and support the idea with like. Thanks for your support!
