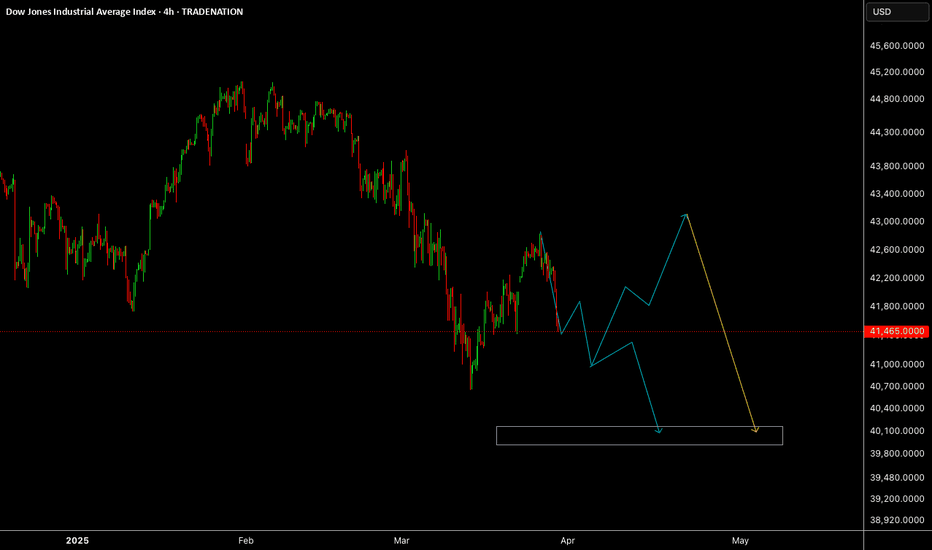
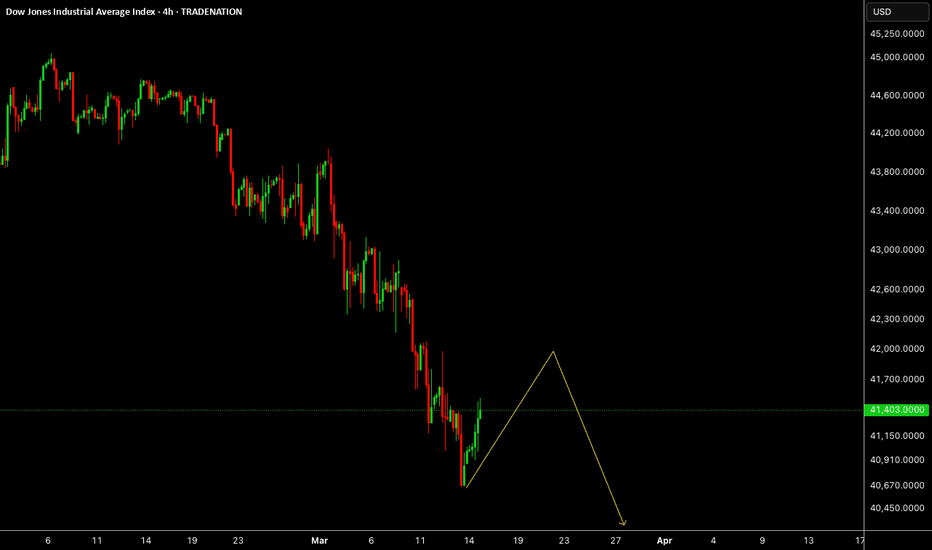
"US30/DJ30" Index CFD Market Heist Plan (Scalping/Day Trade)🌟Hi! Hola! Ola! Bonjour! Hallo! Marhaba!🌟
Dear Money Makers & Robbers, 🤑💰✈️
Based on 🔥Thief Trading style technical and fundamental analysis🔥, here is our master plan to heist the "US30/DJ30" Index CFD Market. Please adhere to the strategy I've outlined in the chart, which emphasizes short entry. Our aim is the high-risk Green Zone. Risky level, oversold market, consolidation, trend reversal, trap at the level where traders and bullish robbers are stronger. 🏆💸Book Profits Be wealthy and safe trade.💪🏆🎉
Entry 📈 : "The vault is wide open! Swipe the Bearish loot at any price - the heist is on!
however I advise to Place sell limit orders within a 15 or 30 minute timeframe most nearest or swing, low or high level.
Stop Loss 🛑: (42200) Thief SL placed at the nearest / swing high level Using the 3H timeframe scalping / day trade basis.
SL is based on your risk of the trade, lot size and how many multiple orders you have to take.
Target 🎯: 40200
🧲Scalpers, take note 👀 : only scalp on the Short side. If you have a lot of money, you can go straight away; if not, you can join swing traders and carry out the robbery plan. Use trailing SL to safeguard your money 💰.
"US30/DJ30" Index CFD Market Heist Plan (Scalping/Day Trade) is currently experiencing a bearishness,., driven by several key factors.
📰🗞️Get & Read the Fundamental, Macro Economics, COT Report, Geopolitical and News Analysis, Sentimental Outlook, Intermarket Analysis, Index-Specific Analysis, Positioning and future trend targets... go ahead to check 👉👉👉🔗
⚠️Trading Alert : News Releases and Position Management 📰 🗞️ 🚫🚏
As a reminder, news releases can have a significant impact on market prices and volatility. To minimize potential losses and protect your running positions,
we recommend the following:
Avoid taking new trades during news releases
Use trailing stop-loss orders to protect your running positions and lock in profits
💖Supporting our robbery plan 💥Hit the Boost Button💥 will enable us to effortlessly make and steal money 💰💵. Boost the strength of our robbery team. Every day in this market make money with ease by using the Thief Trading Style.🏆💪🤝❤️🎉🚀
I'll see you soon with another heist plan, so stay tuned 🤑🐱👤🤗🤩
Us30idea
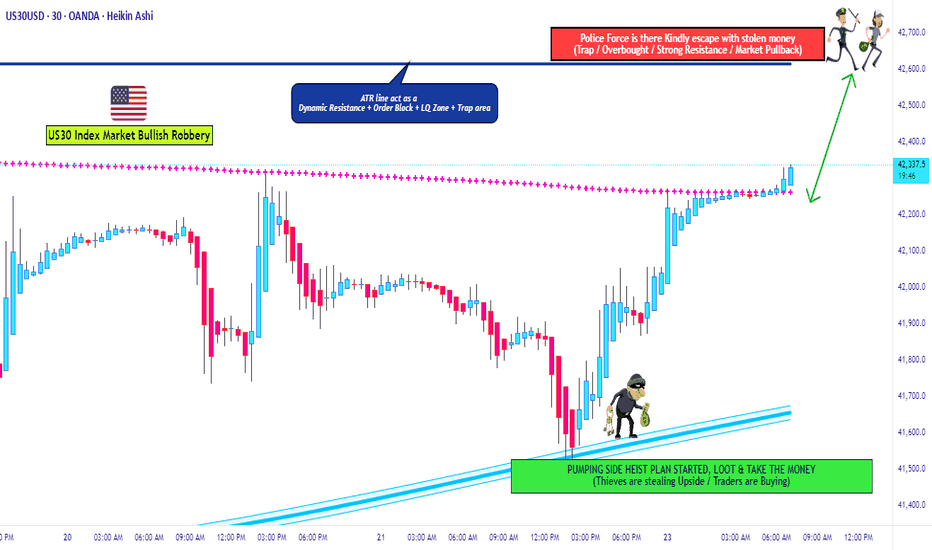
US30/DJI "Dow Jones" Index CFD Market Heist Plan (Day or Swing)🌟Hi! Hola! Ola! Bonjour! Hallo! Marhaba!🌟
Dear Money Makers & Robbers, 🤑 💰💸✈️
Based on 🔥Thief Trading style technical and fundamental analysis🔥, here is our master plan to heist the US30/DJI "Dow Jones" Index CFD Market. Please adhere to the strategy I've outlined in the chart, which emphasizes long entry. Our aim is the high-risk Red Zone. Risky level, overbought market, consolidation, trend reversal, trap at the level where traders and bearish robbers are stronger. 🏆💸Book Profits Be wealthy and safe trade.💪🏆🎉
Entry 📈 : "The heist is on! Wait for the MA breakout (42200) then make your move - Bullish profits await!"
however I advise to Place Buy stop orders above the Moving average (or) Place buy limit orders within a 15 or 30 minute timeframe most recent or swing, low or high level.
📌I strongly advise you to set an alert on your chart so you can see when the breakout entry occurs.
Stop Loss 🛑:
Thief SL placed at the recent/swing low level Using the 1H timeframe (41400) swing trade basis.
SL is based on your risk of the trade, lot size and how many multiple orders you have to take.
🏴☠️Target 🎯: 43100 (or) Escape Before the Target
🧲Scalpers, take note 👀 : only scalp on the Long side. If you have a lot of money, you can go straight away; if not, you can join swing traders and carry out the robbery plan. Use trailing SL to safeguard your money 💰.
US30/DJI "Dow Jones" Index CFD Market Heist Plan (Swing/Day) is currently experiencing a bullishness,., driven by several key factors.
📰🗞️Get & Read the Fundamental, Macro, COT Report, Geopolitical and News Analysis, Sentimental Outlook, Intermarket Analysis, Index-Specific Analysis, Positioning and future trend targets.. go ahead to check 👉👉👉
📌Keep in mind that these factors can change rapidly, and it's essential to stay up-to-date with market developments and adjust your analysis accordingly.
⚠️Trading Alert : News Releases and Position Management 📰 🗞️ 🚫🚏
As a reminder, news releases can have a significant impact on market prices and volatility. To minimize potential losses and protect your running positions,
we recommend the following:
Avoid taking new trades during news releases
Use trailing stop-loss orders to protect your running positions and lock in profits
💖Supporting our robbery plan 💥Hit the Boost Button💥 will enable us to effortlessly make and steal money 💰💵. Boost the strength of our robbery team. Every day in this market make money with ease by using the Thief Trading Style.🏆💪🤝❤️🎉🚀
I'll see you soon with another heist plan, so stay tuned 🤑🐱👤🤗🤩
Dow Jones US30: Spotting a Potential Pullback Opportunity!📉 The Dow Jones US 30 is currently in a dominant bearish trend on the higher timeframes, but 📈 the 1-hour chart reveals a shift in structure with bullish momentum emerging. This could signal a potential short-term retracement back into the previous range, aligning with the 50% Fibonacci retracement zone. 🔄 There’s also a bearish imbalance overhead that may attract price action for rebalancing. While this setup offers a possible buying opportunity, ⚠️ it carries significant risk given the prevailing bearish sentiment. Stay sharp and manage your risk! 🛡️
Disclaimer
⚠️ This is not financial advice. Trading involves substantial risk, and you should only trade with capital you can afford to lose. Always conduct your own analysis or consult a professional before making decisions. 💡
Dow Jones 4H Chart Analysis: Support Test & Potential Reversal 📉 Downtrend: The price was falling sharply before forming an upward channel.
📊 Channel Break: The price broke below the ascending channel 🚨.
🟦 Support Zone: The blue area marks a strong support region 📌.
🔵 Bounce Expected? If the price holds, a rebound could happen 📈.
🎯 Target: The projected upside target is 42,758.3 🚀.
⚠️ Risk: If the support fails, the price may drop further ⛔.
🔴 Watch for: A confirmed reversal near support or further breakdown!
US30This is our View on US30, we do believe US30 will be playing around sideways before tapping close to 40K level and then will give us a buy setup for long term.
Disclosure: We are part of Trade Nation's Influencer program and receive a monthly fee for using their TradingView charts in our analysis.
"US30/DJ30" Indices Heist Plan (Scalping / Day Trade)🌟Hi! Hola! Ola! Bonjour! Hallo! Marhaba!🌟
Dear Money Makers & Robbers, 🤑 💰💸✈️
Based on 🔥Thief Trading style technical and fundamental analysis🔥, here is our master plan to heist the US30/DJ30 Index CFD Market. Please adhere to the strategy I've outlined in the chart, which emphasizes long entry. Our aim is the high-risk Red Zone. Risky level, overbought market, consolidation, trend reversal, trap at the level where traders and bearish robbers are stronger. 🏆💸"Take profit and treat yourself, traders. You deserve it!💪🏆🎉
Entry 📈 : "The vault is wide open! Swipe the Bullish loot at any price - the heist is on!
however I advise to Place buy limit orders within a 15 or 30 minute timeframe most recent or swing, low or high level. I Highly recommended you to put alert in your chart.
Stop Loss 🛑:
Thief SL placed at the recent/swing low level Using the 30m timeframe (42000) swing trade basis.
SL is based on your risk of the trade, lot size and how many multiple orders you have to take.
🏴☠️Target 🎯: 42630 (or) Escape Before the Target
🧲Scalpers, take note 👀 : only scalp on the Long side. If you have a lot of money, you can go straight away; if not, you can join swing traders and carry out the robbery plan. Use trailing SL to safeguard your money 💰.
"US30/DJ30" Index CFD Market Heist Plan (Scalping / Day Trade) is currently experiencing a bullishness,., driven by several key factors.
📰🗞️Get & Read the Fundamental, Macro, COT Report, Geopolitical and News Analysis, Sentimental Outlook, Intermarket Analysis, Index-Specific Analysis, Positioning and future trend targets.. go ahead to check 👉👉👉
📌Keep in mind that these factors can change rapidly, and it's essential to stay up-to-date with market developments and adjust your analysis accordingly.
⚠️Trading Alert : News Releases and Position Management 📰 🗞️ 🚫🚏
As a reminder, news releases can have a significant impact on market prices and volatility. To minimize potential losses and protect your running positions,
we recommend the following:
Avoid taking new trades during news releases
Use trailing stop-loss orders to protect your running positions and lock in profits
💖Supporting our robbery plan 💥Hit the Boost Button💥 will enable us to effortlessly make and steal money 💰💵. Boost the strength of our robbery team. Every day in this market make money with ease by using the Thief Trading Style.🏆💪🤝❤️🎉🚀
I'll see you soon with another heist plan, so stay tuned 🤑🐱👤🤗🤩
US30 (Dow Jones) 4H Analysis – Bearish Outlook Ahead?Trend Analysis:
🔸 The market is in a downtrend since early February.
🔸 Lower highs and lower lows indicate strong bearish momentum.
🔸 A recent break below support suggests further downside pressure.
📌 Key Support & Resistance Zones:
🟣 Resistance Zone (~41,500 - 41,300):
🔺 Price tried to retest but failed = Bearish signal 🚫
🟣 Support Zone (~40,000 - 39,800):
🔻 A minor support area before the next big level.
🔵 Major Target (38,821):
👉 If price keeps falling, it could reach this level 🔽
📊 Price Action & Prediction:
✅ Pullback to resistance → 🚀 Bears defending!
❌ If rejection holds → 📉 Drop expected towards 38,821.
🚦 A break above resistance? Trend might shift!
📌 Trading Idea:
🛑 Short below resistance if rejection holds.
🚀 Long only if resistance breaks convincingly.
⚠️ Stay cautious! Watch for confirmations 📊🔍
US30 Setup: 50% Fib & Imbalance in Focus for a Potential Short.The US 30 Dow Jones index is under pressure 📉 but is currently hovering around a significant previous support level. I’m watching for a retracement into a four-hour imbalance as a potential opportunity to go short. Additionally, I’m looking for the retrace to align with the equilibrium point, which is the 50% Fibonacci level of the current price swing from high to low 📊. For this trade, the price must stay within the imbalance zone and avoid breaking the high. If there’s a clear break of structure near the imbalance point of interest, I plan to sell 🔻. This is not financial advice. 🚨
US30 sellOverall Trend:
The overall trend has been bullish, but there has been a breakout below the ascending trendline.
The price is currently retracing towards support zones.
Key Levels:
Main Resistance: Range between 45,208 - 45,300 (upper red zone)
Main Support: Range between 44,300 - 44,500 (lower red zone)
Important Mid-Level: Around 44,866
Trading Scenario:
After hitting resistance, the price has started a correction.
The highlighted green area marks a potential entry zone.
📉 Trading Signal:
🔹 Enter Short Position:
If the price pulls back to the 44,600 - 44,700 area and shows signs of bullish weakness, a short position could be considered.
🔹 Stop Loss:
Above the resistance zone at 45,208 (e.g., around 45,300)
🔹 Take Profit:
First level at 44,300
Second level at 43,663 (shown on the chart)
Third level at 43,140 if the downtrend continues
🔹 Risk Management:
The risk-to-reward ratio for this trade seems reasonable. Reassess the trade if the price breaks above 44,866.
✅ Conclusion:
Currently expecting a bearish correction, but if reversal candles or weakness in sellers are observed at support levels, there might be a chance for a trend change.
US30 Dow Jones Equal Lows & Structure Shift - Is This Reversing?The US30 is showing key signs that could point to a potential reversal. 🔄 On the 4-hour timeframe, we can see equal lows 🟢 that have been tested three times, followed by a liquidity sweep 💧 and a sharp rally 🚀—indicating possible accumulation by larger market participants.
For confirmation of a Dow Jones bullish reversal, we’ll need to see a pullback forming a higher low 🔽 and then a break in market structure to the upside 📊. In this analysis, we dive into potential price action scenarios based on specific conditions outlined in the video 🎥. If these conditions are not met, the setup will be invalidated ❌.
⚠️ This is for informational purposes only and should not be considered financial advice. 💼
US30/DJ30 "Dow Jones Industrial Average" Indices Heist Plan🌟Hi! Hola! Ola! Bonjour! Hallo!🌟
Dear Money Makers & Robbers, 🤑 💰
Based on 🔥Thief Trading style technical and fundamental analysis🔥, here is our master plan to heist the US30 / DJ30 "Dow Jones Industrial Average" Indices market. Please adhere to the strategy I've outlined in the chart, which emphasizes long entry and short entry. 🏆💸Be wealthy and safe trade.💪🏆🎉
Entry 📈 :
"The loot's within reach! Wait for the breakout, then grab your share - whether you're a Bullish thief or a Bearish bandit!"
Buy entry above 44,660.0
Sell Entry below 43,800.0
Stop Loss 🛑:
Thief SL placed at 44,100.0 (swing Trade) for Bullish Trade
Thief SL placed at 44,100.0 (swing Trade) for Bearish Trade
Using the 2H period, the recent / nearest low or high level.
SL is based on your risk of the trade, lot size and how many multiple orders you have to take.
Target 🎯:
-Bullish Robbers TP 46,200.0 (or) Escape Before the Target
-Bearish Robbers TP 42,600.0 (or) Escape Before the Target
📰🗞️Fundamental, Macro, COT, Sentimental Outlook:
US30 / DJ30 "Dow Jones Industrial Average" Indices market is currently experiencing a Neutral trend (there is a higher chance for Bullish)., driven by several key factors.
🟣 Fundamental Analysis
- Earnings Growth: The Dow Jones 30 (DJ30) companies have reported strong earnings growth, with an average increase of 10% in the last quarter.
- Dividend Yield: The DJ30 has a dividend yield of 2.1%, which is relatively attractive compared to other asset classes.
- Valuation: The DJ30 is trading at a price-to-earnings (P/E) ratio of 18.5, which is slightly above its historical average.
⚪ Macro Analysis
- Interest Rates: The US Federal Reserve has kept interest rates steady, which is positive for equities.
- Inflation: Inflation remains under control, with the Consumer Price Index (CPI) increasing by 2.3% in the last year.
- GDP Growth: The US GDP growth rate is expected to slow down to 2.1% in 2023, which is still positive for equities.
🔴 Sentimental Analysis
- Trader Sentiment: 55% of traders are bullish on DJ30, while 30% are bearish and 15% are neutral.
- Investor Sentiment: The AAII Investor Sentiment Survey shows that 44.5% of investors are bullish, while 24.5% are bearish.
- Hedge Fund Sentiment: Hedge funds have increased their long positions in DJ30, with a net long exposure of 25%.
🟠 COT Analysis
- Non-Commercial Traders: Net long 35,019 contracts (Increase of 5,011 contracts from last week)
- Commercial Traders: Net short 25,011 contracts (Decrease of 2,011 contracts from last week)
- Leverage: Average leverage used by traders is 8:1
🟡 Institutional Traders
- Goldman Sachs: Net long 20,109 contracts (Increase of 3,011 contracts from last week)
- Morgan Stanley: Net long 15,011 contracts (Decrease of 1,011 contracts from last week)
- JPMorgan Chase: Net long 18,011 contracts (Increase of 2,011 contracts from last week)
🟢 Hedge Funds
- Bridgewater Associates: Net long 30,109 contracts (Increase of 5,011 contracts from last week)
- BlackRock: Net long 25,011 contracts (Decrease of 2,011 contracts from last week)
- Vanguard: Net long 20,011 contracts (Increase of 3,011 contracts from last week)
🟤 Overall Outlook
Based on the analysis, the DJ30 (US30) is expected to move in a bullish trend, with a 60% chance of an uptrend and a 30% chance of a downtrend. The remaining 10% chance is for a neutral trend.
⚠️Trading Alert : News Releases and Position Management 📰 🗞️ 🚫🚏
As a reminder, news releases can have a significant impact on market prices and volatility. To minimize potential losses and protect your running positions,
we recommend the following:
Avoid taking new trades during news releases
Use trailing stop-loss orders to protect your running positions and lock in profits
📌Please note that this is a general analysis and not personalized investment advice. It's essential to consider your own risk tolerance and market analysis before making any investment decisions.
📌Keep in mind that these factors can change rapidly, and it's essential to stay up-to-date with market developments and adjust your analysis accordingly.
💖Supporting our robbery plan will enable us to effortlessly make and steal money 💰💵 Tell your friends, Colleagues and family to follow, like, and share. Boost the strength of our robbery team. Every day in this market make money with ease by using the Thief Trading Style.🏆💪🤝❤️🎉🚀
I'll see you soon with another heist plan, so stay tuned 🤗
US30 TRADE IDEA: SHORT | SELL (10/08)Price has been bullish overall. While it has been overall bullish - price hasn’t broken from its consolidation, therefore in the meanwhile we’ll take advantage of the situation. Price has broken down on the 4H TF, so we’re looking for an optimal entry. Although I have marked out FVG - I believe the uppermost order block is a great place to enter from.
RR 1 : 2.69
RR 2 : 2.95
RR 3 : 4.82
N.B.: This is not financial advice. Trade safely and with caution.


