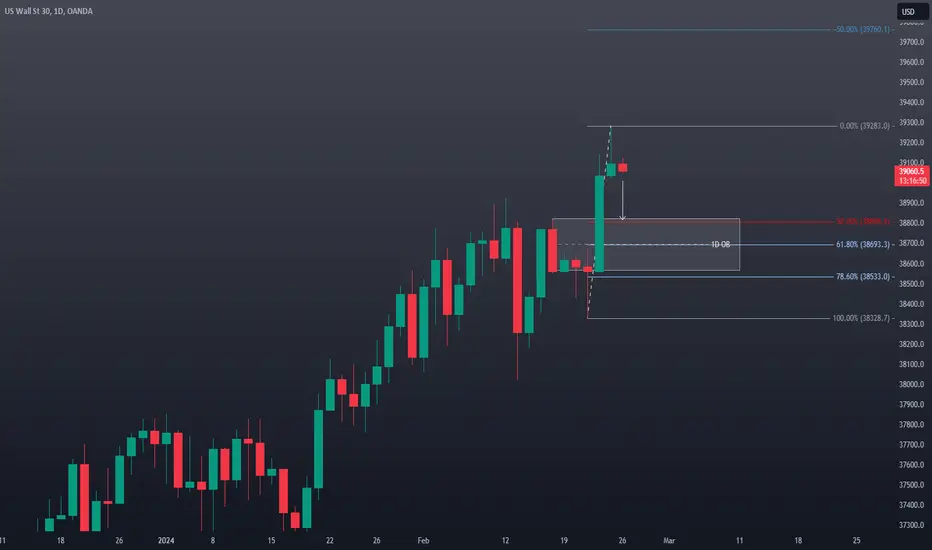
US30 Bulls still holding strong (buys potentially from 39400.0)US30 remains in a strong bullish stance, and I'm still on the lookout for long opportunities. Last week, we witnessed a retracement in price to fill the previous imbalance, although some imbalances remain. This was adequate for initiating a new rally, as we're currently observing.
Now, I anticipate two possibilities: either price will break past the newly formed high, or it will retrace to address a significant demand level. In the event of a retracement to the demand level, I'll wait for lower timeframe confirmation before preparing long setups, targeting either new highs or significant liquidity points.
Confluences for US30 Buys are as follows:
- Price broke structure to the upside once again.
- Lower and higher time frame remains extremely bullish.
- Clean nearby demand zone on the 18hr or 21hr.
- New high is close by which is a strong level of liquidity tat is lying there.
- After this imminent retracement we can expect a new rally.
P.S. I strongly favor the bullish trend due to several recent breaks of new highs. Additionally, there are several demand zones that have yet to be mitigated. However, given the impulsive nature of price movements, I wouldn't be surprised if we witness further upward momentum, potentially breaking the high once again.
Have a great trading week guys!
Us30index

US30 remains bullish ( 39200.0 or 38800.0 longs?)This week, I'm bullish on US30. I'm waiting for a pullback followed by a re-accumulation within the demand zone. Once I receive confirmation on the lower time frame, specifically in the 21-hour or 18-hour demand zone, I'll consider taking long positions along the trend.
With the recent breach of all-time highs and significant bearish momentum, there's a possibility of price dipping further to capture liquidity and address imbalances before initiating a new upward rally.
Confluences for US30 Buys are as follows:
- Price broke structure to the upside once again.
- Lower and higher time frame remains extremely bullish.
- Two clean demand zones that have caused BOS to the upside.
- Imbalances left above that need to get filled before price comes in to zone
- After this imminent retracement we can expect a new rally.
P.S. If the price declines and breaches my Points of Interest (POIs), I won't be surprised. Since price has absorbed all liquidity to the upside, a decrease in bullish pressure is possible. With major news behind us, the trading week ahead appears promising!
Have a great trading week guys and lets catch those pips!

US30 Pair : US30 Dow Jones
Description :
Completed " 12345 " Impulsive Waves
RSI - Divergence
Break of Structure
Bullish Channel as an Corrective Pattern in Short Time Frame
Impulse Correction

US30 - DOW JONES INDUSTRIALS AVERAGE US30 has been in a major bearish divergence from Jan 2018, I think march 2024 will be a month of correction (10%-15%) and then a pickup from April 2024 all the way to September/October when I think the market will hit the top for the US30 that will be around $44,200.
- Monthly MACD (Bearish)
- Monthly Pekipek's Divergence BETA (Bearish)
- Monthly RSI (Bullish)
- Monthly Stochastic RSI (Bearish)

Dow Jones / US30This Is My Anticipation On The Us30, Hopefully We See A Low Of The Week Formed On The Daily Mitigation Block And We Get A Change In State Of Delivery Bullishly On The H1 To Confirm The Bias I Hold Already.

US30 DOW JONES Technical Analysis and Trade IdeaThe US30 has enjoyed a robust bullish run, but recent price action on the 1D and 4H charts indicates potential weakness. I'm anticipating a **sell opportunity** should we observe a decisive break below the current range low, followed by a retest and failure of that level. Potential targets for this trade would align with prior 1D accumulation range highs.
Remember that trading carries inherent risk. Before executing any trades, it's vital to conduct your own extensive research. Consider both fundamental market drivers and global macroeconomic conditions alongside your technical analysis. Always implement sound risk management practices to safeguard your investment.
**Disclaimer**: This analysis presents a technical viewpoint on the US30. It should not be interpreted as investment advice. Base your trading decisions on your own risk profile, comprehensive market research, and a thorough assessment of all relevant variables.
US30/USD Longs from 38600.0My bias remains strongly bullish for US30 this week. We've witnessed another significant break in structure to the upside, accompanied by robust bullish momentum, reinforcing the prevailing trend. I anticipate a retracement back to a demand level to sustain this upward movement.
Upon reaching the daily demand zone, I'm eyeing a refined 10-hour demand zone for a potential bullish reaction. Additionally, I'll be on the lookout for a Wyckoff accumulation pattern within this area
My confluences for US30 Buys are as follows:
- Price broke structure to the upside once again leaving a clean daily demand.
- Overall trend and the current trend remain to be very bullish.
- Candlestick anatomy also shows that bulls remain stronger than bears.
- Can expect a pullback to mitigate the levels of demand.
- Wick left to the upside that needs to get filled and price has been moving impulsively.
P.S. We observed a minor sell-off two weeks ago, followed by a resurgence that breached the previous high. Currently, I'm not actively seeking selling opportunities. However, I wouldn't be surprised if price establishes a supply zone, offering a chance to sell back towards the marked demand zone.

US30 Longs from 38200.0 or 37600.0 back upMy bias for US30 this week remains bullish, especially after it broke structure to the upside following the NFP release. This breakout formed a new demand zone, providing potential buying opportunities. Alternatively, if price doesn't respect this zone, it may decline further to breach the trendline near Point (A) POI and then reach the 3hr demand zone beneath it.
Currently, I anticipate a correction and pullback to facilitate the formation of a Wyckoff accumulation pattern within these zones. Once price shows signs of slowing down and demonstrates a clear change of character to the upside on lower time frames, I will start considering buy positions.
Confluences fro US30 buys are as follows:
- Price broke structure to the upside once again to the upside leaving a new 6hr demand zone.
- Liquidity left in the form of a wick above and price looks like it will undergo a retracement.
- Overall market structure on the lower and higher time frame still remains bullish as well.
- Sentiment analysis also shows US30 to be VERY bullish.
- Candlestick anatomy still shows how strong the bulls are in this market.
P.S. It's intriguing to observe the strong bullish momentum in US30. However, I remain cautious not to solely concentrate on buying opportunities, as I acknowledge the possibility of the bullish pressure waning and US30 transitioning into a possible bearish trend. REMEMBER TO ALWAYS BE ADAPTIVE!
Have a great trading week guys and lets catch these pips!

US30 longs from 38000.0 back upGiven the strong bullish sentiment in US30 this week, the plan is to continue trading in line with the current trend. With recent price action breaking structure to the upside, it has formed a clear 9-hour demand zone. I'll be patiently waiting for a Wyckoff accumulation within this zone.
Once this accumulation pattern confirms on the lower time frames, I'll be keen on taking long positions, especially considering it aligns with a psychological level at 38000.0. Additionally, this zone has demonstrated an impulsive move, leading to a Break of structure (BOS). I anticipate this move to propel US30 to establish new highs.
Confluences for US30 Sells are as follows:
- Price has been overall bullish short term and long term so this is a pro trend idea.
- The 9-hour demand zone has caused a break of structure to the upside.
- There's some liquidity left to the upside that can be taken. Looking at the candle stick anatomy bulls are still looking more dominant.
- I anticipate a Wyckoff accumulation to occur during the ongoing pullback
- Sentiment analysis also sees US30 to be very bullish which is another confluence.
P.S. Given my strong bullish sentiment and the diminishing strength of bears, I wouldn't be astonished if price reverses. This market has been remarkably bullish for quite some time, so a reversal might occur to fill in imbalances or sweep liquidity left below.

US30 Longs from 37600.0 or 37300.0 back upUS30 recently broke out of its ranging zone, achieving new all-time highs and confirming an extremely bullish trend. This further strengthens the prevailing idea, prompting us to adapt and seek opportunities for buying to continue the upward trend.
We've identified two demand zones—one on the two-hour timeframe, close to the current price, and another (10hr) below, which is considered more ideal. The latter broke structure on a higher timeframe, swept liquidity, and is within the 0.78 fib range. I'll be patiently waiting for either of these two zones to explore potential buying opportunities.
Confluences for US30 Buys are as follows:
- Price needs to dip to a significant demand level for an upward rally to persist.
- The market trend is long-term bullish, aligning with this idea.
- New demand zones have been left on the (10hr & 2hr) which caused a BOS on the HTF.
- Price has taken ATHs confirming the bullish trend.
- Price has broken significant structure to the upside also reinforcing this idea.
- Imbalances below that need to get filled as well so a potential pullback does make sense.
P.S. Despite the prevailing bullish trend, it's crucial not to have tunnel vision and overlook the possibility of a bearish bias. With price absorbing all liquidity to the upside, there's a chance for a melt-off, potentially breaking through my demand zones and reaching the equal lows below them.

US30 IndexPair : US30 Index
Description :
Impulse Correction " ABC " Impulse Completed. Rejecting from the Strong Resistance Level. Completed " 1234 " Impulsive Waves in Short Time Frame. Rising Wedge as an Corrective Pattern in Long Time Frame , Wait for the Proper Rejection / Breakout

Probably correction is waiting for Dow JonesHello guys,
The Dow Jones recently broke through its all-time high.
My prediction is that at least for the short term, there is a correction ahead of the Dow Jones.
After correction, you can think about buying in the specified areas.
long at current prices is very very dangerous, Take care.

US30 TECHNICAL ANALYSISHere I provide my technical analysis for us30 and I will be looking for an easy and straight forward break and retest for my key levels.

US30 DOW JONES Technical Analysis And Trade Idea The US30 has exhibited a strong upward movement, recently reaching a significant resistance level on both the daily and weekly charts. This video provides a detailed analysis of this trend, meticulously examining price movements and identifying possible trading opportunities by thoroughly assessing multiple timeframes, ranging from weekly to as short as 15 minutes. Anticipate an in-depth review covering price variations, market trends, trend evaluations, and crucial technical analysis components. It's crucial to emphasize that the insights shared here are purely educational and should not be interpreted as financial advice.

US30US30 trading in a range and I will be waiting for a breakout for both sides of the rectangle pattern which is now in play.

US30USD ShortThe price is on a ranging mode, as indicated in the chart and we will wait until the index shows an opportunity in trading.
Meanwhile, my perspective as for now is that the price might fill in the imbalances caused by the bullish market earlier on and my target would be 35960

US30USD ShortWell, the price has broken the resistance zone aggressively, and I anticipate that the price will continue with bearish momentum.

US30/USD Longs from 36000.0 up to 36750.0US30 has followed the anticipated trajectory, and I foresee it reaching all-time highs (ATHs) very soon. However, given the recent impulsive upward movement in price, a pullback is likely imminent. This presents an opportunity for us to capitalize on, considering the presence of an 8-hour demand zone where the price could retreat to, regaining bullish momentum for another rally.
Conversely, there's also a possibility of the price surging directly into our daily supply zone, prompting a bearish reaction. While I anticipate the eventual failure of the daily supply, I can foresee price declining from that zone, providing potential selling opportunities.
Confluences for US30 Buys are as follows:
- Price has been impulsively bullish to the upside carrying lots of momentum.
- Overall trend on the higher time frame and lower time frame both show a bullish trend.
- Price left an 8hr demand zone for us to take buys from up to the ATH's
- Due to recent impulsive upward movements, a pullback in price is imminent.
- For the price to gather sufficient strength to reach all-time highs (ATHs), it must retrace back to a nearby demand zone.
P.S. As the price approaches all-time highs (ATHs), it wouldn't be surprising to witness a consolidation. In such a scenario, I anticipate a significant reaction from the daily supply, given its HTF significance. Conversely, should the price quickly exceed the latest supply zone, choosing buy positions would be a more feasible approach.
HAVE A GREAT TRADING WEEK AHEAD!

US30/USD Shorts to 32600.0 US30 has recently broken structure to the downside on the higher time frame indicating it wants to continue in its bearish trend however, I believe it will not hold for too long as the over all market is bullish. In terms of current price action I'm expecting for price to continue going down a bit towards the 32600.0 mark.
Scenario (A) is Selling from the current price as it has tapped in a 22hr supply zone that has caused a BOS to the downside. Now price has retraced back into it, wyckoff distribution has played out for us to take sells from the supply we are in. Once we get to the target we can wait for price to show us its hands to decide if we can buy back up to another supply or not.
Scenario (B) would be waiting for price to push higher and take out our current supply zone and eventually tap into the 4hr above where better premium prices are. Not only did it cause a change of character but it also has imbalances below it which is a good sign of that zone being respected. Then we will wait for our lower time frame confirmation in the form of a re distribution and an another CHOCH to sell down towards our designated target of 32600.0
My confluences for US30 shorts are as follows:
- The market has broken structure to the downside on the higher timeframe.
- Price has tapped into a good supply zone (22hr) that has also caused a BOS.
- Wyckoff distribution has taken place and has changed character leaving a good price to sell from.
- There's loads of liquidity to the downside we can target in the form of equal lows, trendline and imbalances.
- The dollar is currently bullish and has been very strong recently so I am expecting this pair to drop more to the downside.
P.S. this is just a short term idea for US30's current market conditions however we have to be cautious when trading this week as there is FOMC on Wednesday and NFP on Friday so trade safe and have a wonderful week ahead!

US30 Long Term selling Trading IdeaHello Traders
In This Chart EURJPY HOURLY Forex Forecast By FOREX PLANET
today EURJPY analysis 👆
🟢This Chart includes_ (EURJPY market update)
🟢What is The Next Opportunity on EURJPY Market
🟢how to Enter to the Valid Entry With Assurance Profit
This CHART is For Trader's that Want to Improve Their

US30 Analysis H1Here is my analysis for US30 on H1 using Order Block. The price could go bearish, you can put a pending order on the Order block or find an entry on LTF within OB Zone. Trade Safe!

DOW JONES US30 :BULLS DEFENDING THEIR ZONEThe Dow closed 540 points higher on Friday, while the S&P 500 and Nasdaq 100 were up 1.8% and 2.2%, respectively, boosted by a sharp rebound in regional banks and solid jobs report that tempered fears of a recession. PacWest and Western Alliance rebounded sharply by 81.7% and 49.3%, leading regional banks’ gains after JPMorgan upgraded Western Alliance, Zions Bancorp and Comerica in a note and stated the three banks appear “substantially mispriced” in part due to short-selling activity. Also, investors welcomed positive earnings from Apple, pushing its stock up 4.7%. On the data front, the US nonfarm payrolls and wage growth accelerated more than expected in April indicating that the US economy remains strong, challenging the expectation that the Federal Reserve rate-hike cycle would end. On a weekly basis, the Dow and S&P 500 lost 1.5% and 0.9%, while Nasdaq gained 0.1% and hit its 37-week high.
Technical
(1) 31500 and 32615 are the next possible buying zones where Bulls will attack the Bears. The Maket Bias is Bullish, but the momentum is slowing down....(profit taking)
Inceasing volume and higher momentum will bring back the DOW to 34597 (1) .
The volume has more powerfull shifts, meaning that more participants start to push DOW higher.
In case the Bulls hold this zone the next taget will be 35659 ( 2) and then 36968 (3)
FED´s Plan could send DOW 45099( Target1) probably in 2nd Quarter 2024
and to 54695 (Target2) in 2025-2026
(4) Profit Taking over the weekend could send DOW at the beginning of the next week to 32473.
(5) In case the Maket loses this zone the next retracement aea will be 31464
(6) Last Resort: Eveything below 31287 will be the last chance for the Bulls to defend their positions
30880
30332
29164
28651
SHORT SET-Up:
If the Market breaks this area ,then the Bears will aggessively take control over the market.
The pice will soar to around 24000 very fast ( See 7)
and losing that zone will bring Dow back to
22598
and then
20593 (See 8)

US30 Market BreakdownAs seen.
I am overall bullish.
So I follow what the market says.
I see:
- Choch in favor of bulls
- Liquidity to be taken in favor of bulls
- FVG to be filled
- OB in favor of bulls
I predict:
- Movement (1), (2) or (3):
Movement (1): Market will take on liquidity (2), fill the FVG and/or reach until the OB to continue rising.
Movement (2): Price will take on liquidity (1) creating a BOS and then falls until FVG and/or OB to continue rising.
Movement (3): shoot straight up
