US30 top-down analysisHello traders, this is a complete multiple timeframe analysis of this pair. We see could find significant trading opportunities as per analysis upon price action confirmation we may take this trade. Smash the like button if you find value in this analysis and drop a comment if you have any questions or let me know which pair to cover in my next analysis.
Us30long

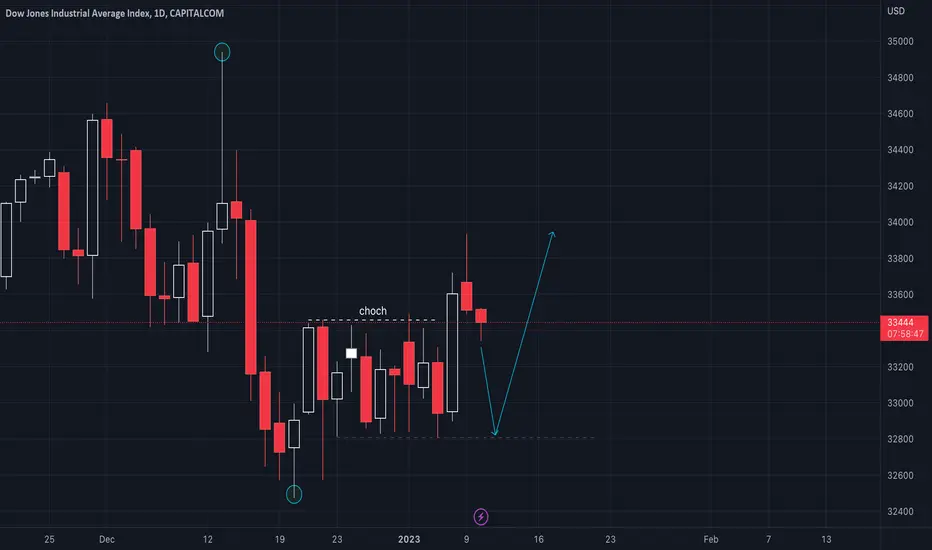
US30 possible buy zone! US30
Possible direction : Bullish
Technical Analysis : With weakening of DXY, US30 , after long consolidation on the 4h timeframe, has broken out of reversal pattern from a month support level with multiple liquidity grab, US30 prepared for a bigger move to the upside.
As the price already created an impulse, it is highly likely US30 will drop for a deeper retracement to at least to the previous resistance turns support. After rejection, a buy trade is high probable.
Possible trade recommendation : Bullish as per sketch
Press like button if you enjoy.
Risk Disclaimer: Trading foreign exchange on margin carries a high level of risk, and is not suitable for all investors. Past performance is not indicative of future results. The high degree of leverage is dangerous and can work against you as well as for you. Before deciding to invest in foreign exchange or any market you should carefully consider your investment goals, level of experience, and risk tolerance. It is EXTREMELY LIKELY that you will sustain a loss of some or all of your initial investment and therefore you should not invest money that you cannot afford to lose. No representation is being made that any account will or is likely to achieve profits or losses. Past performance is not indicative of future results. Individual results vary and no representation is made that clients will or are likely to achieve profits or incur losses comparable to those that may be shown. You acknowledge and agree that no promise or guarantee of success or profitability has been made between you, and Forex Trading Wizard. Do your own research and talk to a professional financial planner in order to be aware of all the risks associated with foreign exchange trading and investing and seek advice from an independent financial advisor before risking any capital.

US30-Long-what do you all think ?Dear Traders, US30 we have surpassed the distribution phase and right now we have solid platform of price structure to go long. An ideal entry would be at retesting the future OB after breaking the previous HIGHS were price failed to break. US30 in our opinion is bullish long term and our current target is 36000!
Comment down your views!!

US30 top-down analysisHello traders, this is a complete multiple timeframe analysis of this pair. We see could find significant trading opportunities as per analysis upon price action confirmation we may take this trade. Smash the like button if you find value in this analysis and drop a comment if you have any questions or let me know which pair to cover in my next analysis.

US30USD LongThere is the formation of a bearish channel, according to the 15m and 4H time frames.The signal has touch the lower trendline of the channel and I do anticipate that the price will continue with the bullish momentum.
Entry price is 32720, SL at 32500 and target is 33370.
My R:R for this trade is 1:3
Remember, risk only 1-2% of your account!

US30 outlooksince dxy fell a decent amount from the news us30 should make a slight push up b4 making a move down
the 1hr already showing a nice symmetrical pattern so im loooking for the sell setup but there is upside for the short term
tdi is in bearish area as well

US30 ( High Probability BUY Setup SOON )* Here we can see clearly the near formation of a Bullish Head & Shoulder Reversal Pattern ( VvV )
* Closed the day little net changed,
* An overnight negative theme in Equities has led to a lower open today,
* Bespoke support is located at 32603,
* We can see clearly the Strong Bullish Divergence on the RSI Indicator, as an extra Confluences of our analysis,
* We're using H2 time frame for a clearer view of our analysis, hence we can't predict the duration of our move to happen,
* We've got our EP ( Blue Line ) & our TP ( Golden Lines ),
* Keep a close eye on U.S. indices this coming days & weeks,
* Happy pip hunting traders,
* FX KILLA.

US30 3 buying opportunities US30 has made a major decline in the last week with CPI news, I’m looking for buy opportunities but if support is broken we can see a major fall to next support, till then I’m on the the sidelines to buy when support is reached.

US30 BULLISH PREDICTIONUS30 about to reverse from here as expected (the news is coming of usd in next 5 mins and it may bring us30 back to the bullish level.
always enter after confirmation.
i am not your investment advisor.

US30 selloff to stall at current levels?DOW30 - Intraday - We look to Buy at 32960 (stop at 32760)
Bespoke support is located at 32960.
Bespoke support is located at 32940.
Majority of the initial daily losses being recaptured.
There is scope for mild selling at the open but losses should be limited.
A Fibonacci confluence area is located at 32960.
Our profit targets will be 33475 and 33690
Resistance: 33475 / 33630 / 34130
Support: 32960 / 32940 / 32890
Risk Disclaimer
The trade ideas beyond this page are for informational purposes only and do not constitute investment advice or a solicitation to trade. This information is provided by Signal Centre, a third-party unaffiliated with OANDA, and is intended for general circulation only. OANDA does not guarantee the accuracy of this information and assumes no responsibilities for the information provided by the third party. The information does not take into account the specific investment objectives, financial situation, or particular needs of any particular person. You should take into account your specific investment objectives, financial situation, and particular needs before making a commitment to trade, including seeking advice from an independent financial adviser regarding the suitability of the investment, under a separate engagement, as you deem fit.
You accept that you assume all risks in independently viewing the contents and selecting a chosen strategy.
Where the research is distributed in Singapore to a person who is not an Accredited Investor, Expert Investor or an Institutional Investor, Oanda Asia Pacific Pte Ltd (“OAP“) accepts legal responsibility for the contents of the report to such persons only to the extent required by law. Singapore customers should contact OAP at 6579 8289 for matters arising from, or in connection with, the information/research distributed.

US30 1HHey traders, in today's trading session i'm are monitoring US30 for a buying opportunity around 33808 zone, once I will receive any bullish confirmation the trade will be executed.

DOW JONES (US30) - Short from bearish orderblock ✅Hello traders!
‼️ This is my perspective of US30.
Here I expect price to continue the retracement to fill the imbalance higher. I am looking for a short position if price rejects from bearish orderblock around 33900 price level.
Like, comment and subscribe to be in touch with my content!

Bullish on US30 We got a nice sell into a demand. Now I'm looking for price to head back up into premium.

US30 to find support at previous lows?DOW30 - Intraday - We look to Buy at 32845 (stop at 32645)
Continued downward momentum from 34358 resulted in the pair posting net daily losses yesterday.
The 261.8% Fibonacci extension is located at 32845 from 34358 to 33784.
We have a 78.6% Fibonacci pullback level of 32845 from 32437 to 34347.
Although the anticipated move higher is corrective, it does offer ample risk/reward today.
Our profit targets will be 33370 and 33470
Resistance: 33200 / 33570 / 34034
Support: 32845 / 32812 / 29068
Risk Disclaimer
The trade ideas beyond this page are for informational purposes only and do not constitute investment advice or a solicitation to trade. This information is provided by Signal Centre, a third-party unaffiliated with OANDA, and is intended for general circulation only. OANDA does not guarantee the accuracy of this information and assumes no responsibilities for the information provided by the third party. The information does not take into account the specific investment objectives, financial situation, or particular needs of any particular person. You should take into account your specific investment objectives, financial situation, and particular needs before making a commitment to trade, including seeking advice from an independent financial adviser regarding the suitability of the investment, under a separate engagement, as you deem fit.
You accept that you assume all risks in independently viewing the contents and selecting a chosen strategy.
Where the research is distributed in Singapore to a person who is not an Accredited Investor, Expert Investor or an Institutional Investor, Oanda Asia Pacific Pte Ltd (“OAP“) accepts legal responsibility for the contents of the report to such persons only to the extent required by law. Singapore customers should contact OAP at 6579 8289 for matters arising from, or in connection with, the information/research distributed.

DOW JONES (US30) - Selloff started ✅Hello traders!
‼️ This is my perspective on US30 .
Here we can see that price filled the imbalances and rejected from bearish orderblock, so I expect we will see bearish price action upcoming days. We can correlate this move with DXY, as USD is expected to get stronger.
Like, comment and subscribe to be in touch with my content!

US30 top-down analysisHello traders, this is a complete multiple timeframe analysis of this pair. We see could find significant trading opportunities as per analysis upon price action confirmation we may take this trade. Smash the like button if you find value in this analysis and drop a comment if you have any questions or let me know which pair to cover in my next analysis.

SKY IS THE LIMIT ✈🚀🙌😎👌✔Price broke above my major key resistance trendline and seem to be testing the new found support. My FIBS are out, price currently on my key price retracement zone and seems to be bouncing off 🚀. We are definitely heading for a new HH. Ill be patiently waiting.

#US30 next uptrendBreak of bearish structure at US30, IMO tries to return to support to continue its path towards an uptrend.
You can take advantage of the retracement towards support or simply wait and take a long position.
Not a signal
DYOR
US30There is a break out here that could lead to a 34755 high. The US30 has been ranging and this could be a new break out for the new year.
I hope the tech companies will be rallying strong in 2023.

One or two possible buy orders in #US30Resistance was broken last week, so the daily candle closed above resistance, so we could see price go back to what will be new support today, and see price continue in an uptrend.
Also, on the daily chart we see bullish momentum, and what looks like a retracement towards further bullish momentum.
So we can expect to take a buy order once the price touches that support.
DYOR
Not a signal

US30 top-down analysisHello traders, this is a complete multiple timeframe analysis of this pair. We see could find significant trading opportunities as per analysis upon price action confirmation we may take this trade. Smash the like button if you find value in this analysis and drop a comment if you have any questions or let me know which pair to cover in my next analysis.

US30 Long...US30 Buy... This is not signal... Dont risk more than 3% of your account on any trade...

US30MY US30 Bias is Bullish now and US30 seemingly will break the recent highs sooner and will try to fill up all the FVGs.
