Us30 between the Bear and the BullAfter breaking the support down, it will be a nice sell option as price action trade to continue the Bearish move, if it keeps moving up it will be an interesting buy option as it's forming a H&S pattern.
Us30long

DOW JONES (US30) - Sell-off expected ✅Hello traders!
‼️ This is my analysis on US30 .
Here we are bearish from daily perspective, so I am looking for shorts. I expect bearish price action from this bearish orderblock after price filled the imbalance.
Like, comment and subscribe to be in touch with my content!

Dow Jones Prediction H1Here is my view for US30 on H1. The price could go up, you can put a pending order on the Order block or find an entry on LTF within OB Zone. Trade Safe!

US30USD LongHello guys.
The price has been forming a falling channel for the past few weeks. The lowest low of the trend formed a double bottom, which is an indicator that the trend was to be a bullish move. The price is now at the top trendline of the channel.
I anticipate that the price might continue with the bullish run, and I have 2 possible scenarios of the entry zone. The first is below the current price at around 32200 and the second, at the top of the current price at around 33000.
My position will be at 33000, as I am using the pullback strategy to enter my positions hence it will be above the highest high formed.
The other reason as to why I am trading bullish is the current client sentiment of this index is 75% short and 25% long, and we are all aware that the market markers tend to move in reversal of the crowds anticipation. (Look at the Daily Forex website for the clients sentiment data)
My targets are 33800, 34600 and 35400 thus my target R:R is 1: 3.
Remember, risk only 1-2% of your account!

time for Reversing ?with rsi above 70 and breaking down on daily and a big move up for 800 pips on friday it will be interesting to break the resistence down for a correction and if up it would be interesting to close the gap

dow jones ale theorywas looking for a continuation of the trend I saw yesterday that also played out in my favor

US30 Buy LongHistorically, the United States Stock Market Index (US30) reached an all time high of in January of 2022.

US30 Prediction H1Here is my view for US30 on H1. The price could go up, you can put a pending order on the Order block or find an entry on LTF within OB Zone. Trade Safe!

US30 Long: Uptrend Overall Uptrend
Entry on possible HL after it breaks the resistance
Tp on the next resistance
SL at the previous HL

DOW JONES (US30) - Short from bearish orderblock ✅Hello traders!
‼️ This is my analysis on US30 .
Here we are still in the bearish market structure, so I am looking only for shorts. I expect price to continue the retracement to fill the imbalance and then to reject from bearish orderblock.
Like, comment and subscribe to be in touch with my content!

US30 MARK UP | OCTOBER 24-28, 2022Red Folders:
Oct 24 = Flash Services PMI (SLIPPAGE-FREE)
Oct 25 = CB Consumer Confidence (SLIPPAGE)
Oct 27 = Advance GDP q/q (SLIPPAGE)
Oct 28 = Core PCE Price Index m/m (SLIPPAGE)

US30 seems to be bottomed out After bad CPI numbers US30 managed to get to 28600 which is previous low.
Scenario 1. US30 is currently forming a kind of double bottom or "W" pattern, it will be confirmed as it breaks the neckline which is around 30312-30473. Breaking that zone would confirm that's its double bottom. Target of this pattern is usually the size from bottom to the neckline. which is at 32410.
Scenario 2. As you can see only 4hour candle chart, US30 is also forming up descending broadening wedge i.e. bullish chart pattern (said to be a reversal pattern) breaking out of this and would make our new target on top of the descending broadening wedge.
If you look carefully at fibs 0.382 (30790) seems to be like the important area which US30 must break and create support above it in order to move higher
Entry: breakout of neckline
TP1 : 0.618 fib (32129)
TP2 : 32564
TP3 : 34296
S.L : 2%
Remember I will be only taking trade as it breaks and creates support above the neckline
Trade safe.

US30 a aggressive entry spot and a safe entry spot a lower high was formed so upside could be limited and if you want a safe entry wait for break of that low b4 a sell but looking at dxy power i can see this falling pretty bad if dxy holds into the next session and bulls continue if not we could see a move up to the 31000 area b4 a drop

US30 top-down analysisHello traders, this is a complete multiple timeframe analysis of this pair. We see could find significant trading opportunities as per analysis upon price action confirmation we may take this trade. Smash the like button if you find value in this analysis and drop a comment if you have any questions or let me know which pair to cover in my next analysis.

US30 LONGCURRENCYCOM:US30
US30 is continuing its bullish run, with price breaking a key/strong
level of resistance. Awaiting a retest and a confirmation candle to
go long on US30

Our Stop Loss at Break even @ 30140 TP1 @ Fridays High Following our entry at the beginning of the hour OUR STOP LOSS is at Break even @ 30140 TP1 @ Fridays High
Manage the trade accordingly we will not be moving our STOP LOSS NOW until at least the next hour.
We will continue to share our trade and chart ideas on this FREE platform if we see the interaction from the community, so PLEASE SUBSCRIBE TO SEEKINGPIPS HERE ON THIS PLATFORM.

End of Day Trade U30 Long BUYEnd of Day Trade U30 Long BUY
This chart shares our current key level going forward and we will trade around it accordingly as more PRICE ACTION develops in the coming hours.
We will continue to share our trade and chart ideas on this FREE platform if we see the interaction from the community, so PLEASE SUBSCRIBE TO SEEKINGPIPS HERE ON THIS PLATFORM.

US30 LONGCURRENCYCOM:US30
Break and retest on US30. Bearish structure was broken in US3O.
A confirmation candle is needed to go bullish


US30 between the Bull and the Beara double top on 4 h shows an interesting if it broke the support down of a sell and a triangle with the 5th wave if it rejects from the support and broke up it will be a nice Buy option

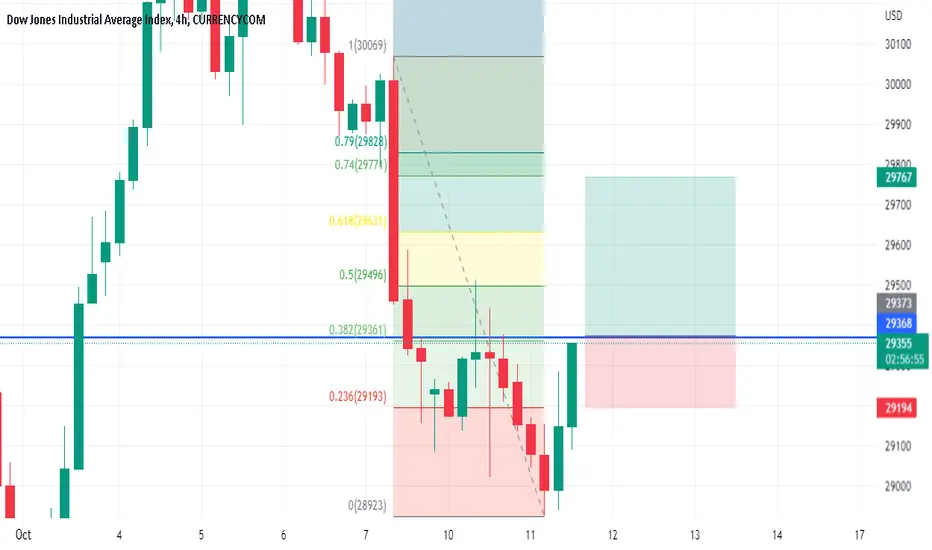
Potential reversal for us30 Read the description.a double bottom on 4H time frame with oversold indicators and breaking up it will be interesting when broking the 38% of Fib retracement to continue up tp1 50% of Fib, tp2 61.8% and the Full target at 74%.