double bottom formed on 1h time frame for a reversalbreaking the resistance up will be interesting for a buy
Us30long

US30 BUY ANALYSISLooking at US30 on 15M timeframe
Currently looking for long/buy position
We currently waiting for signals of reversal whereby we will then execute the trade


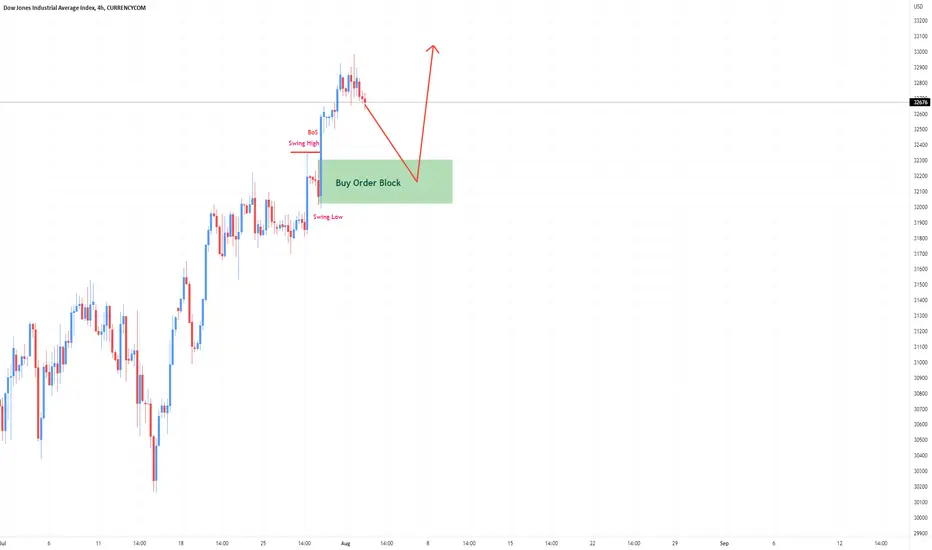
US30 Prediction H1Here is my view for US30 on H1. The price could go up, you can put a pending order on the Order block or find an entry on LTF within OB Zone. Trade Safe!

US30 top-down analysisHello traders, this is the full breakdown of this pair. We will take this trade if all the conditions are satisfied as discussed in the analysis. Smash the like button if you find value in this analysis and drop a comment if you have any questions or let me know which pair to cover in my next analysis.

US30 Long Opportunity after a long timeUs30 breaking long term bear trend , retest in 30M and now going up to 33k levels
For a long term it will test 33800 levels maybe in this week.
2 Key Levels still remaking play as resistance as well.
Lets see how it gona Play!
Note : Exercise Proper Risk Management

US30 BREAKOUT LOOMING US30 has been in consolidation for over 6 days now which is not surprising in terms of what phase of months we are trading in instead of trading the consolidation we are waiting on the market to break to large scale high volume node and capitalize on that movement
BUY STOP ORDER
Price 32025
Stop Loss 31960
Take Profit 32840
SELL STOP ORDER
Price 31705
Stop Loss 31805
Take Profit 1 31590
Take Profit 2 31410
Would love to hear your comments

US30 PENDING BUY VRTX TRADE US30 last week complete to fill the lvn gap, with the week of trading I do expect that the market may start to build a new consolidation area based off of previous hvn ranges back in June I would reframe from trading that area and wait until the market breaks out of that high volume node
US30 Buy Stop
Entry 33305-33320
Stop Loss 33140
Take Profit 34310

US30 (HIGH PROBABILITY BUY SETUP SOON)Here we can see clearly the next move for US30,
⬛️ We are trading at oversold extremes
⬛️ A higher correction is expected
⬛️ A move lower faces tough trend line support & we remain cautious on downside potential
⬛️ Further upside is expected although we prefer to buy into dips close to the 32670 level,
Keep a close eye on DJ30, U.S. top 3 major index,
Happy PIP hunting traders.

US30 BUY ANALYSISLooking at US30 on 30M timeframe
Currently looking for long/buy position
We currently waiting for signals of reversal whereby we will then execute the trade

US30 Reversing for a correction after that big move down us30 is now making a correction for TP use FIB retracement and we have oversold as shows the indicators as a more confirmation

US30 30 M GAPHello friends! US30 GAP on 30 M a break of the resistance will be interesting for a potential BUY .

us30 biasDo not be greedy, be realistic to yourself. Us30 is bullish but we have potential drawdown for reversals

US 30 down to 29800 area and will come back to 34500 area.I think we are near the bottom of US 30. We can go lower towards the 29800 area. Then will pull back to the 34500 area. Now FED wants to balance economic growth and inflation. I think inflation will melt down in the coming months.

Us30 BullishUs30 is bullish but there are key levels that could contribute to the manipulation to the downside. My main interest is to see us30 Purging out liquidity to the upside. Any Repricing to the downside keep an eye on those 2 levels annotated if we deep further down. but I'm anticipating a lot of volatility due to wrapping up the week having objectives being fulfilled. Level 33280.70 to 32917.16 is a key level if not Friday does reprice into it before taking out the targets next week Tuesday or Wednesday could trade into it creating the low of the week. Besides all this Bias is Bullish

US30 preparing for another wave up?US30 (D) has formed a weekly narrow doji which is a sign of strong bullish momentum in the market. As the monthly price action is still bullish, the daily trend is still up, there is a probability of another wave up on US30. On the test of the previous resistance as support, based on a lower timeframe bullish price action, a long trade is highly probable.
Thank you for visit this idea, press the like button if you find value in this idea:)

US30 is in buy zone!!US30 has formed an inverted head & shoulder and has broken to the upside and formed a strong bullish engulfing pattern. It is a high probability that the price will be reached the monthly strong Doji for higher liquidy. A buy trade is justified on this breakout.
If you find value in this analysis, press the like button.

US30 Idea H4Here is my view for US30 on H4. The price could go up, you can put a pending order on the Order block or find an entry on LTF within OB Zone. Trade Safe!
US30 Analysis for next moveUS30 price will fall and will follow the chart pattern.
Please Like, share and comment.

US30 updated analysisUS30 is in a local uptrend for this entire month. As the monthly candle closed as a bullish candle, we could potentially see a further uprise to the monthly Doji or liquidity zone. As the support shown is daily 20EMA and previous resistance where possible buy opportunity may arise.
Press the like button if you find value in this analysis : )

US30 Idea H4Here is my view for US30 on H4. The price could go up, you can put a pending order on the Order block or find an entry on LTF within OB Zone. Trade Safe!

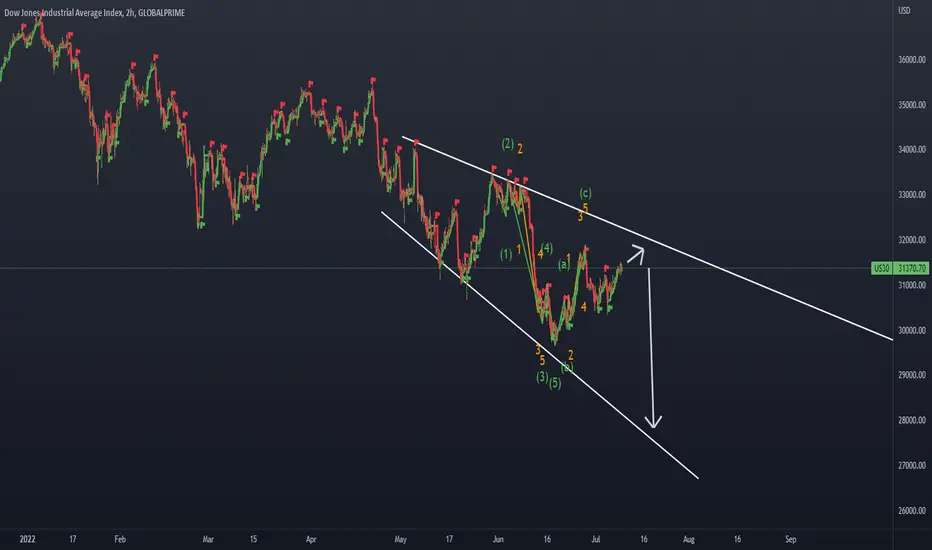
Continuation or sell off? US30 - Higher timeframe outlook:
Price coming into weekly downtrend supply along with filling a nice imbalance, good potential zone for a reversal, however price could continue bullish all the way towards the D point of the crab filling these imbalances before closing back below the weekly structure, (As daily and 4H are both bullish).
If we fail to break the 1H/4H lows i'm going to look for buys towards that D point as Crypto/stocks have been super bullish this week too, and the rally could continue, however if we start failing highs/breaking structure i'll look for sells, will keep an eye on structure and market sentiment!
This crab is quite probable though, one of my favorite harmonics to trade for reliability especially the C/D leg for direction, but if this pattern completes without any major pullbacks it will be a more or less guaranteed big swing back down, so 100% get alarms on that D point zone! (Probably for next week if it completes so no rush there!)
Let me know your thoughts!
* Disclaimer **
These ideas I never trade until the end target with my initial lots, I focused on high probable entries with higher lots and use a specific partial taking strategy giving me a very high win rate and take most of my profits very early, I only leave a small % of my capital to run the entire trade. On the flip side im constantly monitoring LTF momentum and will close early if things change, these analysis's are for research purposes only.
