US30 BUY play amazing risk to rewardThis is an example of what i have to offer. i am starting a signal service and this is my free play for the day. remember to use proper risk management on all trades. traditionally only 1-3%
Us30long

DOW JONES US30 SUNDAY ANALYSIS 18 04 2021Hey Traders,
Here is the amazing Dow Jones Index Analysis.
I am expecting a Bullish trend for this week, with a pullback to cause the Bearish Trade.
Enjoy Guys,
Cheers to your Profits!!

Dow Jones 35K InboundThe bubble will burst at some point but it won't without causing serious problems for sellers. I assume a selling lure will come before we see a reversal to target the next round number at 35K.

Looking for a nice long trade on US30Looking for the bullish momentum to continue once we can get some more orders flowing in the market.
We need more suckers to push the market to a more attractive discount level and then we can buy it back and then sell it back to them at a MUCH higher price. HEHE
#us30 #ikoncinvst #us30long
“Buy when everyone else is selling and hold until everyone else is buying. That’s not just a catchy slogan. It’s the very essence of successful investing.”
-J. Paul Getty

LONG POSITIONUS30;TECHNICAL
FARECAST:LONG
We can see some retracement on the lower TF before price move long on US30 (30M-TF) seems to be ah good entry for long opportunity
If you find this helpful and want more FREE Updates on TradingView
. . . . . Please show your support back,
. . . . . . . . Hit the 👍 LIKE button,
. . . . . . . . . . . Drop some feedback below in the comment!
❤️ Your Support is very much 🙏 appreciated! ❤️
💎 Want us to help you become a better Forex trader?
Now, It's your turn!
Be sure to leave a comment let us know how do you see this opportunity and forecast.
Trade well, ❤️
1_GFX English Support Team ❤️

US30 - Next target 33.945 will be soonThe strategy finds the rule in 4 years, every year, every quarter. The ratio of risk/reward 1/1 to give the success percentage over 55%.
Makes a second order has a better ratio. US30''s risk/reward: 1/1.86.
Look the right label: that rule has 14 times consecutive wins and 6 times consecutive losses in history.
+ A Long trend is when the price close & crossover the Keltner Upper 2 + k value of Stochastic indicator crossover 80.
+ A Short trend is when the price close & crossunder the Keltner Lower 2 + k value of Stochastic indicator crossunder 20.
+ to Entry when k value ( Stoch indicator) make correction and cross the d value ( Stoch indicator)
- Buy: d > 70
- Sell: d < 17
-
US30 A potential Buy Trade Available Very Soon To Catch 350 PipsThis is an educational + analytic content that will teach why and how to enter a trade
Make sure you watch the price action closely in each analysis as this is a very important part of our method
Disclaimer : this analysis can change at anytime without notice and it is only for the purpose of assisting traders to make independent investments decisions


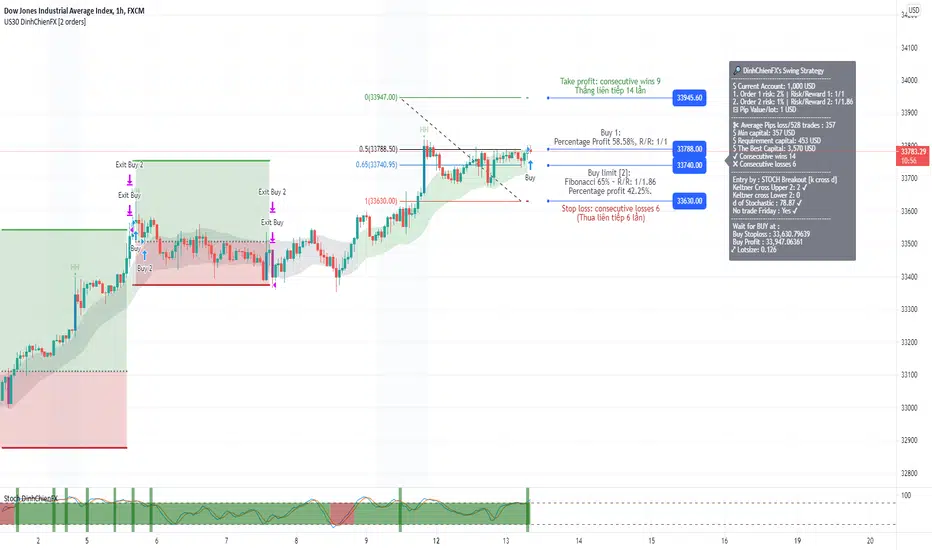
US30 - New high will be by Keltner Channels & StochasticKeltner basis: 20 | trend identification: Keltner Upper/Lower 2 | entry: Stochastic breakout k cross d | Stoploss: 2, Profit: 2 | HH-LL: 100:5
Success result: all history FXCM broker in H1 timeframe.
- History:
The strategy finds the rule in 4 years, every year, every quarter. The ratio of risk/reward 1/1 to give the success percentage over 59%.
The 2nd Entry has the percentage profitable 45%.
Makes a second order has a better ratio. US30''s risk/reward: 1/1.86.
Look the right label: that rule has 14 times consecutive wins and 6 times consecutive losses in history.
+ A Long trend is when the price close & crossover the Keltner Upper 2 + k value of Stochastic indicator crossover 80.
+ A Short trend is when the price close & crossunder the Keltner Lower 2 + k value of Stochastic indicator crossunder 20.
+ to Entry when k value ( Stoch indicator) make correction and cross the d value ( Stoch indicator)
- Buy: d > 70
- Sell: d < 17

US 30 LONG AS I POST PEREVIOUSLY ON TRADING VIEW ( GO CHECK IT 13 MAR ) , THAT THE BEST ENTRY IS TO WAIT ANY KIND OF RETESTING AROUND 32077 THEN GO LONG ANOTHER TIME , HERE'S THE PRICE START HIS BULLISH UPTREND AGAIN ! HAPPY ERANINGS !

US30 - Break of ResistanceI am anticipating a break of the resistance that has been holding on US30 for the past week or so (at around the 32800.00 level) to the upside.
If broken I expect price to continue it's bullish run to revisit the resistance area at the 33200.00 level.

US30 BUY TRADE IDEAHi all, I'm looking to Buy U30 - Overall, price is in a clear uptrend and my trends are respected on the 15, 30, 1 and 4H TF's. If price clears my micro downtrend and gives a clear break and retest of my 4H zone, I will buy for 2000 pips.


us30 could have 1 more leg up before a drop!last week we saw us30 drop sharply mid/late week.... i do think that this is a very good buying opportunity because i do think that us30 is going to have 1 more leg up before we have our 3k point drop!
we are currently forming a rising channel (bearish pattern) but i dont think that we will break it just yet.
i do think that us30 will go up to 33,735 before dropping to 29,990! i expect us to hit our buying targets by Thursday 7pm ct.
i do have 2 charts showing that 33,735 is our top:
here are your buying points/targets:
a good buying point is at 32,815
your first target/ second buying point is at 33,025
and your final target is at 33,735
if it does break the rising channel i will make another post giving you price targets!
(TAKE TRADE AT YOUR OWN RISK)

US30 BuyTwo possible Buy opportunities.
1st, more aggressive entry, we see a lower timeframe liquidity built up which has been ran. Would like price to come back down to the resistance/support, reject it and then fly up.
2nd, more conservative entry, looking for a lower timeframe mitigation from the last buy to sell candle. Saw structure being broke and we created a HH from the HL. I am looking at this as a reentry from the mitigation of the previous 4hr last sell-to-buy type of candle. Would like too see price react of this and jump up.
Both trades have a great R:R and seem very enticing.
Many thanks for reading this, please like and follow if you liked the idea, it would be much appreciated.
OANDA:US30USD

US30 33155 + 0.33 % LONG IDEA * PRICE ACTION & STRUCTURE HELLO EVERYONE
HOPE EVERYONE IS DOING GOOD HAVING A GOOD ONE IN THE MARKET THIS WEEK, HERE'S A LOOK AT THE JOE DONES INDUSTRIAL.
* follow your entry rules on entries
* significant moves with the bears change the plan.
lets see how it goes.
many stars must align with the plan before executing the trade, kindly follow your rules.
HAPPY TRADING EVERYONE & LET YOUR WINS RUN...
_________________________________________________________________________________________________________________________
ENTRY & SL - FOLLOW YOUR RULES
some rules on exits & entries hope they help.
1. look at structure be it descending channels, pennants and so forth basically price action whats price doing.
2. If you use indicator determine does it align with your play e.g is it overbought/oversold where there market is it in a pull back to structure or continuing does price alighn with your indicator.
3. entries from 30M , 1H, 2H & 4H time-frames the higher the time-frame the more likely it will end up swing or long term.
4. aggressive trades can be executed on the pull back / or at ranges of structure that's when you are a scalper or your trade are Intra - day based
5. price action must definitely align with the plan.'
6. structure definitely
7. FIBONACCI EXTENSIONS AS GUIDELINES FOR SL & TP'S .
9. CANDLE STICK PATTERNS.
That's basically entry & exits plan basic guide lines
RISK-MANAGEMENT
PERIOD - SWING TRADE
__________________________________________________________________________________________________________________________
If this idea helps with your trading plan kindly leave a like definitely appreciate it.

US30 33155 + 0.33 % LONG IDEA * PRICE ACTION & STRUCTURE HELLO EVERYONE
HOPE EVERYONE IS DOING GOOD HAVING A GOOD ONE IN THE MARKET THIS WEEK, HERE'S A LOOK AT THE US 30 .
* follow your entry rules on entries
* significant moves with the bears change the plan.
lets see how it goes.
many stars must align with the plan before executing the trade, kindly follow your rules.
HAPPY TRADING EVERYONE & LET YOUR WINS RUN...
_________________________________________________________________________________________________________________________
ENTRY & SL - FOLLOW YOUR RULES
some rules on exits & entries hope they help.
1. look at structure be it descending channels, pennants and so forth basically price action whats price doing.
2. If you use indicator determine does it align with your play e.g is it overbought/oversold where there market is it in a pull back to structure or continuing does price alighn with your indicator.
3. entries from 30M , 1H, 2H & 4H time-frames the higher the time-frame the more likely it will end up swing or long term.
4. aggressive trades can be executed on the pull back / or at ranges of structure that's when you are a scalper or your trade are Intra - day based
5. price action must definitely align with the plan.'
6. structure definitely
7. FIBONACCI EXTENSIONS AS GUIDELINES FOR SL & TP'S .
9. CANDLE STICK PATTERNS.
That's basically entry & exits plan basic guide lines
RISK-MANAGEMENT
PERIOD - SWING TRADE
__________________________________________________________________________________________________________________________
If this idea helps with your trading plan kindly leave a like definitely appreciate it.

US30 just turned bullish!us30 [rice has broken above strong resistance which means us30 could push up higher!
yesterday we did see price break a strong resistance level! currently we are testing previous resistance which could mean we will push up next week.
i do think that we could push up 500 points before we do see that 3k point drop.... next week we will see price reject/cross a pivot ring (when price crosses a pivot ring that means a bi g move is coming) i do think that price will push down once it does break this pivot ring!
here are your buying points/ targets:
a good buying point would be at 33,010
and your only target is at 33,525
(TAKE TRADE AT YOUR OWN RISK)

US30 - Daytrade by Keltner & Stoch 18 Mar 2021Keltner basis: 20 | trend identification: Keltner Upper/Lower 2 | entry: Stochastic breakout k cross d | Stoploss: 2, Profit: 2 | HH-LL: 100:5
Success result: all history FXCM broker in H1 timeframe.
The strategy finds the rule in 4 years, every year, every quarter. The ratio of risk/reward 1/1 to give the success percentage over 55%.
Makes a second order has a better ratio. US30''s risk/reward: 1/1.86.
Look the right label: that rule has 14 times consecutive wins and 6 times consecutive losses in history.
+ A Long trend is when the price close & crossover the Keltner Upper 2 + k value of Stochastic indicator crossover 80.
+ A Short trend is when the price close & crossunder the Keltner Lower 2 + k value of Stochastic indicator crossunder 20.
+ to Entry when k value ( Stoch indicator) make correction and cross the d value ( Stoch indicator)
- Buy: d > 70
- Sell: d < 17


Why I Believe The Dow Jones Is Going To 142,000AriasWave has turned bullish bullish bullish on the Dow Jones.
Thanks to Crypto markets and some in depth research I have some good reasons to create this Wave Revision.
But this is only the beginning...
If you are currently long based on my previous long idea my advice is to stay long as we are only just getting warmed up.
I apologize for the delay in getting videos out, I have been very busy learning and researching various topics in order to bring better content in the future.
Just remember: I am not a financial advisor, I suggest using this only as a guide. Always do your own research.
If you don't know the long term pattern shouldn't you be doing your research instead of just following the crowd?

POSSIBLE US30 TRADE PROJECTIONI think price will deliver a good long opportunity from the level indicated on the chart.
PLEASE NOTE:
This is ONLY a trade IDEA!
