Us30long

US30 LONG OPPORTUNITYAS WE SEE THE PRICE NOW IS ON A BULLISH UPTREND , SO THE BEST ENTRY IS TO WAIT ANY KIND OF RETESTING AROUND 32077 THEN GO LONG ANOTHER TIME , & AS YOU SEE THE RSI GIVES AS A CLEAR DIVERGANCE WICH MEAN THAT THE PRICE LOSING VOLATILITY !


US30 - Follow the trend by Keltner & Stoch 10 Mar 2021The strategy finds the rule in 4 years, every year, every quarter. The ratio of risk/reward 1/1 to give the success percentage over 55%.
Makes a second order has a better ratio. US30''s risk/reward: 1/1.86.
Look the right label: that rule has 14 times consecutive wins and 6 times consecutive losses in history.
+ A Long trend is when the price close & crossover the Keltner Upper 2 + k value of Stochastic indicator crossover 80.
+ A Short trend is when the price close & crossunder the Keltner Lower 2 + k value of Stochastic indicator crossunder 20.
+ to Entry when k value ( Stoch indicator) make correction and cross the d value ( Stoch indicator)
- Buy: d > 70
- Sell: d < 17

DOW JONES - Wave Revision - FED Kicking The Can Down The RoadIn this video I present the latest interpretation of the DOW JONES according to AriasWave.
This video is accompanied by a long trade idea linked down below.
The FED continues to kick the can down the road therefore this market is still bullish.
This move continues to subdivide into a complex Type-2 Expanded Zig-Zag.
Please remember: I am not a financial advisor, only use this as guide.
Remember to use Disciplined Money Management Principles to ensure longevity as a trader.

DOW JONES - Long Trade Idea - Based On Video IdeaThis long trade idea is based on the latest interpretation of the DOW JONES.
Please see the related video idea linked below.
Entry: At Market.
Stop: 30,773
Target: 36,500
Risk\Reward Ratio: 7
The FED continues to kick the can down the road therefore this market is still bullish.
This move continues to subdivide into a complex Type-2 Expanded Zig-Zag.
Please remember: I am not a financial advisor, only use this as guide.
Remember to use Disciplined Money Management Principles to ensure longevity as a trader.


US 30-year Treasury Bonds; Get ready to buy them up.These will easily outperform US (and probably global) equities by a very wide margin! (3%-5% annually) - And so will the 10-year Notes, and the T-Bills, and ... Bet on it! (Inflation expectations = waiting for the Tooth Fairy)
... and when the head o JP Morgan Chase says; "I wouldn't touch 30- year treasuries!" ... You know it's time to load up!

US30 is looking SUPER BULLISHright now we are seeing us30 completely fall (-600+ points). market is doing exactly as predicted!
here is a post that i posted a 1 hour ago:
all targets were hit in just a matter of 2 hours!
now it is time for us30 to go up... right now we are seeing a descending channel (bullish) and a possible inverse heads and shoulders (bullish) we could push up to 33k by march 15th!
here are the buying points/ targets for you guys:
a good buying point is at 30,580
your first target/ second buying point is at 30,932
your second target/ third buying point is at 31,476
your third target/ forth buying point is at 32,336
and your final target is at 22,018
(TAKE TRADE AT YOUR OWN RISK)

US30USD TECHNICAL ANAYLSIS buy opportunity US30USDUS30USD TECHNICAL ANAYLSIS buy opportunity US30USD

Bitcoin could hit 60K this weeklast week i made a post on bitcoin saying that the price will explode and so far it has done exactly what i predicted:
i do think that bitcoin will hit 60k this week and i think once it passes 60k it will go up to 100k(i expect bitcoin to hit 100k by june of 2021) after it hits 100k i do believe that bitcoin will crash.
if you want some price targets here they are:
a good buying point is at 50.293
your first target/ second buying point is at 53,336.13
your second target/ third buying point is at 57,320.59
and your final target is 60,208.06
your long term target is 100k ( i will make another post about the 100k price target once it passes 60k!)

Us30 trade update....we did break the neckline on us30 a few hours ago but i do think that we could start pushing down again! currently we are testing a strong resistance which could bring us down (-900 points). if it does go past that resistance level and that trend line you can expect us30 to push up to 33k right away.
realistic outcome: i personally dont think that us30 will cross that top trend line just yet, i think that us30 will come down and test major fib levels (i have 4+ charts with different fib tools showing that we could push down)
(Red Path)
a good buying point would be at 31,732
your first target/ second buying point is at 32,336
and your final target is at 33,018
(yellow path) (most likely to happen)
a good buying point would be at 30,594
your first target/ second buying point is at 31,247
your second target/ third buying point is at31,732
your third target/ forth buying point is at 32,336
and your final target is at 33,018

US30 could be forming a bullish pattern....so far we have seen us30 push up 300 points but i do think that we can still fall back down to 30,594... if we do fall back to 30,594 we could be forming an inverse heads and shoulders! this is a bullish pattern.
if we do cross the neckline and dont push down to 30,594 we could start pushing to 33k but i do think that this is very unlikely.
a good buying point is at 30,594
your first target/ second buying point is at 31,247
your second target/ third buying point is at 31,732
your third target/ forth buying point is at 32,336
and your final target is at 33,018
if it does not form this heads and shoulders i will be making another post showing you guys some price targets and some buying opportunities


US30 could fall another 300 points before we go up to 33klast week we saw us30 sell of sharply (-1,500+) i do think that us30 will sell of 300 points when markets open up Sunday evening. in this chart you can see that the target is 30,594(long term support) after we hit this target i do think that we will indeed head up to 33k!
a good buying point is at 30,594
your first target/second buying point is at 31,247
your second target/ third buying point is at 31,732
your third target/ forth buying point is at 32,336
and your final target is at 33,018
after it hits all these targets i do think that we will see another huge sell off (3k+) before we go to 36k

US30 is looking really bullishupdate on us30: after 2 days of us30 selling off we are forming some bullish patterns! ( symmetrical triangle and a descending channel) this is good news because now we know that us30 could hit 33k next week!
if you want price targets just look at my last us30 post

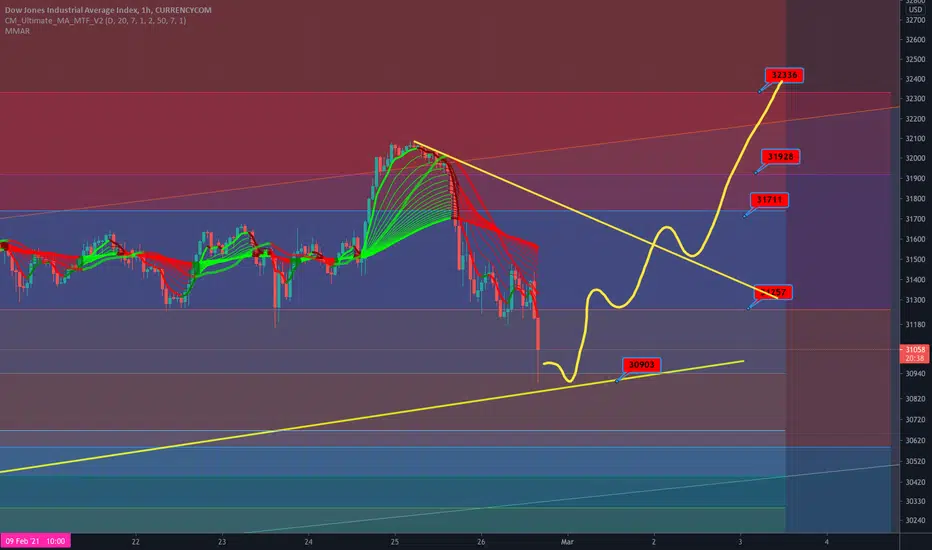
Do Not Panic!currently we are seeing markets "crash" but in reality markets are giving us a better buying opportunity! as of right now we are testing a well respected trend line.... i think that we are going to hold the trend line and we will keep pushing up!
a good buying point is at 30,903
your first target/second buying point is at 31,257
your second target/ third buying point is at 31,711
your third target/ forth buying point is at 31,928
your forth target/ fifth buying point is at 32,336
and your final target is at 33,000
if it does not hold that trend line be prepared to go even lower but as always that is just a better buying point because 33k will happen very soon!
(WARNING!: take this trade at your own risk! markets are very volatile at the movement)
Here we go again and again and again something unexpected happened today... markets are selling off like crazy (-500 points+) this is a bit frustrating but i do believe that markets are giving us a better buying opportunity!
currently i am looking to buy us30 at 31,257 but price could drop to 31,058
a good buying point would be at 31,257 but if it does drop to 31,058 that would be a better buying point
your first target/ second buying point is at 31,748
your second target/ third buying point is at 31,925
your third target/ forth buying point is at 32,336
and your final target is at 33,020
if you do take this trade i do warn you that it is very risky at the moment because markets are currently very volatile
(Take trade at your own risk)

Us30 Target hit.... get ready for another rally yesterday i posted an idea showing that us30 will come down and test the neckline.... today it has officially tested the neckline
whats next?
i think that us30 will keep going up to 33k! we should be hitting 33k by march 3rd
a good buying point is at 31,740
your first target/ second buying point is at 31,916
your second target/ third buying point is at 32,325
and your final target is at 33,020
after it hits all these targets expect us30 to fall down to 30,500!

US30 ANALYSIS 15 - 19 FEB ANALYSIS
--------------
DAILY TF: BULLISH ENGULFING
4HR TF: IN A CONSOLIDATION PHASE
PLAN OF ACTION
----------------------
- WAIT FOR RETRACEMENT/ CORRECTION PHASE ON THE 1HR TF TO COMPLETE BEFORE TAKING BUYS BASED ON DAILY TF BIAS
- IF OPPORTUNITY PRESENTS ITSELF, WE CAN TAKE THE ANTI-TREND SELLS TRADES
ENTRY REASON
--------------------
- BREAK OF CORRECTION PHASE
STOP LOSS @ TO BE DETERMINED AFTER CORRECTION
TAKE PROFIT @ NEXT ZONE

US30 - Swing trade by Stochastic & Keltner channels 25 Feb 2021The strategy finds the rule in 4 years, every year, every quarter. The ratio of risk/reward 1/1 to give the success percentage over 55%.
Makes a second order has a better ratio. US30''s risk/reward: 1/1.86.
Look the right label: that rule has 14 times consecutive wins and 6 times consecutive losses in history.
+ A Long trend is when the price close & crossover the Keltner Upper 2 + k value of Stochastic indicator crossover 80.
+ A Short trend is when the price close & crossunder the Keltner Lower 2 + k value of Stochastic indicator crossunder 20.
+ to Entry when k value ( Stoch indicator) make correction and cross the d value ( Stoch indicator)
- Buy: d > 70
- Sell: d < 17

Us30 Target Hit... Whats Next?today i made a post giving you guys some price targets for us30 and it hit the target exactly as predicted! but what's next?
i think that us30 will push down back to 31,736 before pushing up to 33k!
your first buying point is at 31,736
your first target/ second buying point is at 31,916
your second target/ third buying point is at 32,345
and your last target is at 33,020
----------------------------------------------------------------------------------------------------------------------------------------------------------
after it hits all these targets i do believe that us30 will begin to fall around 2% (around 2,000 points)
(it should hit all of these targets by march 3rd)
after we have that 2% drop i do think that us30 will rally all the way up to 36,000
(it should hit 36k before june 21st)
after it hits 36k be prepared to see an 80% drop in stocks and in crypto (Great Depression 2.0) i believe that us30(dow jones) will drop 80% in 1.5 years
(i will make another post talking about this 80% drop once it hits 36k!)
