Us30sell

US30 technical and fundamental correction.US30 has to make a correction before moving upwards again. My target is 28122. Good luck!

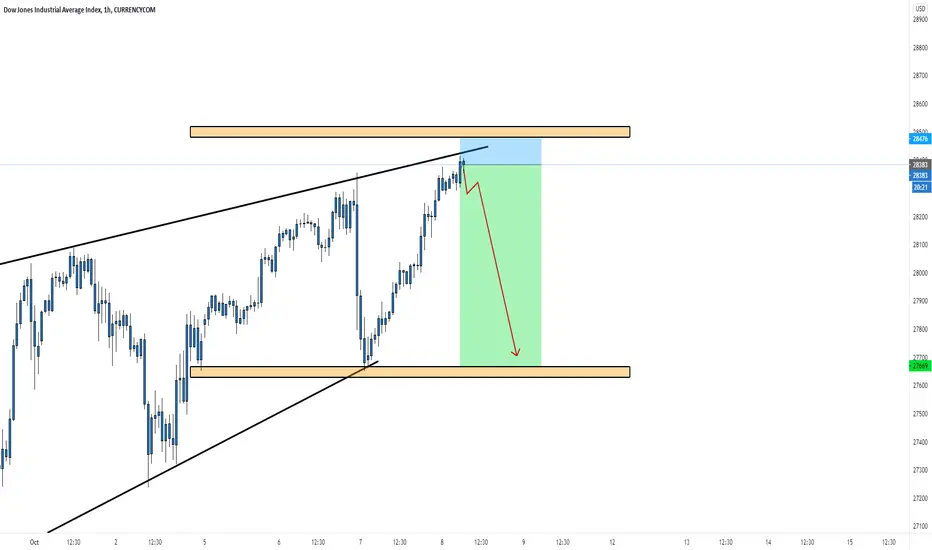
US30 Sell OpportunityUS30 chart analysis for a sell and buy ideas
Follow us for more analysis and signals


US30 Sell OpportunityOur chart reading for US30 chart on M30
it has formed a valid trendline and its around a resistance level so if it didn't break the resistance and it did break our trendline with a momentum candle we're gonna enter a sell position

US30 SELL SETUPUS 30 Bearish trend its strong resistance is at 30048.27 than its follows downwards our first target is 29192.01 if our first target will be hit than must hold the upper position and hold until 28949.24. if you are fully satisfied than give your precious FEEDBACK.

Dow- Different story, same ideaAs SP500 and Nas100, we also have a strong recovery on Dow since March's low, but, unlike the others, the major companies index couldn't make a new all-time high( above February's high). Also, unlike the others, the recent low is a lower low, not a higher low as we see in Nas100 and SP500.
The index now is also in resistance and is contained in a descending channel.
I expect a new leg down and in the medium term Dow can reach 25000

US30 10% Drop expected ahead of Election resultsUS30
*********
⏳4 Hour chart
🎲 Possible entry analysis
⛳️ Possible bull/bear target
📚Educational
—————-❇️——————-
Detailed analysis 💬
1️⃣ Minor head and shoulder around September high
2️⃣ 2800.00 Key dynamic resistance/Support
3️⃣ US 2020 election outcome will be a key driver
4️⃣ .50 Fibonacci and October low bounce
5️⃣ Parabolic price move expected as June, Sep, Oct high forming a Parabolic structure
6️⃣The 02 uptrend trend line was broken
7️⃣ Technical support - Neutral Ahead of Election results
8️⃣ Short term bullish movement towards 28000
9️⃣ June high Immediate resistance
🔟 june low Possible - Bear target
#️⃣ Overall Bullish trend
—————-❇️——————-
📉 Technical bias-H4-Neutral
Below 200 Exponential moving average
200EMA acting as immediate support - Bearish trend
Possible entry point-28000
Relative strength index - Around 60 well above the neutral area
MACD- Is still above the line and about to cross the line and the histogram is still green ,Oscillators are pointing upward
Stochastic -at 75 Which is over bought territory
Ichimoku cloud -cloud is red-Cloud Support-Bear
Bollinger band- Price is around higher band-Middle band will acting as dynamic support/resistance
—————-✳️——————-
Key reversal area's
26000 Key psychological level
26550 September month high
26040 Dynamic support and resistance
28000 Key psychological level-Major key reversal area
29000 October month high
28000 Possible entry- Bearish
27150 -Alternative entry-Bullish
—————-✳️——————-
Bearish entry #US30
Entry price - 28000
Take profit 01 - 27100
Take profit 02 - 26000
Take profit 03 - 25200
🚫 Stop lose 28450
Alternative Bullish entry-27100
⬇️ 10.29% drop expected
⤴️ Account growth 1.59 :10.29
✅ Risk reward ratio 1 : 6.47
—————-⚜️——————-
Push the like button , And cheer up if you found useful


US30 SellsHello Traders,
I'm expecting the Dow Jones to have a bigger pull back this week possibly bottoming out at 27950. For now, I see a possible entry for a double top on H4 to finish the 4th leg of the Daily Big Bullish M Pattern. Overall, I see price making a new high in the future. If we don't pull back to 27950, then the next sell entry will be at 29300

US30 Sells (Updated)The bias on the Dow is still bearish from last week. I am looking for an entry here. Possible 1:7 Risk to Reward. Price respected the -27 on Daily, on H1 I spot a potential double top, and H4 is oversold on the RSI.
Take profit at this Week's Pivot Point.


US30 SellsLooking for a pull back at this strong area of resistance. Overall the Dow is bullish. So long term investors, look out for another buy opportunity when the pull back occurs. Feel free to enter here with what ever stop loss you choose. I personally use 50 pips, but feel free to use 100.

US30 1h Hello Traders, here is the full analysis for this pair, let me know in the comment section below if you have any questions, the entry will be taken only if all rules of the strategies will be satisfied. I suggest you keep this pair on your watchlist and see if the rules of your strategy are satisfied

US30 DropI like to identify structure by marking up support and resistance. Then I predict which way the market is going (is it bullish, bearish, or consolidation). I look for a bullish or bearish trend failure and decide what I want to do and then execute the trade. I saw that the momentum of the candlestick was starting to increase which is why I got in for a sell after identifying everything that I look for in the market (in which i didn't list here in the description summary).

US30/Dow Jones Possible Sell SetupsOne of my followers has asked me to do an analysis on US30 for this upcoming week so here is my analysis.
Let me know what you all think and hope you are enjoying the ideas!
Remember to like the post and follow if you haven't already, it is greatly appreciated!

US30 - SHORTVery similar to spx500 it seems. Price failed to put in a HH and it is also at a resistance level on the daily. We see price put in a lower low, and then a lower high, which could signal bearish movement on the way. I'm keeping my eye on this one to see if another lower low can be achieved to confirm a reversal in the uptrend on US30.

US30 / KILLZONE / SHORT OR LONG?As we can see from this chart DOW has broken above its previous resistance level and has now entered an area where it plummeted before
There is an opportunity to go long here if price action indicates the move OR price will get rejected from this area and move lower.. there is also a chance price might range in this area for a short while but we will have to wait and see

US30 [4H] Climb Near Resistance ✅✅✅✅US30 Climb Near Resistance ✅✅✅✅
Now us30 climb near Resistance zone
How to trade ??
If Hitting and have priceaction / Rejection Sell it on that 🔴 If break Notrade 🔴
Good Rich 🚀🚀🚀🚀

