Dow Jones (US 30)Dow Jones (US 30) on the weekly analysis on 4H chart. The market is currently moving up and the price has break the resistance. The price maybe retesting before pushing up.
Us30setup

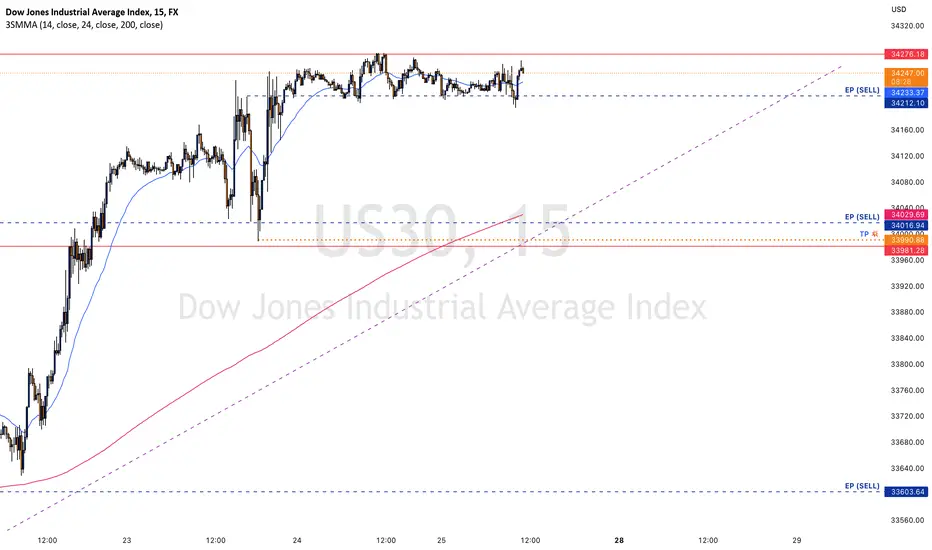
US30 (High Probability SELL Setup SOON)Here we can see in M15 chart, US30 has touched a major resistance level of 34276, which forms a strong resistance level in D1 chart, we've got our EP & TP,
keep a close eye on US30 today,
Happy pip hunting traders.
Dow Jones ( US 30) Dow Jones ( US 30) daily analysis on 1H chart. The market will be affected today due to the Thanksgiving in USA. Price maybe moving very slow so keep that in mind whenever you take a trade. Price is still keep moving up.

US30 top-down analysisHello traders, this is a complete multiple timeframe analysis of this pair. We see could find significant trading opportunities as per analysis upon price action confirmation we may take this trade. Smash the like button if you find value in this analysis and drop a comment if you have any questions or let me know which pair to cover in my next analysis.

Dow Jones (US 30)Dow Jones (US 30) daily analysis on 1H chart. The market is currently moving up. As for the structure is bullish. The price is to move down to test the support level before moving up.

US30 and the break of the consolidations After all the consolidation of last week the boom will be soon,
with a divergence, a flag and a double top the break of the support will be an interesting for the sell option.
if it goes up to break the triangle it would be a great buy with the breaking of the resistance.
calculate your risk management before going into any trade.

Dow Jones (US 30) The price has breaken the trendline that has hold for 8 months. If the price can break the level 33967.2 and close above, we will see the price moving up strong, but if the price hold at level 33967.2 we may see the price going down. If you need to a buy wait for the price to break before...

Dow Jones (US 30) Weekly AnalysisDow Jones (US30) weekly analysis. The price has breaken the 8 months trendline and we have seen the price playing above the trendline. we are now waiting to have a clear direction, if the price is going to push up or going down?
For more analysis, you can check my 4H chart analysis after this one.

#US30 #DowJones $DJIA #forex #US30 #DowJones $DJIA #trading
- ALT BAT Pattern 🦇
- Daily Frame
- The pattern fails to close the price above : 34765

US30 SHORTFinishing up this week we can see price is wanting to initiate downside liquidity. With the Cot Reports coming out Tuesday and release to the public on Friday evening leading to promising sells due to the Nasdaq investors and institutions have a heavier number in sells than buys. Not to much of a difference with the Bulls being 15,662 & 16,145 in sells. With the numbers being so close we can see a slight momentum to finish of the week but a new push going into Monday of next week.

US30 top-down analysisHello traders, this is a complete multiple timeframe analysis of this pair. We see could find significant trading opportunities as per analysis upon price action confirmation we may take this trade. Smash the like button if you find value in this analysis and drop a comment if you have any questions or let me know which pair to cover in my next analysis.

DOW JONES - Sell-off expected ✅Hello traders!
‼️ This is my analysis on US30 .
Here we are bearish from daily perspective, so I am looking for shorts. I expect bearish price action from here as price filled the imbalance and rejected from bearish orderblock.
Like, comment and subscribe to be in touch with my content!

US30 and the end of the Wave 5With a diversion on daily time frame and a double top in the formation is it break the support down it will be an interesting sell option for the dow to start reversing.
But if it broke up it may continue the bullish move with an ascending triangle shown on 4 H time frame.
Manage your risk wisely before taking any trade.

US30 (High Probability Sell Setup SOON)Here we can see clearly the next move for US30 in the H2 TF, as our analysis predicts, US30 will be in a last uptrend move before it drops to our EP & on to our TP,
Keep a close eye on US30 today,
Happy pip hunting traders.

US30 top-down analysisHello traders, this is a complete multiple timeframe analysis of this pair. We see could find significant trading opportunities as per analysis upon price action confirmation we may take this trade. Smash the like button if you find value in this analysis and drop a comment if you have any questions or let me know which pair to cover in my next analysis.

Dow Jones (US 30) Weekly AnalysisDow Jones (US 30) weekly analysis on 4H. The price has breaken the 10 months trendline. we are currently seeing the price trying to retest the new support trendline that I have put on the chart. If the price retest we are going to see the price pushing more to the upside.

US30 SELL ANALYSISLooing at US30 on 4H timeframe
We looking for a possible SELL/SHORT position
We looking for a possible downward trend at this distribution phase
New Lows Loading

likely bullish push from us30 demand zoneMarket is showing nice PA at this demand zone and with confirmation will likely complete the Head and Shoulder pattern to go long to tp1 "neckline" or tp2 if market remains bullish after pullback. This is a very handsome reward for a minimum of 700pips or 7,000points depending on your broker to tp1 alone.

Us30 between the Bear and the BullAfter breaking the support down, it will be a nice sell option as price action trade to continue the Bearish move, if it keeps moving up it will be an interesting buy option as it's forming a H&S pattern.

Dow Jones daily US 30 daily analysis on 1H chart. The market is bearish and currently moving down after respecting the trendline zone. One can look for selling opportunities more than buying. as the bears are still in control of the market.

US30 top-down analysisHello traders, this is a complete multiple timeframe analysis of this pair. We see could find significant trading opportunities as per analysis upon price action confirmation we may take this trade. Smash the like button if you find value in this analysis and drop a comment if you have any questions or let me know which pair to cover in my next analysis.

Dow Jones (US 30) daily US 30 daily analysis on 1H chart. The market structure is currently bearish and the direction is on a down trend. The price has just breaken the counter trendline to the down side. with this situation at hand it will mean that one should look for selling opportunities more than buying.

US30 (High Probability SELL Setup Soon)Here we can see clearly the next move for US30 today, with High Impact Fundamental News is due to be out today 2:00 pm (+00:00,BST), we can see High Probability of a Down move today,
Keep a close eye on US30
Happy pip hunting traders.
