US30 Dow Jones Technical Analysis and Trade IdeaThe US30 Dow Jones index has exhibited a robust bullish trend recently. However, we now observe that the index is approaching a significant resistance level on both the weekly and daily charts.
Moreover, the market appears to be overextended. When a market becomes overextended, there’s a possibility of a reversal. Traders closely monitor signs of exhaustion or weakness.
Given these factors, we are considering a short opportunity. It’s essential to manage risk diligently, as trading always carries inherent risks. Remember that this information is for educational purposes only and should not be construed as financial advice. 📈👍
Us30setup

US30 BEARISH IDEAIntitutional Strategy/tactics
This is the trade i found after trading
1.5 Risk reward if you like the idea please subscribe for more
hit the like button and show some love
wish you good luck and good trading

Detailed Us30 Insitutional AnalysisHello traders this is my detailed insituional anaylsis for this index
I Will wait for trading setups and share those signals with you
if you like my anaylsis hit the like button and comment and lets share our ideas toghether
Wish you good luck and good trading

US30 PREDICTIONUS30 TRADE PREDICTION
BULLISH SETUP
if you like the idea support please
hit the like button and show some love
wish you good luck and good trading

US30 Dow JonesPair : US30 Dow Jones
Description :
Double Top in Short Time Frame
Completed " 12345 " Impulsive Waves
Fibonacci Level - 261.2%
RSI - Divergence
Bullish Channel as an Corrective Pattern in Short Time Frame and Rejection from Upper Trend Line

Dow Jones Short Term Sell IdeaH4 - Bearish trend pattern.
Currently it looks like a correction is happening.
Until the two strong resistance zones hold my short term view remains bearish here.

US30 2024/04/1115min bearish range, waiting op premium for possible shorts
also looking to go for buys possibly from A-low during London Sesh

US30 2024/04/10Still within 15 min Bearish range
POI's Marked out for CPI, wil be looking for MSS on said POI's, also trendline liq forming above price anticipating it to be run at some point

YM (US30, Dow Jones Industrial Aveage) Puts in a Double TopYM (US30) 4 Hour, Fibs: Traded the first bear fib after the double top and saw it trade past its objective yesterday. The Dow has been one of the weaker indices of late, after outperforming most of the year. It didn't even make it up to the 50% line, selling off at the 38.2% line in the initial down move. Then, yesterday, on the rebound, it traded it's halfway back short. ####TRADE ALERT####
YM (DOW 30)
Call: Short
Entry Type: Market 39320
SL: 39500
TP1 / TP2: 38636
################### Normal Size Position - Much Better Entry at A Series Fib with a Much Larger Reward:Risk 900 points of reward:200Points of Risk

US30 Dow Jones Technical Analysis and Trade IdeaIn this video, we delve into a prospective trading opportunity within the US30 Dow Jones index. Our analysis entails evaluating the prevailing trend, scrutinizing price movements, assessing market dynamics, and identifying a potential entry point under favorable conditions, as elaborated in the video. Incorporating robust risk management principles into your trading strategy is crucial. It's imperative to emphasize that this content is presented solely for educational purposes and should not be construed as financial advice.

US30 POI's 2024/04/04 Possible intraday movement
PLEASE SEE POI'
POSSIBLE long and short zones marked out

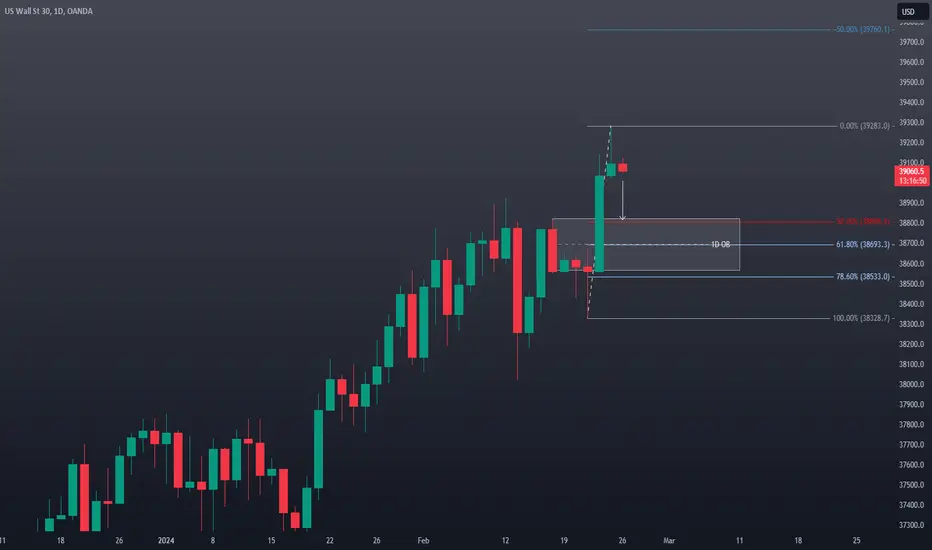
US30 Technical Analysis: Counter-Trend Short OpportunityThe US30's bullish momentum has encountered a key resistance level. This presents a potential counter-trend shorting opportunity. Here's the trade idea:
Entry: Sell short at the current resistance level.
Stop-Loss: Place a stop-loss order above the recent high.
Target: Aim for the previous support/imbalance zone established at a prior low.
Rationale: The US30's extended rally into resistance increases the likelihood of a pullback. This setup offers a favorable risk-reward ratio for a short-term counter-trend trade.
Important Note: Market conditions can change rapidly. Manage risk diligently and adapt your strategy as needed.


US30 Pair : US30 Dow Jones
Description :
Completed " 12345 " Impulsive Waves
RSI - Divergence
Break of Structure
Bullish Channel as an Corrective Pattern in Short Time Frame
Impulse Correction

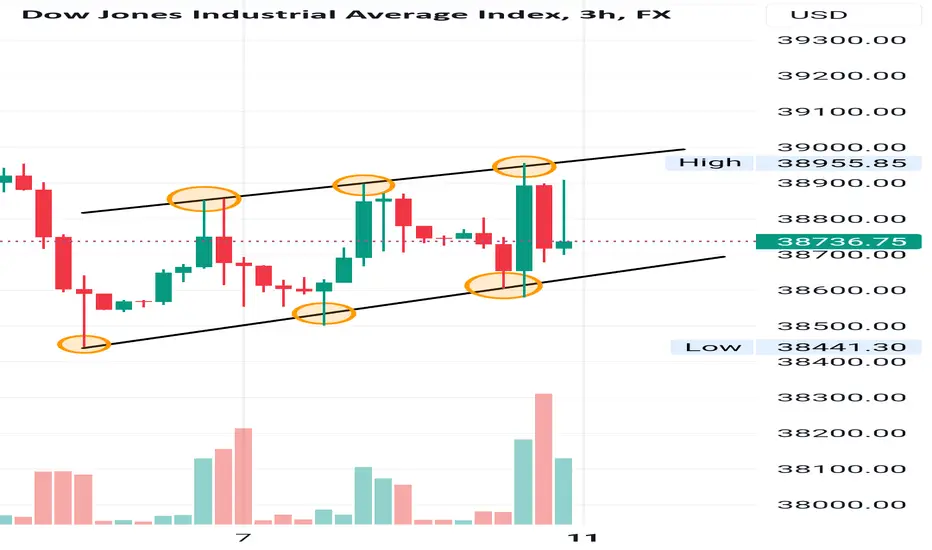
US30 Trade IdeaUS530: Riding the Ascending Channel to New Heights
The US30 index has been tracing an ascending channel on the 4-hour chart, a bullish pattern that suggests a continuation of the current uptrend. This pattern is characterized by two parallel upward-sloping trend lines that have been containing the price action.
Key Observations:
Bullish Sentiment: The ascending channel indicates a strong bullish sentiment as it is formed by a series of higher highs and higher lows.
Support and Resistance: The lower trend line serves as support, while the upper trend line acts as resistance.
Trading Strategy: Traders might consider buying at the lower trend line or on a breakout above the upper trend line.
Trade Execution:
Entry Point: A pullback towards the lower trend line could be a potential entry point, offering a favorable risk-reward ratio.
Stop Loss: A stop loss can be placed just below the lower trend line to protect against a potential breakdown.
Take Profit: The height of the channel can be used to project potential take profit levels, either from the point of entry or from the upper trend line if trading a breakout.
Risk Consideration:
Ensure to monitor for any signs of a breakdown below the lower trend line, which could invalidate the pattern.
Adjust positions according to the evolving market conditions and maintain a disciplined approach to risk management.
Trade ideas are speculative and should be considered within the context of your overall market analysis and trading strategy.
This trade idea is based on the ascending channel pattern, which is a common bullish signal in technical analysis. It’s important to combine this with other indicators and market analysis for a well-rounded trading decision. Happy trading!
US30 Short Sell Trade!Hellllooo! I just analyse the US30 chart and I am looking a good sell here if you trust on my analysis so comeon let's book this opportunity together!!!

US30 - DOW JONES INDUSTRIALS AVERAGE US30 has been in a major bearish divergence from Jan 2018, I think march 2024 will be a month of correction (10%-15%) and then a pickup from April 2024 all the way to September/October when I think the market will hit the top for the US30 that will be around $44,200.
- Monthly MACD (Bearish)
- Monthly Pekipek's Divergence BETA (Bearish)
- Monthly RSI (Bullish)
- Monthly Stochastic RSI (Bearish)

Dow Jones / US30This Is My Anticipation On The Us30, Hopefully We See A Low Of The Week Formed On The Daily Mitigation Block And We Get A Change In State Of Delivery Bullishly On The H1 To Confirm The Bias I Hold Already.

US30 DOW JONES Technical Analysis and Trade IdeaThe US30 has enjoyed a robust bullish run, but recent price action on the 1D and 4H charts indicates potential weakness. I'm anticipating a **sell opportunity** should we observe a decisive break below the current range low, followed by a retest and failure of that level. Potential targets for this trade would align with prior 1D accumulation range highs.
Remember that trading carries inherent risk. Before executing any trades, it's vital to conduct your own extensive research. Consider both fundamental market drivers and global macroeconomic conditions alongside your technical analysis. Always implement sound risk management practices to safeguard your investment.
**Disclaimer**: This analysis presents a technical viewpoint on the US30. It should not be interpreted as investment advice. Base your trading decisions on your own risk profile, comprehensive market research, and a thorough assessment of all relevant variables.
US30 Probably setupUS300 For me is probably setup for sell.
My potential setups you see on chart.
This is not recommendation ;) Just my view.
Usually I use 3 or 4 orders with TP1-TP4
Minimal Risk reward is 1:1 NOT LESS

Dow Jones Short Term Sell IdeaH4 - Bearish divergence.
Most recent uptrend line breakout.
Expecting the price to move lower further after pullbacks in the short term until the strong resistance zone holds.

US30 longs from 38000.0 back upGiven the strong bullish sentiment in US30 this week, the plan is to continue trading in line with the current trend. With recent price action breaking structure to the upside, it has formed a clear 9-hour demand zone. I'll be patiently waiting for a Wyckoff accumulation within this zone.
Once this accumulation pattern confirms on the lower time frames, I'll be keen on taking long positions, especially considering it aligns with a psychological level at 38000.0. Additionally, this zone has demonstrated an impulsive move, leading to a Break of structure (BOS). I anticipate this move to propel US30 to establish new highs.
Confluences for US30 Sells are as follows:
- Price has been overall bullish short term and long term so this is a pro trend idea.
- The 9-hour demand zone has caused a break of structure to the upside.
- There's some liquidity left to the upside that can be taken. Looking at the candle stick anatomy bulls are still looking more dominant.
- I anticipate a Wyckoff accumulation to occur during the ongoing pullback
- Sentiment analysis also sees US30 to be very bullish which is another confluence.
P.S. Given my strong bullish sentiment and the diminishing strength of bears, I wouldn't be astonished if price reverses. This market has been remarkably bullish for quite some time, so a reversal might occur to fill in imbalances or sweep liquidity left below.

US30 Longs from 37600.0 or 37300.0 back upUS30 recently broke out of its ranging zone, achieving new all-time highs and confirming an extremely bullish trend. This further strengthens the prevailing idea, prompting us to adapt and seek opportunities for buying to continue the upward trend.
We've identified two demand zones—one on the two-hour timeframe, close to the current price, and another (10hr) below, which is considered more ideal. The latter broke structure on a higher timeframe, swept liquidity, and is within the 0.78 fib range. I'll be patiently waiting for either of these two zones to explore potential buying opportunities.
Confluences for US30 Buys are as follows:
- Price needs to dip to a significant demand level for an upward rally to persist.
- The market trend is long-term bullish, aligning with this idea.
- New demand zones have been left on the (10hr & 2hr) which caused a BOS on the HTF.
- Price has taken ATHs confirming the bullish trend.
- Price has broken significant structure to the upside also reinforcing this idea.
- Imbalances below that need to get filled as well so a potential pullback does make sense.
P.S. Despite the prevailing bullish trend, it's crucial not to have tunnel vision and overlook the possibility of a bearish bias. With price absorbing all liquidity to the upside, there's a chance for a melt-off, potentially breaking through my demand zones and reaching the equal lows below them.
