The start of the Bearish wavesus30 hit the 61 level of fib extension making the wave 5 of the bullish move and with a big reversal pattern on daily time frame it could be the start of the bearish move with the break of the support it would be an interesting sell option.
Us30signal

DOW JONES (US 30) Dow Jones (US 30) daily analysis on 4H chart. Price is still pushing up as per the price move. It is currently at the support level. If the price respect the level, we will see a rejection and it will push up and if not, the price will break the support level and move down. Wait for the confirmation.

Dow Jones (US 30) Dow Jones ( US 30) daily analysis on 4H chart. Market direction at 4h chart, indicates that the price is moving up. One can see by the trendline that is being respected every time the price get to it. This indicates that we can look for buying opportunities in the market. If the price is going to break the resistance wait for the price to give you a retest before buying.

Dow Jones ( US 30) Dow Jones ( US 30) Weekly analysis on a daily chart. The price has currently breakout of the 8 months trend-line. This is indicated that the price may change the market structure as well as the direction. As we all know that we have been in a bearish move for sometime now. This may indicate that we will be starting a bullish move. Before one can act on any move, we need to get confirmation. The price need to give us a retest around or between level 33290.3 & level 32374.4 to confirm the breakout. if the area doesn't hold and the price continue to move down that will indicate to us that the breakout was a fails breakout and the market is still bearish.

US30 (TP HIT)!!
Here we can see clearly how our analysis was perfectly executed today by the time of NFP releases,
Well done to whoever took this US30 SELL SETUP with us today,
HAPPY PIP HUNTING TRADERS.
FXKIllA

Dow Jones (US 30) Dow Jones (US30) daily analysis on 1H chart. The market is on a move to the upside. The price is currently at the support level. If the price respect this level we will see the price pushing up. This may be supported by the economic news of today NFP.

Flag not double top❗❗Many beginners traders are watching closely the markets after missing the move up so they sell it and wanting the market to reverse it all, you must be patient and know the pair you are trading on very well as well the markets how it works don't FOMO and as I said that's not a double top that's a flag in the making don't let the market take your money always do your risk management

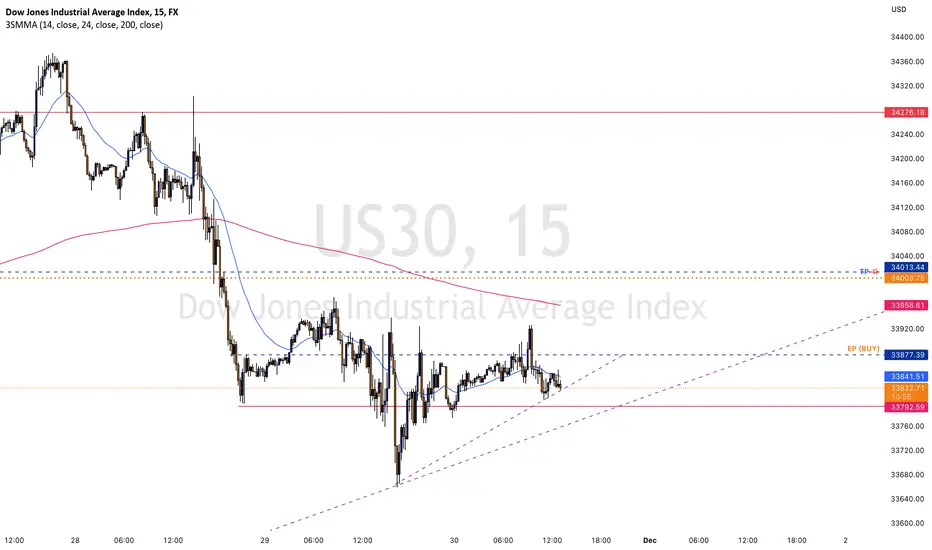
US30 (High Probability BUY Setup SOON)!!!!
Here we can see clearly the next move for Dow30, By forming Inverse Head & Shoulder Reversal Pattern (W), Buying pressure from 33631 resulted in all the initial selloff being recaptured, An overnight negative theme in Equities has led to a lower open this morning, A break of bespoke support at 33650, & the move lower is already underway,
We're using M15 timeframe for a clearer view of our analysis, nothing more, therefore we can't predict exact timeframe our analysis going to happen,
We've got our EP (blue lines) & our TP (golden lines),
Keep a close eye on U.S. indices today as it's full of fundamental news, especially with Fed Chair Powell Speaks at 6:30 (GMT + 00:00 London),
HAPPY PIP HUNTING TRADERS.
FXKIllA.
Continuation pattern on us30 to the bearish moveafter breaking the symmetrical triangle down this will be a great potential to continue the move down for a sell option.

Dow Jones (US 30)Dow Jones ( US 30) daily analysis on 1H chart. The price is currently moving down, it therefore needs one to wait for the price to push up and reject before one can take a sell position.

Dow Jones (US 30) Dow Jones ( US 30) daily analysis on 1H chart. The US 30 is given us a fails breakout as we see the price moving down again. This is putting us back into the bear market , which means that we have to look for selling opportunities more than buying opportunities.

US30, TP HIT!!!Here we can see clearly our previous analysis went exactly as we predicted & published on trading view, well done to whoever took the trade with us, happy pip hunting traders.

Dow Jones (US 30)Dow Jones (US 30) on the weekly analysis on 4H chart. The market is currently moving up and the price has break the resistance. The price maybe retesting before pushing up.

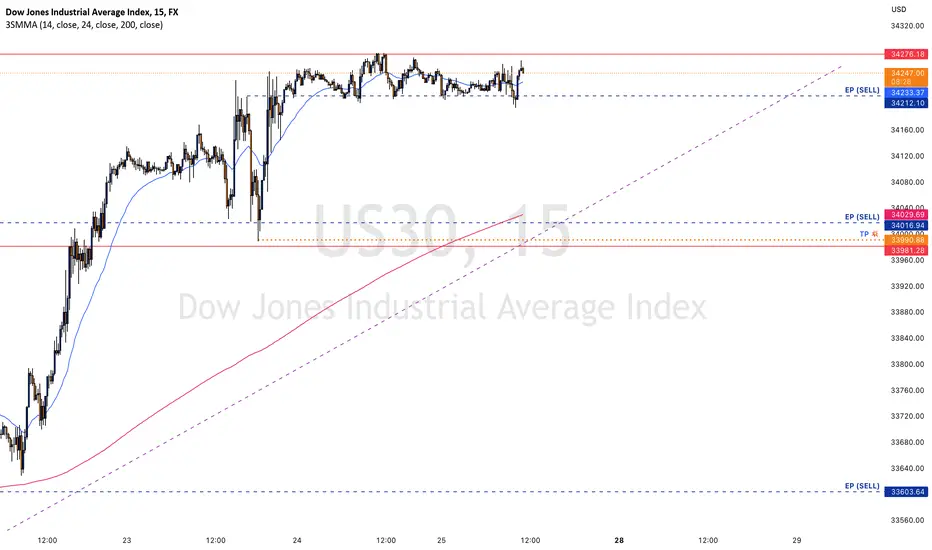
US30 (High Probability SELL Setup SOON)Here we can see in M15 chart, US30 has touched a major resistance level of 34276, which forms a strong resistance level in D1 chart, we've got our EP & TP,
keep a close eye on US30 today,
Happy pip hunting traders.
Dow Jones ( US 30) Dow Jones ( US 30) daily analysis on 1H chart. The market will be affected today due to the Thanksgiving in USA. Price maybe moving very slow so keep that in mind whenever you take a trade. Price is still keep moving up.

US30 top-down analysisHello traders, this is a complete multiple timeframe analysis of this pair. We see could find significant trading opportunities as per analysis upon price action confirmation we may take this trade. Smash the like button if you find value in this analysis and drop a comment if you have any questions or let me know which pair to cover in my next analysis.

Dow Jones (US 30)Dow Jones (US 30) daily analysis on 1H chart. The market is currently moving up. As for the structure is bullish. The price is to move down to test the support level before moving up.

NAS100 top-down analysisHello traders, this is a complete multiple timeframe analysis of this pair. We see could find significant trading opportunities as per analysis upon price action confirmation we may take this trade. Smash the like button if you find value in this analysis and drop a comment if you have any questions or let me know which pair to cover in my next analysis.

US30 and the break of the consolidations After all the consolidation of last week the boom will be soon,
with a divergence, a flag and a double top the break of the support will be an interesting for the sell option.
if it goes up to break the triangle it would be a great buy with the breaking of the resistance.
calculate your risk management before going into any trade.

Dow Jones (US 30) The price has breaken the trendline that has hold for 8 months. If the price can break the level 33967.2 and close above, we will see the price moving up strong, but if the price hold at level 33967.2 we may see the price going down. If you need to a buy wait for the price to break before...

Dow Jones (US 30) Weekly AnalysisDow Jones (US30) weekly analysis. The price has breaken the 8 months trendline and we have seen the price playing above the trendline. we are now waiting to have a clear direction, if the price is going to push up or going down?
For more analysis, you can check my 4H chart analysis after this one.

US30 Analysis & Trade PlanUS30 is looking bullish today, After tomorrow's rally & the breakout of the trendline, at the current Market Price US30 can make a move down to retest the trendline & Support level.
I'm looking at the 33480 - 33550 level to enter the long trade after the confirmation in lower timeframes.
And my Last take profit will be around 33950.
Bullish Signals:
1. 4hr Bullish trend continuation
2. Trendline Support
3. 33547 Support level
4. 0.5 & 0.382 Fib Support

#US30 #DowJones $DJIA #forex #US30 #DowJones $DJIA #trading
- ALT BAT Pattern 🦇
- Daily Frame
- The pattern fails to close the price above : 34765
