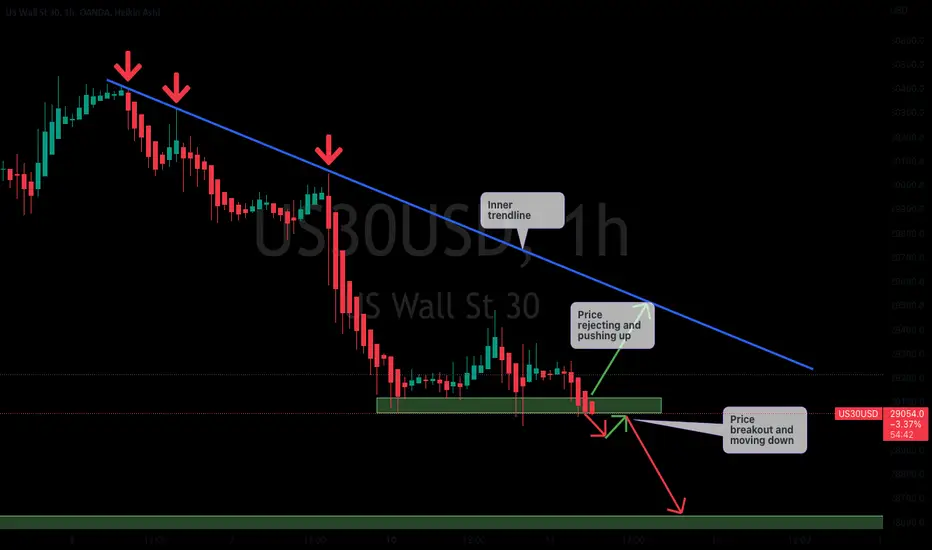
US 30 daily analysisUs 30 daily analysis on 1H chart. The market direction is bearish at this moment. The price is at the resistance level. If the price respect the level it will reject and move down, if not,. The price will break the resistance and push to the upside.
Us30signal

Our Stop Loss at Break even @ 30140 TP1 @ Fridays High Following our entry at the beginning of the hour OUR STOP LOSS is at Break even @ 30140 TP1 @ Fridays High
Manage the trade accordingly we will not be moving our STOP LOSS NOW until at least the next hour.
We will continue to share our trade and chart ideas on this FREE platform if we see the interaction from the community, so PLEASE SUBSCRIBE TO SEEKINGPIPS HERE ON THIS PLATFORM.

End of Day Trade U30 Long BUYEnd of Day Trade U30 Long BUY
This chart shares our current key level going forward and we will trade around it accordingly as more PRICE ACTION develops in the coming hours.
We will continue to share our trade and chart ideas on this FREE platform if we see the interaction from the community, so PLEASE SUBSCRIBE TO SEEKINGPIPS HERE ON THIS PLATFORM.

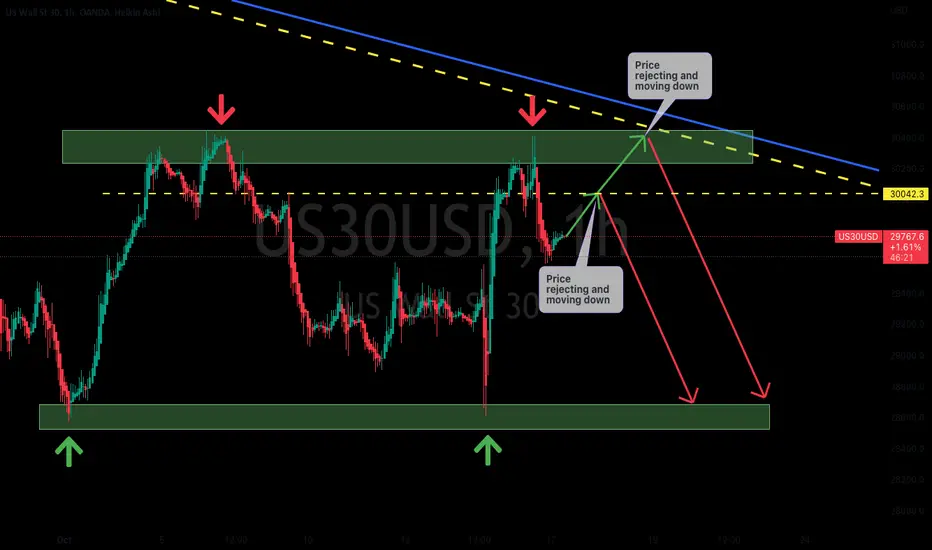
US30 possible sell area!US30 is preparing to test a very important weekly resistance zone where back to back 2 weekly candle has created lower highs. There is a high probability price will reach that zone and will have a rejection as long term price action is bearish. Upon rejection, it is highly likely price will drop in the support zone. Upon confirmation, a sell trade is high probable from the resistance zone!

us30 grabbing the liquidity before the move down us30 making a liquidity wick up if broke below the low of the previous candle it will be interesting by price action to continue moving down.

US 30 daily analysis Us 30 daily analysis on 1H chart. The overall market is bearish, as per the market direction. The price is below my trendline at the higher timeframe. Price has respected a resistance level. Therefore, one should look for selling opportunities in this market more than buying. check my weekly analysis.

US 30 weekly analysisUS 30 weekly analysis on the 4H chart. The market is still in the bear move. The price has respected the resistance level and move down. It with be noted that the price is just moving sideways. As a trader you are looking for a breakout, before one can take a trade.

An interesting 380 pips in the wayafter our first sell with the community from the top, it will be interesting if it breaks the 2nd support with a divergence on indicators for a target 380 pips

US30 and NAS 100 top-down analysisHello traders, this is a complete multiple timeframe analysis of this pair. We see could find significant trading opportunities as per analysis upon price action confirmation we may take this trade. Smash the like button if you find value in this analysis and drop a comment if you have any questions or let me know which pair to cover in my next analysis.

US30 between the Bull and the Beara double top on 4 h shows an interesting if it broke the support down of a sell and a triangle with the 5th wave if it rejects from the support and broke up it will be a nice Buy option

Dow Jones (US30) - Short from bearish orderblock ✅Hello traders!
⁉️This is my analysis on US30.
Here we are in a strong bearish market structure, I expect price to fill the imbalance and to reject from bearish orderblock to continue the sell-off.
Like, comment and subscribe to be in touch with my content!

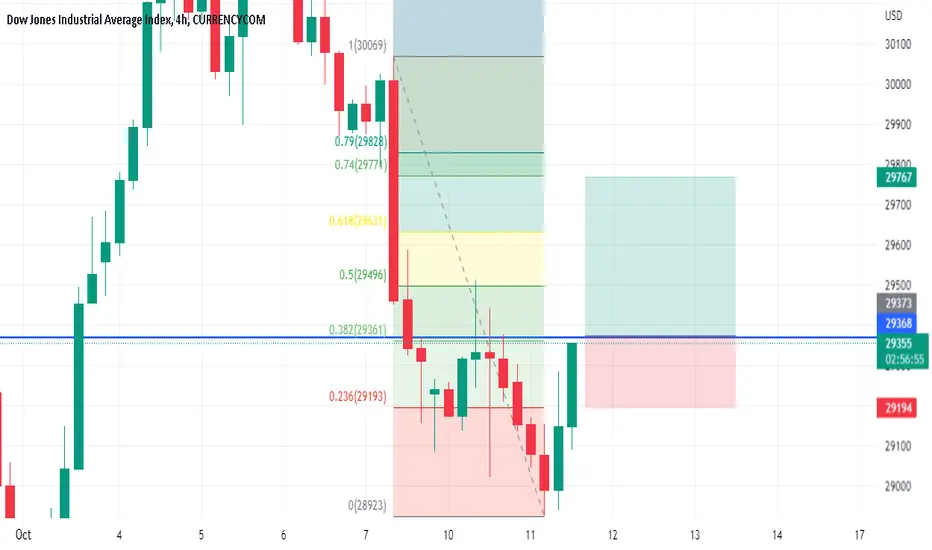
Potential reversal for us30 Read the description.a double bottom on 4H time frame with oversold indicators and breaking up it will be interesting when broking the 38% of Fib retracement to continue up tp1 50% of Fib, tp2 61.8% and the Full target at 74%.
US 30 daily analysisUS 30 daily analysis on 1H chart. The market is still bearish. The great opportunities are more on the selling side, than buying. Check my weekly analysis for more understanding.
Us30 next step 🪜In the current situation, stocks are still at the mercy of the dollar and negative pressure. We expect an upward correction before continuing to decline. We will look for good selling positions.

US 30 daily analysis US 30 daily analysis on 2H chart. The market direction is bearish. The price has just rejected at the resistance level and is currently moving down. If the price respect the recurrent low. the price will move up, if not, we will see the price break and move down.

US 30 weekly analysisUS 30 weekly analysis on a 4H chart. The market is still bearish at this point. The price has given us a retest before turning and moving down. if one has to take a trade, one will have to wait for the price to breakout of the support first or the price reject at the support and only after that you can take a trade.

US30 top-down analysisHello traders, this is a complete multiple timeframe analysis of this pair. We see could find significant trading opportunities as per analysis upon price action confirmation we may take this trade. Smash the like button if you find value in this analysis and drop a comment if you have any questions or let me know which pair to cover in my next analysis.

Double Top on US30 for potential correctionDouble Top on 4H time frame with a divergence gives an interesting Sell option for a correction of the move up with a potential clean 300 pips down.

US30 as broken my short term trendlineUS30 as broken my short term bearish trendline to the upside, you can see a series of HH forming on the H1 TF.
looking for the market to open bearish so I could get a possible entry to the upside, looking to ride the up move to 31201.
NOTE: if the market does not show any signs of weakness during the Asia session I will just pull the trigger without waiting for the pullback.

US30 (HIGH PROBABILITY BUY SETP SOON)On Tuesday, U.S. indices closed in greens for the second consecutive session as Treasury Yields fell & investors grow hopeful that the Feds will decrease its aggressive tightening policy amidst jobs data, US30 (Dow Jones Industrial Average) rose 825.43pts (2.8%) to 30316, we believe the UPTREND move will be resuming this coming days & weeks due to the November 08/2022, midterm elections in the U.S.
At the mean time, Here we can see clearly the next move for US30 in H1 time frame, we have our EP & our TP, keep a close eye US30, happy pip hunting traders.

Short on Us30Price has met a 1 hour resistance level @30414.75, price action has downside candle printing in a selling manner after a huge pullback. Us 30 looks to go back down to make a low and continue it bearish trend.

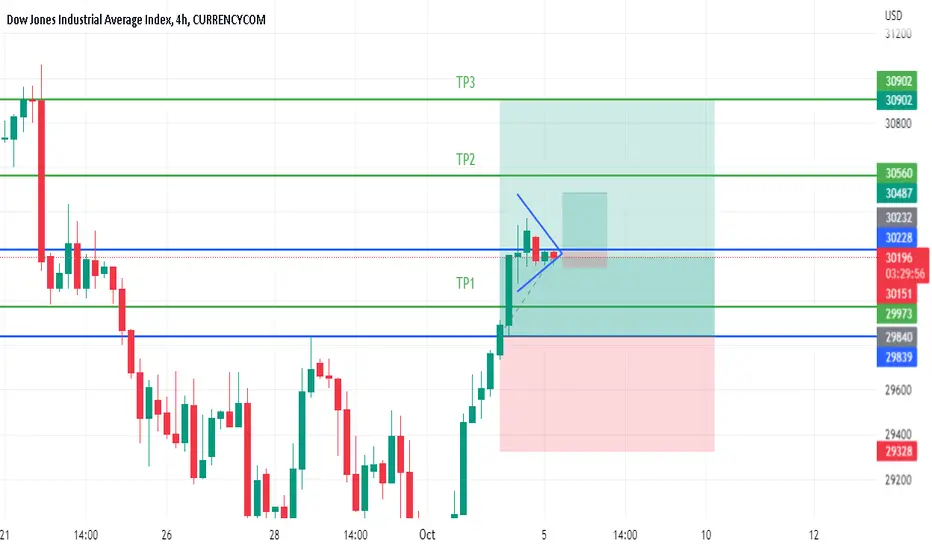
US30 Forming a Triangle to continue the Bullish moveafter the bullish move yesterday us30 is accumulating and forming a triangle to continue the Bullish trend with a medium swing on its own with 250 pip TP and 80 SL.