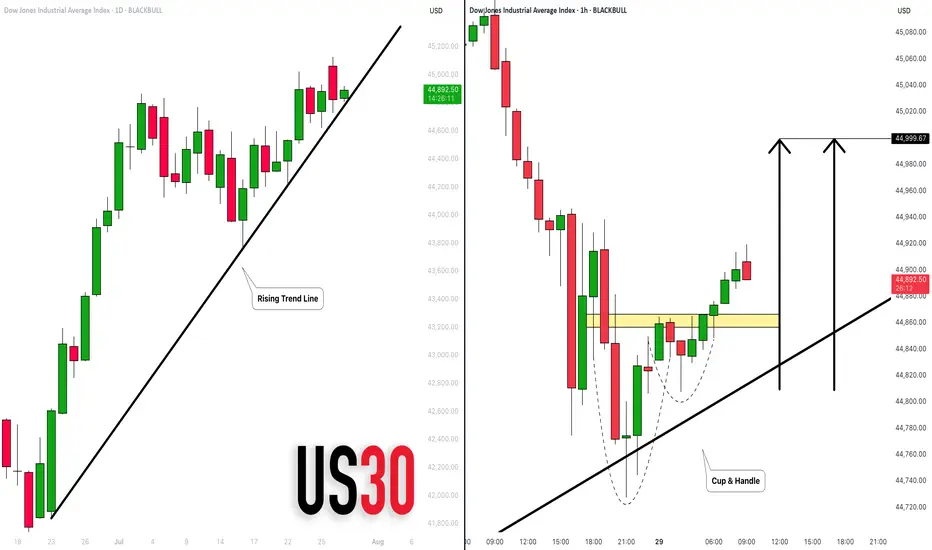
DOW JONES INDEX (US30): Bullish Move From Trend Line
There is a high probability that US30 will continue rising today,
following a test of a solid rising trend line on a daily.
As a confirmation, I see a cup & handle on that after its test
on an hourly time frame.
Goal - 45000
❤️Please, support my work with like, thank you!❤️
Us30signals
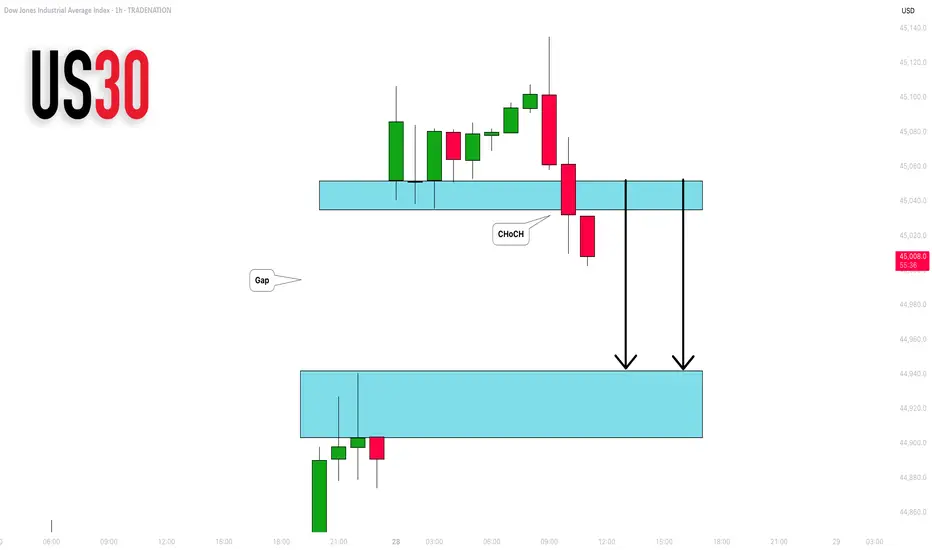
DOW JONES INDEX (US30): Another Gap For Today?
I see another gap up opening on US30 Index.
I think it will be filled today. A formation of an intraday
bearish CHoCH on an hourly time frame suggests
a highly probable bearish continuation.
Goal - 44943
❤️Please, support my work with like, thank you!❤️
I am part of Trade Nation's Influencer program and receive a monthly fee for using their TradingView charts in my analysis.
NASDAQ INDEX (US100): Bullish Continuation Confirmed
NASDAQ Index broke and closed above a resistance of a horizontal
parallel channel on a daily.
It confirms a bullish trend continuation and a highly probable growth
to the next strong resistance.
Goal - 23300
❤️Please, support my work with like, thank you!❤️

DOW JONES INDEX (US30): Pullback From Support
US30 shows some strength after a test of a key intraday support.
A cup and handle pattern on that and a violation of its neckline
indicate a local strength of the buyers.
I expect a pullback to 42550
❤️Please, support my work with like, thank you!❤️
I am part of Trade Nation's Influencer program and receive a monthly fee for using their TradingView charts in my analysis.

US30 Analysis: Liquidity Dip or Deeper Correction?📉 US30 (Dow Jones) Trade Idea 📉
Currently analysing US30 – the Dow Jones Index 🏛️, and there are some key developments worth noting…
On the 4-hour timeframe, we’re observing a clear shift in market structure, with price breaking through previous lows ⚠️. This raises two possibilities:
🔹 It could be a liquidity grab before a rally 🚀
🔹 Or, it may be the beginning of a deeper end-of-week sell-off targeting levels below 🔻
At this stage, I’m watching for a potential counter-trend short position — but only if the conditions outlined in the video are met with precision 🎯.
🧠 As always, it’s about waiting for confirmation, not jumping in early. Disciplined execution is key. 🧩💼
⚠️ Disclaimer: This is not financial advice. The information provided is for educational purposes only. Always do your own analysis and manage risk accordingly.

US30 SELLING ON DIPS !!HELLO TRADERS
AS I CAN SEE US30 is fail to break resistence zone after making a ATH its time to retrace as we can see bad econmy of US and GDP investors will pull money from stocks and invest in Safe haven so our Risk reward is great for us it is just a trade idea share ur thoughts stay tuned for more updates
Dow Jones Index (US30): Time to Grow
As I predicted yesterday, US30 nicely respected
a wide daily support cluster.
A pullback from that is now confirmed with a violation
of a minor horizontal resistance on a 4H.
The index may reach 42200 level soon.
❤️Please, support my work with like, thank you!❤️
I am part of Trade Nation's Influencer program and receive a monthly fee for using their TradingView charts in my analysis.

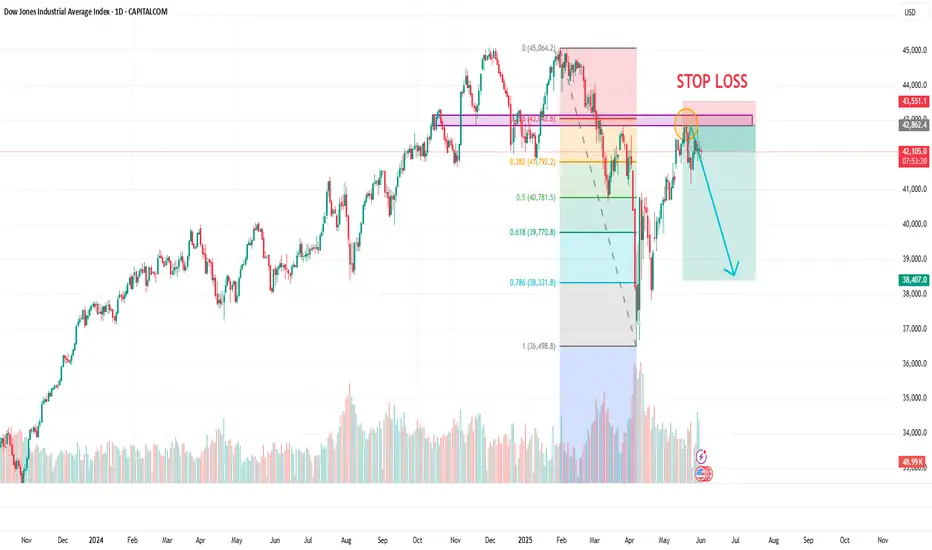
US30/DJI "Dow Jones" Index CFD Market Heist Plan (Day or Swing)🌟Hi! Hola! Ola! Bonjour! Hallo! Marhaba!🌟
Dear Money Makers & Robbers, 🤑💰✈️
Based on 🔥Thief Trading style technical and fundamental analysis🔥, here is our master plan to heist the US30/DJI "Dow Jones" Index CFD Market. Please adhere to the strategy I've outlined in the chart, which emphasizes short entry. Our aim is the high-risk Yellow MA Zone. Risky level, oversold market, consolidation, trend reversal, trap at the level where traders and bullish robbers are stronger. 🏆💸"Take profit and treat yourself, traders. You deserve it!💪🏆🎉
Entry 📈 : "The vault is wide open! Swipe the Bearish loot at any price - the heist is on!
however I advise to Place sell limit orders within a 15 or 30 minute timeframe most nearest or swing, low or high level for Pullback Entries.
Stop Loss 🛑:
📌Thief SL placed at the nearest/swing High or Low level Using the 1D timeframe (41000) Day/Swing trade basis.
📌SL is based on your risk of the trade, lot size and how many multiple orders you have to take.
Target 🎯: 35000 (or) Escape Before the Target
💰💵💸US30/DJI "Dow Jones" Index CFD Market Heist Plan (Swing/Day Trade) is currently experiencing a Bearish trend.., driven by several key factors.👇👇👇
📰🗞️Get & Read the Fundamental, Macro, COT Report, Geopolitical and News Analysis, Sentimental Outlook, Intermarket Analysis, Index-Specific Analysis, Future trend targets with Overall outlook score... go ahead to check 👉👉👉🔗🔗
⚠️Trading Alert : News Releases and Position Management 📰 🗞️ 🚫🚏
As a reminder, news releases can have a significant impact on market prices and volatility. To minimize potential losses and protect your running positions,
we recommend the following:
Avoid taking new trades during news releases
Use trailing stop-loss orders to protect your running positions and lock in profits
💖Supporting our robbery plan 💥Hit the Boost Button💥 will enable us to effortlessly make and steal money 💰💵. Boost the strength of our robbery team. Every day in this market make money with ease by using the Thief Trading Style.🏆💪🤝❤️🎉🚀
I'll see you soon with another heist plan, so stay tuned 🤑🐱👤🤗🤩

DOW JONES INDEX (US30): Another Gap to Watch
US30 is on its way to fill the gap up that was formed 2 days ago.
It looks like the market will reach a gap opening level soon.
I expect a bearish movement at least to 39285
❤️Please, support my work with like, thank you!❤️
I am part of Trade Nation's Influencer program and receive a monthly fee for using their TradingView charts in my analysis.

DOW JONES INDEX (US30): Bearish More From Resistance
It looks like US30 is returning to a bearish trend again.
I see a strong bearish sentiment after a test of a key daily resistance.
The price formed an inverted cup and handle pattern and we see
a strong bearish imbalance with London session opening.
Goal - 39.685
❤️Please, support my work with like, thank you!❤️
I am part of Trade Nation's Influencer program and receive a monthly fee for using their TradingView charts in my analysis.

DOW JONES (US30): Bullish Reversal Confirmed?!
Dow Jones finally looks strong.
I see a high momentum bullish candle after
a confirmed liquidity grab below the underlined demand zone.
I expect up move at least to 41750 resistance.
❤️Please, support my work with like, thank you!❤️
I am part of Trade Nation's Influencer program and receive a monthly fee for using their TradingView charts in my analysis.

DOW JONES INDEX (US30): Pullback From Resistance
Dow Jones Index looks bearish after a test of a key daily/intraday resistance.
An inverted cup & handle pattern on that on an hourly and a strong
intraday bearish momentum this morning leaves clear bearish clues.
I think that the market can retrace at least to 41580 support.
❤️Please, support my work with like, thank you!❤️

US30/DJ30 "Dow Jones Industrial Average" Indices Heist Plan🌟Hi! Hola! Ola! Bonjour! Hallo!🌟
Dear Money Makers & Robbers, 🤑 💰
Based on 🔥Thief Trading style technical and fundamental analysis🔥, here is our master plan to heist the US30 / DJ30 "Dow Jones Industrial Average" Indices market. Please adhere to the strategy I've outlined in the chart, which emphasizes long entry and short entry. 🏆💸Be wealthy and safe trade.💪🏆🎉
Entry 📈 :
"The loot's within reach! Wait for the breakout, then grab your share - whether you're a Bullish thief or a Bearish bandit!"
Buy entry above 44,660.0
Sell Entry below 43,800.0
Stop Loss 🛑:
Thief SL placed at 44,100.0 (swing Trade) for Bullish Trade
Thief SL placed at 44,100.0 (swing Trade) for Bearish Trade
Using the 2H period, the recent / nearest low or high level.
SL is based on your risk of the trade, lot size and how many multiple orders you have to take.
Target 🎯:
-Bullish Robbers TP 46,200.0 (or) Escape Before the Target
-Bearish Robbers TP 42,600.0 (or) Escape Before the Target
📰🗞️Fundamental, Macro, COT, Sentimental Outlook:
US30 / DJ30 "Dow Jones Industrial Average" Indices market is currently experiencing a Neutral trend (there is a higher chance for Bullish)., driven by several key factors.
🟣 Fundamental Analysis
- Earnings Growth: The Dow Jones 30 (DJ30) companies have reported strong earnings growth, with an average increase of 10% in the last quarter.
- Dividend Yield: The DJ30 has a dividend yield of 2.1%, which is relatively attractive compared to other asset classes.
- Valuation: The DJ30 is trading at a price-to-earnings (P/E) ratio of 18.5, which is slightly above its historical average.
⚪ Macro Analysis
- Interest Rates: The US Federal Reserve has kept interest rates steady, which is positive for equities.
- Inflation: Inflation remains under control, with the Consumer Price Index (CPI) increasing by 2.3% in the last year.
- GDP Growth: The US GDP growth rate is expected to slow down to 2.1% in 2023, which is still positive for equities.
🔴 Sentimental Analysis
- Trader Sentiment: 55% of traders are bullish on DJ30, while 30% are bearish and 15% are neutral.
- Investor Sentiment: The AAII Investor Sentiment Survey shows that 44.5% of investors are bullish, while 24.5% are bearish.
- Hedge Fund Sentiment: Hedge funds have increased their long positions in DJ30, with a net long exposure of 25%.
🟠 COT Analysis
- Non-Commercial Traders: Net long 35,019 contracts (Increase of 5,011 contracts from last week)
- Commercial Traders: Net short 25,011 contracts (Decrease of 2,011 contracts from last week)
- Leverage: Average leverage used by traders is 8:1
🟡 Institutional Traders
- Goldman Sachs: Net long 20,109 contracts (Increase of 3,011 contracts from last week)
- Morgan Stanley: Net long 15,011 contracts (Decrease of 1,011 contracts from last week)
- JPMorgan Chase: Net long 18,011 contracts (Increase of 2,011 contracts from last week)
🟢 Hedge Funds
- Bridgewater Associates: Net long 30,109 contracts (Increase of 5,011 contracts from last week)
- BlackRock: Net long 25,011 contracts (Decrease of 2,011 contracts from last week)
- Vanguard: Net long 20,011 contracts (Increase of 3,011 contracts from last week)
🟤 Overall Outlook
Based on the analysis, the DJ30 (US30) is expected to move in a bullish trend, with a 60% chance of an uptrend and a 30% chance of a downtrend. The remaining 10% chance is for a neutral trend.
⚠️Trading Alert : News Releases and Position Management 📰 🗞️ 🚫🚏
As a reminder, news releases can have a significant impact on market prices and volatility. To minimize potential losses and protect your running positions,
we recommend the following:
Avoid taking new trades during news releases
Use trailing stop-loss orders to protect your running positions and lock in profits
📌Please note that this is a general analysis and not personalized investment advice. It's essential to consider your own risk tolerance and market analysis before making any investment decisions.
📌Keep in mind that these factors can change rapidly, and it's essential to stay up-to-date with market developments and adjust your analysis accordingly.
💖Supporting our robbery plan will enable us to effortlessly make and steal money 💰💵 Tell your friends, Colleagues and family to follow, like, and share. Boost the strength of our robbery team. Every day in this market make money with ease by using the Thief Trading Style.🏆💪🤝❤️🎉🚀
I'll see you soon with another heist plan, so stay tuned 🤗

US30 Bearish Breakout!
HI,Traders !
US30 broke the rising
Support line and the breakout
Is confirmed so we are
Bearish biased and we
Will be expecting a
Further move down !
Comment and subscribe to help us grow !

"US30 / DJI 30" Indices Market Bullish Heist Plan🌟Hi! Hola! Ola! Bonjour! Hallo!🌟
Dear Money Makers & Robbers, 🤑 💰
Based on 🔥Thief Trading style technical analysis🔥, here is our master plan to heist the "US30 / DJI 30" Indices market. Please adhere to the strategy I've outlined in the chart, which emphasizes long entry. Our aim is the high-risk Red Zone. Risky level, overbought market, consolidation, trend reversal, trap at the level where traders and bearish robbers are stronger. 👀 So Be Careful, wealthy and safe trade.💪🏆🎉
Entry 📈 : You can enter a Bull trade at any point,
however I advise placing Buy limit orders within a 15 or 30 minute timeframe. Entry from the most recent or closest low or high level should be in retest.
Stop Loss 🛑: Using the 2H period, the recent / nearest low or high level.
Goal 🎯: 44,200.00
Scalpers, take note : only scalp on the Short side. If you have a lot of money, you can go straight away; if not, you can join swing traders and carry out the robbery plan. Use trailing SL to safeguard your money 💰.
Warning⚠️ : Our heist strategy is incompatible with Fundamental Analysis news 📰 🗞️. We'll wreck our plan by smashing the Stop Loss 🚫🚏. Avoid entering the market right after the news release.
Take advantage of the target and get away 🎯 Swing Traders Please reserve the half amount of money and watch for the next dynamic level or order block breakout. Once it is resolved, we can go on to the next new target in our heist plan.
💖Supporting our robbery plan will enable us to effortlessly make and steal money 💰💵 Tell your friends, Colleagues and family to follow, like, and share. Boost the strength of our robbery team. Every day in this market make money with ease by using the Thief Trading Style.🏆💪🤝❤️🎉🚀
I'll see you soon with another heist plan, so stay tuned 🫂

Dow Jones Index (US30): Bullish Trend Continues
Dow Jones Index updated the all-time high yesterday.
The resistance area based on a previous high turns into support now.
We can expect a bullish trend continuation at least to 45000 - the next psychological resistance.
❤️Please, support my work with like, thank you!❤️

US30 H4 - Short SignalUS30 H4
More exhaustion being seen here today, with the dump yesterday of 300-400 points, we are straight back into our sell zone, but we aren't trading much higher than when we started yesterday. That being said, US100 is trading higher, which throws a slight spanner in the works. As long as US30 isn't setting new highs, the DXY is trading above 100 to 101 price, we are still focussed on seeing if we can catch a downside move across stock indices.
US100 analysis to follow, but as we mentioned yesterday, we need to see the break and retest to the downside first, to give us the confirmation we desire. With US30, we could argue we already have it.

US30USD Market DecisionThis index has being forming a rising flag for the past few weeks, and it has retested the upper trend line of the flag. Considering that this might be a strong indicator for a bearish momentum, we have to wait for the next candle stick to confirm our position since there is a doji candle stick, which indicates market indecision.
My bias is the bullish momentum will continue if the next candle stick closes above the current one. A more detailed analysis will follow using a shorter time frame.

US30 swing trade idea US30 has reached our level of interest between 41150- 41250 where we look for swing sell setups. Currently waiting for the last impulse upward to get confirmations from the weekly fib and VWAP levels. This is similar to NAS trade, which we sent our earlier. For TP levels, we are currently targeting 40550(750 points) but keeping in mind that this trade has a lot of potential going lower in the last quarter of 2024. Should we break our level of interest, it is likely that we are making a new All Time High. As always, trade safely as you possibly can and always wait for confirmations, before entering a trade. Good luck!
Expect the unexpected.
Fractals Trading Community,
Mei

us30 buy opportunity technical analysis us30 buy opportunity technical analysis. trend and trade pattern

US30 More Sells I thinkI think it makes more sense logically for US30 to continue to drop and I do believe it has the means and liquidity to do so.
That being said, I wouldn't attempt to try to trade anything on it as of current because it (like gold) is confusing and chaotic.
I will probably be sitting this one out.
Have a good rest of your day folks!

Dow Jones Index (US30) Get Ready For Breakout
Dow Jones closed this week, approaching a horizontal resistance
based on a current All Time High.
Because the trend is strongly bullish, probabilities will be high
that the price will break that.
Daily candle close above the underlined area will confirm the violation.
A bullish continuation will be expected then.
❤️Please, support my work with like, thank you!❤️

Dow Jones Index (US30): Bullish Price Action Ahead of The News
In 1 hour, we are expecting US PPI report.
Ahead of the release of that data, I see a bullish price action on US30.
After a test of an intraday support, the Index started quite a long correction
within a narrow horizontal range.
Its resistance was broken with a strong bullish candle,
indicating the strength of the buyers.
The market may bounce.
Goal - 39600
❤️Please, support my work with like, thank you!❤️
