Dow Jones US30 Trend Analysis and Trade Plan Breakdown📈 US30 (Dow Jones) is currently in a strong bullish trend 🔥. This is clearly visible on the 4H chart, where we’re seeing a consistent pattern of higher highs and higher lows 🔼🔼.
👀 I’m watching for a potential long opportunity, especially since the higher timeframes remain firmly bullish 🟢.
🎥 In the video, we break it down:
A quick overview of the 4-hour structure
Then dive into a potential trade setup on the 30-minute chart ⏱️🔍
🧠 This is for educational purposes only and not financial advice ⚠️📚
Us30update

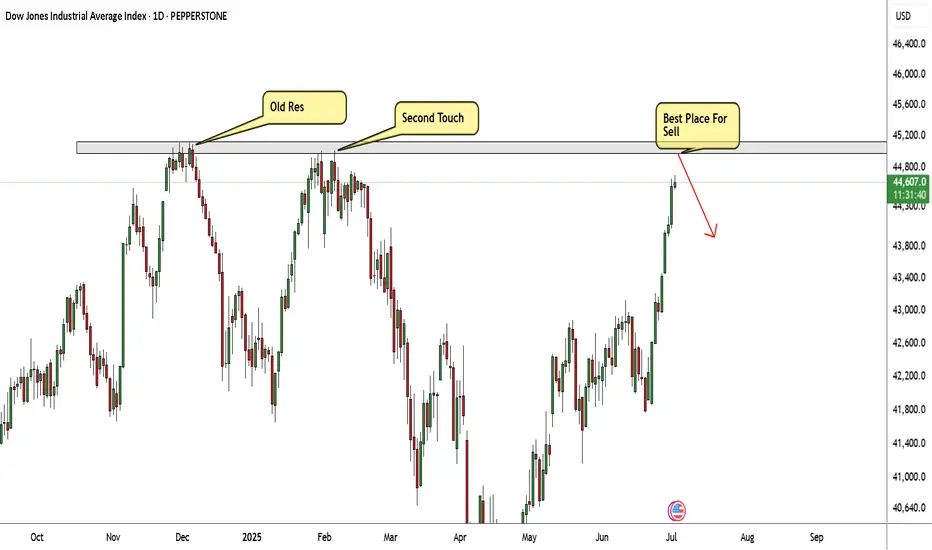
US30 Very Near Strong Res Area , Short Setup To Get 500 Pips !Here is my US30 Daily Chart , the price very near the highest price area , this res area forced the price to go down very hard 2 times so i think this time will be the biggest movement to downside , so i`m waiting the price to touch it and give me a good bearish price action and then we can enter a sell trade and targeting at least 500 pips . if we have a daily closure above then this idea will not be valid .
Why I’m Sitting Out: US30 Reaches Critical Range HighI’m currently keeping a close eye on the US30, along with the other major indices 🧐. What stands out the most right now is how overextended this rally has become across the board 📈.
The key concern here is that price has now pushed into a previous external range high, sweeping liquidity resting just above that level 💧. This area is a textbook zone where big money often steps in to offload positions — it’s the perfect place for institutions to find willing counterparties after prior accumulation 📍💼.
Given the aggressive nature of this move and how far price has stretched, I’m extremely hesitant to get involved at this stage 🚫. I have zero interest in buying into a market that’s trading at a premium and sitting at a potential reversal zone ⚠️.
The prudent move here is to wait for a retrace, followed by a bullish break in structure before considering re-entry 🔁📈. Sometimes, the most powerful edge in trading is knowing when not to trade — and for me, today is one of those days.
⚠️ This is not financial advice — just sharing my current perspective on the market.

US30 – Bearish Setup Below Resistance Zone US30 – Bearish Setup Below Resistance Zone 🚨🟥
The US30 index is exhibiting signs of bearish momentum after repeated rejections from the key resistance zone near 43,200. Let's break down the technical picture:
🔍 Technical Analysis
📌 Resistance Zone (🟥 43,200 area)
Price was rejected twice from this resistance (marked by red arrows), showing strong seller presence.
Bearish candlesticks followed each touch, confirming exhaustion near this level.
📌 Support Zone (🟦 40,800 area)
The area around 40,800 has acted as a strong demand zone in the past (highlighted with green arrows and orange circles).
Price might revisit this area if current bearish structure continues.
📌 Intermediate Support (🟪 41,828)
This level serves as short-term support.
If broken, it could accelerate the decline toward the major support.
📌 Market Structure
Lower highs forming after each bounce indicate weakening bullish strength.
A potential bearish breakout pattern is forming (highlighted by the projected path).
📈 Conclusion & Trade Outlook
Bias: Bearish 📉
Trigger: Break below 41,828 support
Target: 40,800 zone
Invalidation: Break and close above 43,200 resistance

US30 Analysis: Liquidity Dip or Deeper Correction?📉 US30 (Dow Jones) Trade Idea 📉
Currently analysing US30 – the Dow Jones Index 🏛️, and there are some key developments worth noting…
On the 4-hour timeframe, we’re observing a clear shift in market structure, with price breaking through previous lows ⚠️. This raises two possibilities:
🔹 It could be a liquidity grab before a rally 🚀
🔹 Or, it may be the beginning of a deeper end-of-week sell-off targeting levels below 🔻
At this stage, I’m watching for a potential counter-trend short position — but only if the conditions outlined in the video are met with precision 🎯.
🧠 As always, it’s about waiting for confirmation, not jumping in early. Disciplined execution is key. 🧩💼
⚠️ Disclaimer: This is not financial advice. The information provided is for educational purposes only. Always do your own analysis and manage risk accordingly.

US30 Bearish Rejection at Resistance – Potential Drop Ahead📉 US30 Bearish Rejection at Resistance – Potential Drop Ahead 🚨
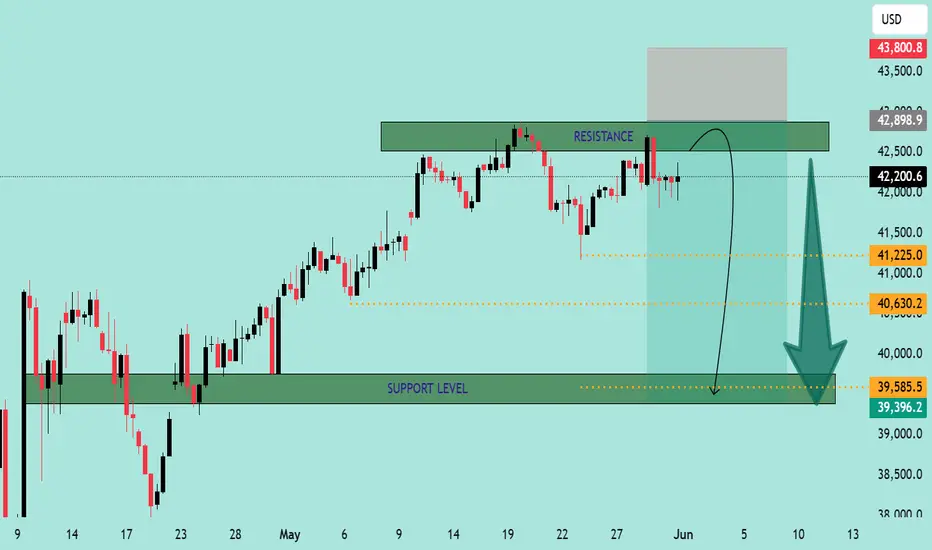
The US30 (Dow Jones Industrial Average) is exhibiting signs of bearish weakness after rejecting a strong resistance zone around 42,898.9 - 43,800.8. Here's a breakdown of the current market structure and outlook:
🔍 Technical Analysis
📌 Resistance Zone (Sell Pressure)
Price has failed to break above the marked resistance area multiple times.
Strong wicks and rejections indicate seller dominance near the top.
A short-term bounce into the resistance is anticipated before a likely reversal.
📌 Support Zone (Buy Interest)
The key support is at 39,396.2 - 39,585.5.
This zone has previously served as a strong demand area, with multiple bullish reversals in the past.
📌 Bearish Projection Path
Chart shows a potential rejection pattern playing out.
Price is expected to retest the resistance, then decline towards the support zone.
Intermediate support levels:
41,225.0
40,630.2
🔄 Outlook
🛑 Scenario A (Likely):
Price tests the upper resistance again and forms a double top or shooting star before declining toward the 39.5k support zone.
✅ Scenario B (Invalidation):
If price closes above 43,800 with strong volume, bearish bias will be invalidated, and a bullish continuation can be expected.
🧭 Trade Idea (Not Financial Advice)
🔹 Entry: Short near 42,800–43,000 (after confirmation)
🔹 Target 1: 41,225
🔹 Target 2: 40,630
🔹 Final Target: 39,585
🔹 Stop Loss: Above 43,800
Conclusion:
⚠️ The chart indicates a high-probability short setup unless bulls manage a strong breakout above resistance. Eyes on the price action near resistance for confirmation. 📉📊
US30Anyone Bearish or Bullish, say something
I willl be aggressively Bullish if US30 breaks the 40000.00 key level and get a clear retest, supporting it to go higher, to 42020.00 key level.
>US30 failed to break 37864.46 key level to continue selling, now 37864.46 is supporting US30 to go higher.
>US30 is supported by the trend line.
But if US30 fails to break the 40000.00 key level. I will be going with the market structure, as US30 is been selling. But will be aggressive selling if US30 trade below 37864.46 key level
Update will be given

Beyond the Noise: US30 Analysis and Actionable Trade Ideas.Technical Analysis: US30 (Dow Jones)
📊 The US30 index is currently displaying a bearish trend on the weekly timeframe. We're observing a strong rally followed by a pullback into equilibrium when measured against the previous price swing range.
🔍 At present, the index sits in a premium zone, creating conditions where short positions may be accumulating for potential downside movement. However, market sentiment remains highly susceptible to external factors, particularly political statements and social media activity from key figures like Donald Trump.
⚠️ Given this unpredictability, a more prudent approach involves shifting focus to lower timeframes and following price action signals directly. The 30-minute chart presents a defined range that offers potential trade opportunities.
💡 Trade Idea: Monitor the current range on the 30-minute timeframe. A decisive break above the range could signal a long entry opportunity, while a break below may indicate a short entry position.
📈 This range-breakout strategy allows traders to adapt to market conditions rather than attempting to predict overall market direction, which has proven increasingly challenging in the current economic and political climate.
Not financial advice.

Dow Jones US30: Spotting a Potential Pullback Opportunity!📉 The Dow Jones US 30 is currently in a dominant bearish trend on the higher timeframes, but 📈 the 1-hour chart reveals a shift in structure with bullish momentum emerging. This could signal a potential short-term retracement back into the previous range, aligning with the 50% Fibonacci retracement zone. 🔄 There’s also a bearish imbalance overhead that may attract price action for rebalancing. While this setup offers a possible buying opportunity, ⚠️ it carries significant risk given the prevailing bearish sentiment. Stay sharp and manage your risk! 🛡️
Disclaimer
⚠️ This is not financial advice. Trading involves substantial risk, and you should only trade with capital you can afford to lose. Always conduct your own analysis or consult a professional before making decisions. 💡

US30 Dow Jones Equal Lows & Structure Shift - Is This Reversing?The US30 is showing key signs that could point to a potential reversal. 🔄 On the 4-hour timeframe, we can see equal lows 🟢 that have been tested three times, followed by a liquidity sweep 💧 and a sharp rally 🚀—indicating possible accumulation by larger market participants.
For confirmation of a Dow Jones bullish reversal, we’ll need to see a pullback forming a higher low 🔽 and then a break in market structure to the upside 📊. In this analysis, we dive into potential price action scenarios based on specific conditions outlined in the video 🎥. If these conditions are not met, the setup will be invalidated ❌.
⚠️ This is for informational purposes only and should not be considered financial advice. 💼

US30: A Thrilling Ride to New Heights or a Deep Dive?Morning everyone, here's what we're looking at with the US30:
If it goes above 43,257, we could see it climb to:
-44,000
-45,000
-Maybe even hit new highs at 47,000
But if it falls below 42,000, expect:
-A drop back to 41,500-41,600
-If that support fails, it might go to 40,740
-And could further dip to 38,606
I know trading can throw some curveballs, and if you're feeling the pressure, I want to help.
I'm doing a webinar this Sunday where we'll talk about:
How to become a more sustainable and profitable trader in a way that's good for your health and happiness, not just your bank account.
If you're interested, hit me up with a message or check my profile for more info. Let's navigate these trading waters together for a more balanced approach.
Kris/ Mindbloome Exchange
Trade What You See

US30 Mid Week Consideration 👀👉 The markets could move in any direction today. Over the past three months, since the Bank of Japan rate hike, we’ve been witnessing aggressive liquidity runs and significant, uneven reversals, particularly on Wednesdays. This midweek phenomenon has caught many traders off guard, making it challenging to adapt. It appears to reflect adjustments in the market algorithms targeting liquidity.
For this reason, I’m sitting out of the New York session today. It’s worth emphasizing that staying out of the market can be just as valuable as posting or executing a trade idea. If you have time, I encourage you to review past charts and observe this recurring Wednesday or midweek reversal phenomenon.
Stay vigilant and know when to step aside. Reducing the frequency of trades is as important as placing them. Focus on quality setups and recognize when the best move is no move at all. While this isn’t financial advice, it’s a practical observation that could prove useful.
Trade smart, and let patience guide you.

US30: A record Higher High is On The Way $43000! Swing TradeBLACKBULL:US30
Fundamentals supports our idea, while looking at the technical side we can confirm that price will drop around 39k to 39.5k this is the zone which remain a key level for the big buyers. Ideally we would wait for price to approach our key level and then take buy entry. However, we might see early price mitigation around $40000 region. Good luck.

US30 Market breadth EMA50 [INVESTIC]
Introducing the 50-day Exponential Moving Average (EMA) Market Breadth for the Dow Jones Industrial Average (DJIA). This tool is designed for traders who want to assess the market’s short- to mid-term momentum with precision. By tracking how many of the 30 Dow Jones stocks are trading above their 50-day EMA, the indicator gives a clear view of market strength or weakness over a moderate timeframe.
Traders may use the indicator to identify and confirm the market's medium-term trends. It strikes a balance between the sensitivity of shorter-term indicators like the 20-day EMA and the long-term perspective of the 200-day EMA. Displayed as a histogram ranging from 0 to 30, this indicator provides a quick and effective way to see how many Dow Jones stocks are maintaining their trends over this mid-range period.
🔶Usage
The 50-day EMA Market Breadth is incredibly versatile, catering to different trading styles. For example:
Intraday Trading:
While the 50-day EMA is more commonly associated with swing or mid-term trading, intraday traders can still use this indicator to confirm the broader market trend, which is crucial for trading with confidence throughout the day.
If the majority of stocks are above their 50-day EMA, it suggests strong underlying momentum. Use this information to support your intraday trades in the direction of the trend. For example, if the histogram shows 20 or more stocks above the 50-day EMA, you might prioritize long positions, knowing that the overall market sentiment is positive. Conversely, if the histogram is low, it may be better to focus on short positions or be more cautious with longs.
Swing Trading:
For swing traders, the 50-day EMA Market Breadth Histogram is a key tool for timing entries and exits within the market's medium-term trends.
You can monitor the histogram regularly to gauge whether the market is supporting your swing trades. If you notice the histogram starting to decline, consider tightening your stop losses or scaling out of positions, as this may signal weakening momentum. Additionally, use the histogram to confirm breakout trades or to stay in trades that are running strong, ensuring that you are aligned with the market’s mid-term direction.
Longer-Term Trading:
Long-term traders can leverage the Market Breadth to gain insights into the market's medium-term health, helping to fine-tune their long-term strategies.
Use the histogram as a barometer for market strength when making decisions about your long-term portfolio. A consistently high histogram suggests a strong mid-term uptrend, which could reinforce your conviction to hold or add to long-term positions. On the other hand, if you see a sustained decline in the histogram, it may be a signal to reassess your portfolio and consider implementing risk management strategies. The indicator can also help you identify potential market lows, when you see the number of stocks on the histogram goes near bottom.
No matter your trading style, the 50-day EMA Market Breadth Indicator offers a comprehensive view of market momentum. By integrating this tool into your daily, weekly, or monthly analysis, you can make more informed decisions that align with the prevailing market trends.

US30 Trade IdeaThe US30 is overextended. I'm looking for the retrace into the imbalance for a short. In the video I cover the entry level, TP and stoploss. Manage your risk well this is not financial advice.

US30 SHORTS FUNDAMENTALLY ;
geopolitical tension makes investors to sell off their stocks and go to a safe haven as gold
technically :
bearish trend
the break of the bullish structure on the daily
three leg extension
deep retest to the broken weekly supply and demand zones
4h looking for shrinking candles
lose of momentum
a long wick shooting star candle indicating my short position
1h double top
30m an engulfing candle as my entry

US30 Bearish Breakout! US30 broke the rising
Support and the breakout
Is confirmed so we are bearish
Biased and we will be expecting
A further move down !

US30 Technical Analysis and Trade Idea - Where To Next👉 Taking a close look at the US30 Dow Jones on the daily timeframe, we can see it’s in a bullish trend. It has reached a key resistance level, and while I’m interested in going long, I won't do so at the current level. Just below the current trading level, there’s a bullish imbalance on the 4-hour timeframe. I prefer waiting for a retracement to the 50-61.8% Fibonacci level for an ideal entry. In the video, we discuss the trend, market structure, price action, and other important aspects of technical analysis. Please note, the video is for educational purposes only and not financial advice. 📊✅

US30 Dow Jones Technical Analysis and Trade IdeaThe US30 Dow Jones index is currently exhibiting a range-bound behavior on the four-hour time frame. Essentially, it has been oscillating within a specific price range. Now, the interesting part is that this range-bound condition opens up potential trading opportunities in either direction.
The movement of the US30 is closely tied to the strength of the US dollar (represented by the DXY index). Here’s how it breaks down:
If the US dollar gains further strength, we might witness a bearish move in the Dow Jones.
Conversely, if the US dollar retraces significantly (especially considering its current overextended bullish state), strength could flow back into the US30.
Our primary focus right now is on a breakout from this range. Keep an eye on two critical levels:
High of the Range: A decisive break above the upper boundary of the range could signal a bullish move.
Low of the Range: Conversely, a breakdown below the lower boundary might trigger a bearish move.
Remember, this analysis serves informational purposes only. As a trader, always make independent decisions based on your risk management strategy. Happy trading! 🚀📈 And, of course, keep in mind that this content does not constitute financial advice. 🛡️🌟

us30 buy setup 1:2 risk reward hello traders this is my 1:2 risk reward setup
the system: institutional tactics
1:2 risk reward
if you like this setup hit the like button subscribe comment and show some love
wish you good luck and good trading

US30 Dow Jones Technical Analysis and Trade IdeaThe US30 Dow Jones index has exhibited a robust bullish trend recently. However, we now observe that the index is approaching a significant resistance level on both the weekly and daily charts.
Moreover, the market appears to be overextended. When a market becomes overextended, there’s a possibility of a reversal. Traders closely monitor signs of exhaustion or weakness.
Given these factors, we are considering a short opportunity. It’s essential to manage risk diligently, as trading always carries inherent risks. Remember that this information is for educational purposes only and should not be construed as financial advice. 📈👍

US30 Dow JonesPair : US30 Dow Jones
Description :
Double Top in Short Time Frame
Completed " 12345 " Impulsive Waves
Fibonacci Level - 261.2%
RSI - Divergence
Bullish Channel as an Corrective Pattern in Short Time Frame and Rejection from Upper Trend Line

US30 Dow Jones Technical Analysis and Trade IdeaIn this video, we delve into a prospective trading opportunity within the US30 Dow Jones index. Our analysis entails evaluating the prevailing trend, scrutinizing price movements, assessing market dynamics, and identifying a potential entry point under favorable conditions, as elaborated in the video. Incorporating robust risk management principles into your trading strategy is crucial. It's imperative to emphasize that this content is presented solely for educational purposes and should not be construed as financial advice.
