US30 Wave Structure BreakdownI have broken down the entire wave structure of the upward impulse which started in October 2022 up to today.
The chart is self explanatory and consist of my main wave count of US30 Index. Right now we are starting our Wave C of corrective cycle which is expected to bottom in the given range but the outlook can change depending on the upcoming news.
US WALL ST 30

Big drop on DOW Jones/US30Looking at three potential areas to short the market from.
Firstly we have the 4hr distribution that occurred prior to the short term drop in the market.
Then we have a potential short from somewhere in between the FVG of the two daily candles.
Lastly, the 50% of the huge daily wick seen in December could be a top in this market from where we can see new lows being made below the 28700 level.


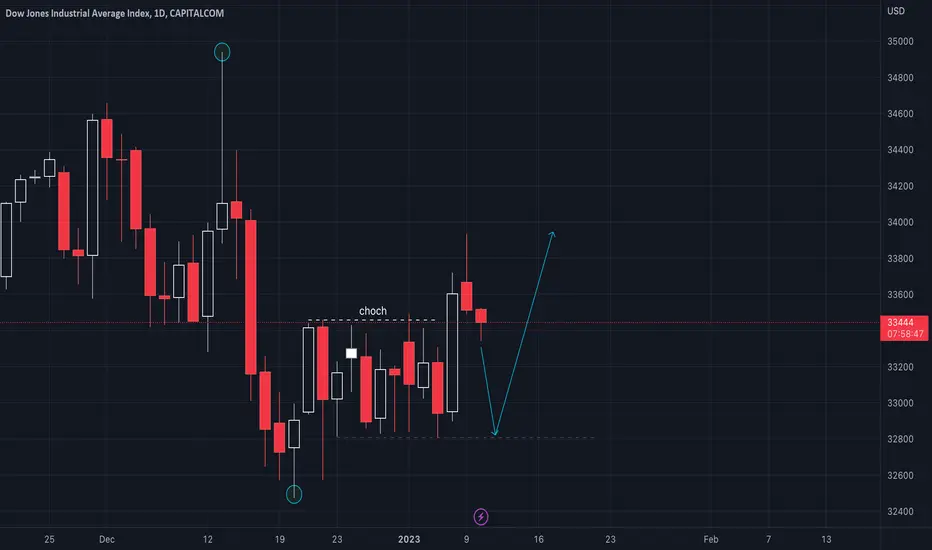
Dow Jones Analysis 25.01.2023Hello Traders,
welcome to this free and educational analysis.
I am going to explain where I think this asset is going to go over the next few days and weeks and where I would look for trading opportunities.
If you have any questions or suggestions which asset I should analyse tomorrow, please leave a comment below.
I will personally reply to every single comment!
If you enjoyed this analysis, I would definitely appreciate it, if you smash that like button and maybe consider following my channel.
Thank you for watching and I will see you tomorrow!
You can also check out my previous analysis of this asset:

US30 Sell setup1:6.9 Risk reward setup on US30
Market broke structure into bearish market
there is and order block wish will be mitigated on the 33700 price level then short
Entry : 33719
stop loss : 33823
take profit : 33000
risk 0.5%

DOW JONES (US30) - Short from bearish orderblock ✅Hello traders!
‼️ This is my perspective of US30.
Here I expect price to continue the retracement to fill the imbalance higher. I am looking for a short position if price rejects from bearish orderblock around 33900 price level.
Like, comment and subscribe to be in touch with my content!

Bullish on US30 We got a nice sell into a demand. Now I'm looking for price to head back up into premium.

US30 20th JANUARY 2023Dow Jones and S&P 500 fell nearly 2% in Wednesday's overnight market, which was the biggest daily drop for both indices in a month. The decline came after weak economic data was released overnight, reigniting fears of a recession. In addition, hawkish comments from Federal Reserve officials also further worsened the fundamental mood of investors.
Before the wall street stock market opened, US economic data for December showed that retail sales and Producer Price Index (PPI) data fell more than expected, while production at US factories also fell and total output in November was weaker than expected.

US30 to find support at previous lows?DOW30 - Intraday - We look to Buy at 32845 (stop at 32645)
Continued downward momentum from 34358 resulted in the pair posting net daily losses yesterday.
The 261.8% Fibonacci extension is located at 32845 from 34358 to 33784.
We have a 78.6% Fibonacci pullback level of 32845 from 32437 to 34347.
Although the anticipated move higher is corrective, it does offer ample risk/reward today.
Our profit targets will be 33370 and 33470
Resistance: 33200 / 33570 / 34034
Support: 32845 / 32812 / 29068
Risk Disclaimer
The trade ideas beyond this page are for informational purposes only and do not constitute investment advice or a solicitation to trade. This information is provided by Signal Centre, a third-party unaffiliated with OANDA, and is intended for general circulation only. OANDA does not guarantee the accuracy of this information and assumes no responsibilities for the information provided by the third party. The information does not take into account the specific investment objectives, financial situation, or particular needs of any particular person. You should take into account your specific investment objectives, financial situation, and particular needs before making a commitment to trade, including seeking advice from an independent financial adviser regarding the suitability of the investment, under a separate engagement, as you deem fit.
You accept that you assume all risks in independently viewing the contents and selecting a chosen strategy.
Where the research is distributed in Singapore to a person who is not an Accredited Investor, Expert Investor or an Institutional Investor, Oanda Asia Pacific Pte Ltd (“OAP“) accepts legal responsibility for the contents of the report to such persons only to the extent required by law. Singapore customers should contact OAP at 6579 8289 for matters arising from, or in connection with, the information/research distributed.

US30 long 300pips - 1,000pipsCheck out the nice zone banks have printed with price action. Head and shoulder pattern possibly forming to complete teacup for bullish push. Seeking 300-1,000pips or 3,000-10,000points depending on your broker.

DOW JONES (US30) - Selloff started ✅Hello traders!
‼️ This is my perspective on US30 .
Here we can see that price filled the imbalances and rejected from bearish orderblock, so I expect we will see bearish price action upcoming days. We can correlate this move with DXY, as USD is expected to get stronger.
Like, comment and subscribe to be in touch with my content!

US30 (High Probability SELL Setup SOON)!!
* Here we can see clearly the next move for Dow Jones Industrial Average ( US30 ) today,
* We can see clearly the formation of Head & Shoulder Reversal Trading Pattern ( M ),
* we've got our EP ( Blue Line ) & our TP ( Golden Line ),
* We're using M15 Time Frame for a Clearer View of our Analysis, hence we can't predict the duration of the market execution,
* Keep a close eye on your trading journey,
* Happy pip hunting traders.
FXKIllA.

US30 LONGHi Traders,
A possibility for price to rise further upwards. Wait for entry at 33704 or a confirmation that break through the bullish channel will be better.
Entry Price: 33704
Target Price: 34427
Hit the Boost and Follow if u agree. Trade Safe!
Thank you.

US30 top-down analysisHello traders, this is a complete multiple timeframe analysis of this pair. We see could find significant trading opportunities as per analysis upon price action confirmation we may take this trade. Smash the like button if you find value in this analysis and drop a comment if you have any questions or let me know which pair to cover in my next analysis.

US30usd buy with big risk US30 price is 31570$ and maybe will go to 29700@ which is the higher price before Corona, and good to buy some quantity with target 33000 and 34000$ .
and be carful if the price break 29000$ maybe will go to 26000$ which also we can buy other quantity .
it is high risk, Risk management is your work .
Good luck
Thank you.
one.exness.link

US30 SHORT BIAS (UPDATED)!Hello beautiful people!
US30 video was deleted by the platform due to an error on my side, however the good news is i have analysed US30 to DATE!
Enjoy! :)

#US30 next uptrendBreak of bearish structure at US30, IMO tries to return to support to continue its path towards an uptrend.
You can take advantage of the retracement towards support or simply wait and take a long position.
Not a signal
DYOR
US30 shortsI believe us30 will head down below to fill the imbalance before continuing to push up and break recent highs

Selling DOW's early optimism.DOW30 - Intraday - We look to Sell at 33803 (stop at 33953)
A Fibonacci confluence area is located at 33803.
There is scope for mild buying at the open but gains should be limited.
Although the anticipated move lower is corrective, it does offer ample risk/reward today.
Further downside is expected and we prefer to set shorts in early trade.
Bespoke support is located at 33310.
Our profit targets will be 33310 and 32760
Resistance: 33803 / 33987 / 34410
Support: 33310 / 32758 / 32441
Risk Disclaimer
The trade ideas beyond this page are for informational purposes only and do not constitute investment advice or a solicitation to trade. This information is provided by Signal Centre, a third-party unaffiliated with OANDA, and is intended for general circulation only. OANDA does not guarantee the accuracy of this information and assumes no responsibilities for the information provided by the third party. The information does not take into account the specific investment objectives, financial situation, or particular needs of any particular person. You should take into account your specific investment objectives, financial situation, and particular needs before making a commitment to trade, including seeking advice from an independent financial adviser regarding the suitability of the investment, under a separate engagement, as you deem fit.
You accept that you assume all risks in independently viewing the contents and selecting a chosen strategy.
Where the research is distributed in Singapore to a person who is not an Accredited Investor, Expert Investor or an Institutional Investor, Oanda Asia Pacific Pte Ltd (“OAP“) accepts legal responsibility for the contents of the report to such persons only to the extent required by law. Singapore customers should contact OAP at 6579 8289 for matters arising from, or in connection with, the information/research distributed.

US30There is a break out here that could lead to a 34755 high. The US30 has been ranging and this could be a new break out for the new year.
I hope the tech companies will be rallying strong in 2023.

US30US30 is going to be down.
Reasons:
1.Liquidity sweep at 4H.
2.Bearish order block after the liquidity sweep.
3.Change of character formed at smaller time frame.
4.Break of structure formation.
Set TP and SL according to mention.

US30 (High Probability BUY Setup, TP HIT)!!Here we can see clearly how our SELL & BUY SETUP has worked up perfectly as we predicted in our previous post,
Keep your eyes close on your trading journey,
Happy pip hunting traders.
FXKILLA.

Take a look at this DOW US30 Potential Sell opportunityAs mentioned in the last post if price clears the lower end of the range the technical picture looks good for another nice leg down.
Check out the same levels on a weekly chart for the bigger picture.
Stocks may not be finished selling of yet.
*****************************************************************************************************************************************************
If you enjoy our work and what we share please take one moment to follow us on this platform at give us the thumbs up,
by doing so we gain the feedback needed for us to continue sharing our analysis here.
Thankyou
