US30 PENDING BUY VRTX TRADE US30 last week complete to fill the lvn gap, with the week of trading I do expect that the market may start to build a new consolidation area based off of previous hvn ranges back in June I would reframe from trading that area and wait until the market breaks out of that high volume node
US30 Buy Stop
Entry 33305-33320
Stop Loss 33140
Take Profit 34310
US WALL ST 30

US30 BUY ANALYSISLooking at US30 on 30M timeframe
Currently looking for long/buy position
We currently waiting for signals of reversal whereby we will then execute the trade

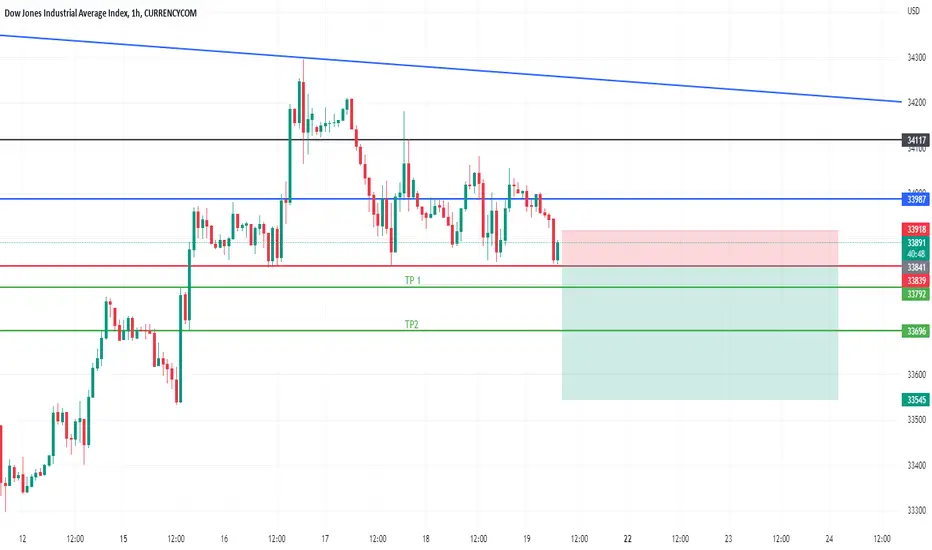
US30USD: Dow Jones : TP1 ReachedHello friends
.Update analysis
.TP1 Reached
.This analysis is still active
.You can view and compare the attached chart and analysis
..Follow me to see more analysis

US30 Reversing for a correction after that big move down us30 is now making a correction for TP use FIB retracement and we have oversold as shows the indicators as a more confirmation

US30 SELL SETUPUS30. Technically we looking at the three touches on our major trendline. lets break down our analysis, Weekly chart we got our candle stick confirmation doji, whereas it occurred at our major trendline moving to daily, we see the selling momentum and we clearly see how the inner channel got broken. the price is facing down more pressure is coming. 4H get clear corrections to the down side. Technically am looking for price to complete my double bottom pattern.

US30 23rd AUGUST 2022Investors are still anticipating Fed Chair Jerome Powell's latest comments on inflation conditions and potential interest rate hikes during the US central bank's annual economic symposium to be held in Jackson Hole, Wyoming next Friday (26/8). Fed Chair Powell is likely to sound much more hawkish during his speech in Jackson Hole on Friday (26/8) at 10am than he did at his July 27, 2022 press conference, when he said the Fed Funds rate was back to neutral.

US30 scalp short setupGoing to catch a short on that white 15 min level, and have my sl above my 1hr trend(Red). TP1 is that first 4hr level, going to close half my positions there and go break even on the other half. The second half will close at the yellow 4h level.

Selling rallies on US Wall St 30US30USD - Intraday - We look to Sell at 33964 (stop at 34295)
Although the bulls are in control, the stalling positive momentum indicates a turnaround is possible. A lower correction is expected. Horizontal resistance is seen at 34000. We look to sell rallies. Further downside is expected.
Our profit targets will be 33212 and 33000
Resistance: 34000 / 35500 / 37000
Support: 33200 / 31600 / 29600
Risk Disclaimer
The trade ideas beyond this page are for informational purposes only and do not constitute investment advice or a solicitation to trade. This information is provided by Signal Centre, a third-party unaffiliated with OANDA, and is intended for general circulation only. OANDA does not guarantee the accuracy of this information and assumes no responsibilities for the information provided by the third party. The information does not take into account the specific investment objectives, financial situation, or particular needs of any particular person. You should take into account your specific investment objectives, financial situation, and particular needs before making a commitment to trade, including seeking advice from an independent financial adviser regarding the suitability of the investment, under a separate engagement, as you deem fit.
You accept that you assume all risks in independently viewing the contents and selecting a chosen strategy.
Where the research is distributed in Singapore to a person who is not an Accredited Investor, Expert Investor or an Institutional Investor, Oanda Asia Pacific Pte Ltd (“OAP“) accepts legal responsibility for the contents of the report to such persons only to the extent required by law. Singapore customers should contact OAP at 6579 8289 for matters arising from, or in connection with, the information/research distributed.'

US30 SHORTOANDA:US30USD
US30 has broken its bullish structure. A retest formed and the bearish engulfing candle
which has formed is confirmation for entry. Target is the weekly key support level
I highlighted on the weekly timeframe.

US30USD YM1! DOW 2022 AUG 22 Week
US30USD YM1! DOW 2022 AUG 22 Week
Last week supply returned for Scenario2 short opportunity.
Possible scenarios:
1) Daily/Weekly analysis showed minor strength,
let's see if demand is able to overcome supply for uptrend
continuation.
2) Short on rejection of 34027 or market
retraced on low volume.
Price reaction levels
Short on Test and Reject | Long on Test and Accept
34807 34027 33205
Weekly: Ave vol down bar close off low = minor strength
Daily: Ave vol down bar close off low = minor strength
H4: Very high volume up bar close off high followed by
down bar = weakness
Remember to like and follow if you find this useful.
Have a profitable week ahead.


us30 potential sell after breaking the supportkind of head and shoulder with triple top and we can of descending triangle on 1H time frame
US30 30 M GAPHello friends! US30 GAP on 30 M a break of the resistance will be interesting for a potential BUY .

US30 Head and shoulders on 1Hhello friends! here's a head and shoulders on 1H time frame a break of the support will be interesting for a potential SELL

us30 djireaching the top of their respective channel and nearing resistance lines too.this would be the ideal entry point with a conservative profit take at around 32300 - I think it's possible it may drop

us30 FundamentalIf you want to be consistent, understand what the algorithm and how it play around with price. stop paying attention to these closed doors traders that always post before and after, ask Hank to do it live to. I promised this video here it is.

Us30 Bias on the Manipulation side overall my bias is still bullonce us30 deep we know that is manipulation. Looking forward for delivery to the upside. therefor target buys only. do not force them. Anything to the downside won't be long term. Keep an eye for ICT OBS on 5 mins and 15 mins. IF NOT LET THE FUNDAMENTALS LAY OUT THE SETUPS AND TRADE AFTERWARDS. Keep in mind yesterday's candle. those rectangles are ICT OBS ON 5 MINS

us30 biasDo not be greedy, be realistic to yourself. Us30 is bullish but we have potential drawdown for reversals

S&P 500 INDEX D1ello friends
📉Based on the chart: Important levels are marked
.The price is currently at a resistance level . We also see a pattern of 1 RISING WEDGE
.The direction of movement is shown in the chart
.We have two scenarios. The first scenario is a sell position(60% probability )
.We are looking for a sell position
.📢 Please follow your strategy, , this is just my idea
.🙌Please do not forget the ' like' button & Share it with your friends
.✍ I will be glad to see your ideas in this post
.🧲Follow me to see more analysis

us30 djius30 in long time view
in my idea its in a big downward channle , the good resistant box we see at this rate and the 0.618 fibo correction.
wathch be resistant box and wait for sell confirmation.
I will be happy to tell me what's your idea

US30USD:DOW JONES:D1Hello friends
.The price is in the resistance range. So we will have two scenarios
.Price is in an important decision-making range
.We will look for signs of a price reversal or breakout
.The direction of movement is shown in the chart
.📢 Please follow your strategy, , this is just my idea
.🙌Please do not forget the ' like' button & Share it with your friends
.✍ I will be glad to see your ideas in this post
.🧲Follow me to see more analysis

US30USD YM1! DOW 2022 AUG 15 Week
US30USD YM1! DOW 2022 AUG 15 Week
Last week market reached previous supply zone.
Long on retracement continues still preferred
Possible scenarios:
1) Continue of upward momentum for long on retracement
2) Short on rejection at channel supply
Price reaction levels
Short on Test and Reject | Long on Test and Accept
34807 34027 33205
Weekly: Ave vol up bar = minor strength
Daily: Ave vol up bar = minor strength
H4: Ave vol up bar = minor strength.
Remember to like and follow if you find this useful.
Have a profitable week ahead.

Dow Jones : Trade Close:Target ReachedHello friends
.Update analysis
..Trade Close:Target Reached
TP1 AND TP2 REACHED
..You can view and compare the attached chart and analysis
..Follow me to see more analysis
