"US30 / DJI" Indices Market Bearish Heist Plan🌟Hi! Hola! Ola! Bonjour! Hallo!🌟
Dear Money Makers & Robbers, 🤑 💰🐱👤🐱🏍
Based on 🔥Thief Trading style technical and fundamental analysis🔥, here is our master plan to heist the "US30 / DJI" Indices Market. Please adhere to the strategy I've outlined in the chart, which emphasizes short entry. Our aim is the high-risk Green Zone. Risky level, oversold market, consolidation, trend reversal, trap at the level where traders and bullish thieves are getting stronger. 🏆💸Book Profits Be wealthy and safe trade.💪🏆🎉
Entry 📈 : "The vault is wide open! Swipe the Bearish loot at any price - the heist is on!
however I advise placing Sell limit orders within a 15 or 30 minute timeframe. Entry from the most recent or closest low or high level should be in retest.
Stop Loss 🛑: Thief SL placed at (44200) swing Trade Basis Using the 4H period, the recent / swing high or low level.
SL is based on your risk of the trade, lot size and how many multiple orders you have to take.
Target 🎯: 42200 (or) Escape Before the Target
🧲Scalpers, take note 👀 : only scalp on the Short side. If you have a lot of money, you can go straight away; if not, you can join swing traders and carry out the robbery plan. Use trailing SL to safeguard your money 💰.
📰🗞️Fundamental, Macro, COT, Sentimental Outlook:
"US30 / DJI" Indices Market is currently experiencing a Bearish trend., driven by several key factors.
🟣Fundamental Analysis
Earnings: Q4 2024 EPS growth strong (e.g., 16.9% for S&P 500 proxies)—bullish, but US30 firms face tariff uncertainty.
Rates: Fed at 3-3.5%, no cuts signaled—real yields ~1% (10-year Treasury 3.8%) pressure equities—bearish.
Inflation: PCE 2.6% (Jan 2025)—persistent inflation supports Fed stance, bearish for stocks.
Growth: U.S. consumer spending wanes (Schwab)—mixed, neutral impact.
Geopolitics: Trump tariffs (25% Mexico/Canada, 10% China)—short-term volatility, long-term bullish for U.S. firms.
🟤Macro Economics
Federal Reserve Policy: The Federal Reserve has been raising interest rates to combat inflation, which has led to a strengthening of the US dollar.
US Economy: The US economy has been showing signs of slowing down, with GDP growth rates decreasing.
Global Economy: The global economy has been experiencing a slowdown, with many countries experiencing recession.
⚪Commitments of Traders (COT) Data
Speculators: Net long ~55,000 contracts (down from 65,000)—cooling bullishness.
Hedgers: Net short ~60,000—stable, locking in gains.
Open Interest: ~125,000 contracts—steady global interest, neutral.
🔴Market Sentimental Analysis
Bullish Sentiment: Some analysts believe that the US30 will break above the resistance at 45,000 and continue rising.
Bearish Sentiment: Many investors expect a correction, with a potential target of 42200.
Risk Aversion: The market is experiencing risk aversion, with investors seeking safe-haven assets.
🔵Positioning Analysis
Long Positions: Some investors are holding long positions in US30, expecting a breakout above 45,000.
Short Positions: Many investors are holding short positions in US30, expecting a correction.
🟠Quantitative Analysis
Technical Indicators: The 14-day Relative Strength Index (RSI) is at 45, indicating a neutral sentiment.
Moving Averages: The 21-day Simple Moving Average (SMA) is at 44,404, providing resistance for US30 prices.
🟡Intermarket Analysis
DXY: 106.00—USD softness aids equities—bullish.
XAU/USD: 2910—gold rise signals risk-off, bearish for US30.
NDX: ~20,000, tech softening—correlated pressure on US30—bearish.
Bonds: U.S. 10-year 3.8%—yield stability neutral.
🟢News and Events Analysis
Federal Reserve Meeting: The Federal Reserve is scheduled to meet on March 15-16, with investors expecting a potential rate hike.
US Economic Data: The US economic data, including the Non-Farm Payrolls report, is being closely watched for its impact on US30 prices.
🟣Next Trend Move
Bullish Trend: Some analysts believe that the US30 will break above the resistance at 45,000 and continue rising.
Bearish Trend: Many investors expect a correction, with a potential target of 42,200.
🔴Overall Summary Outlook
Bullish Outlook: Some analysts believe that the US30 will break above the resistance at 45,000 and continue rising.
Bearish Outlook: Many investors expect a correction, with a potential target of 42,200.
📌Keep in mind that these factors can change rapidly, and it's essential to stay up-to-date with market developments and adjust your analysis accordingly.
⚠️Trading Alert : News Releases and Position Management 📰 🗞️ 🚫🚏
As a reminder, news releases can have a significant impact on market prices and volatility. To minimize potential losses and protect your running positions,
we recommend the following:
Avoid taking new trades during news releases
Use trailing stop-loss orders to protect your running positions and lock in profits
💖Supporting our robbery plan 💥Hit the Boost Button💥 will enable us to effortlessly make and steal money 💰💵. Boost the strength of our robbery team. Every day in this market make money with ease by using the Thief Trading Style.🏆💪🤝❤️🎉🚀
I'll see you soon with another heist plan, so stay tuned 🤑🐱👤🤗🤩
US WALL ST 30

US30 (Dow Jones) Buy Analysis: GTEUS30 has successfully pushed through an Inverse Fair Value Gap (IFVG) on the 1-hour timeframe, confirming bullish momentum. Price action suggests a continuation upward, with the next target being the top trendline around 41,950 - 42,000.
With CPI news scheduled for tomorrow morning, we can anticipate further volatility, but until then, US30 is likely to maintain its bullish structure. As long as price holds above the recent support zone around 41,500, the bias remains bullish towards the higher resistance levels.

Falling towards pullback support?Dow Jones (US30) is fallling towards the pivot and could boucne to the 1st resistance.
Pivot: 41,777.16
1st Support: 40,202.56
1st Resistance: 43,339.19
Risk Warning:
Trading Forex and CFDs carries a high level of risk to your capital and you should only trade with money you can afford to lose. Trading Forex and CFDs may not be suitable for all investors, so please ensure that you fully understand the risks involved and seek independent advice if necessary.
Disclaimer:
The above opinions given constitute general market commentary, and do not constitute the opinion or advice of IC Markets or any form of personal or investment advice.
Any opinions, news, research, analyses, prices, other information, or links to third-party sites contained on this website are provided on an "as-is" basis, are intended only to be informative, is not an advice nor a recommendation, nor research, or a record of our trading prices, or an offer of, or solicitation for a transaction in any financial instrument and thus should not be treated as such. The information provided does not involve any specific investment objectives, financial situation and needs of any specific person who may receive it. Please be aware, that past performance is not a reliable indicator of future performance and/or results. Past Performance or Forward-looking scenarios based upon the reasonable beliefs of the third-party provider are not a guarantee of future performance. Actual results may differ materially from those anticipated in forward-looking or past performance statements. IC Markets makes no representation or warranty and assumes no liability as to the accuracy or completeness of the information provided, nor any loss arising from any investment based on a recommendation, forecast or any information supplied by any third-party.

US30 Setup: 50% Fib & Imbalance in Focus for a Potential Short.The US 30 Dow Jones index is under pressure 📉 but is currently hovering around a significant previous support level. I’m watching for a retracement into a four-hour imbalance as a potential opportunity to go short. Additionally, I’m looking for the retrace to align with the equilibrium point, which is the 50% Fibonacci level of the current price swing from high to low 📊. For this trade, the price must stay within the imbalance zone and avoid breaking the high. If there’s a clear break of structure near the imbalance point of interest, I plan to sell 🔻. This is not financial advice. 🚨

US30 sellOverall Trend:
The overall trend has been bullish, but there has been a breakout below the ascending trendline.
The price is currently retracing towards support zones.
Key Levels:
Main Resistance: Range between 45,208 - 45,300 (upper red zone)
Main Support: Range between 44,300 - 44,500 (lower red zone)
Important Mid-Level: Around 44,866
Trading Scenario:
After hitting resistance, the price has started a correction.
The highlighted green area marks a potential entry zone.
📉 Trading Signal:
🔹 Enter Short Position:
If the price pulls back to the 44,600 - 44,700 area and shows signs of bullish weakness, a short position could be considered.
🔹 Stop Loss:
Above the resistance zone at 45,208 (e.g., around 45,300)
🔹 Take Profit:
First level at 44,300
Second level at 43,663 (shown on the chart)
Third level at 43,140 if the downtrend continues
🔹 Risk Management:
The risk-to-reward ratio for this trade seems reasonable. Reassess the trade if the price breaks above 44,866.
✅ Conclusion:
Currently expecting a bearish correction, but if reversal candles or weakness in sellers are observed at support levels, there might be a chance for a trend change.

"US30/DJ30" Indices CFD Market Bearish Heist Plan🌟Hi! Hola! Ola! Bonjour! Hallo!🌟
Dear Money Makers & Robbers, 🤑 💰🐱👤🐱🏍
Based on 🔥Thief Trading style technical and fundamental analysis🔥, here is our master plan to heist the "US30/DJ30" Indices CFD Market. Please adhere to the strategy I've outlined in the chart, which emphasizes short entry. Our aim is the high-risk Green Zone. Risky level, oversold market, consolidation, trend reversal, trap at the level where traders and bullish thieves are getting stronger. 🏆💸Book Profits Be wealthy and safe trade.💪🏆🎉
Entry 📈 : "The heist is on! Wait for the breakout (44,000.0) then make your move - Bearish profits await!"
however I advise placing Sell Stop Orders below the breakout MA or Place Sell limit orders within a 15 or 30 minute timeframe. Entry from the most recent or closest low or high level should be in retest.
Stop Loss 🛑: Thief SL placed at 44,600.0 (swing Trade Basis) Using the 4H period, the recent / swing high or low level.
SL is based on your risk of the trade, lot size and how many multiple orders you have to take.
Target 🎯: 43,000.0 (or) Escape Before the Target
🧲Scalpers, take note 👀 : only scalp on the Short side. If you have a lot of money, you can go straight away; if not, you can join swing traders and carry out the robbery plan. Use trailing SL to safeguard your money 💰.
📰🗞️Fundamental, Macro, COT, Sentimental Outlook:
"US30/DJ30" Indices CFD Market is currently experiencing a Bearish trend., driven by several key factors.
⚪Fundamental Analysis
The US30 index is influenced by the overall performance of the US economy, including GDP growth rate, inflation, and interest rates. Currently, the US economy is experiencing a moderate growth rate, with a slight increase in inflation.
🔴Macroeconomic Analysis
The Federal Reserve has maintained a hawkish stance, with interest rates expected to remain high in the short term. This has led to a strengthening of the US dollar, which may impact the US30 index.
🟢COT Data Analysis
The Commitments of Traders (COT) report shows that commercial traders are net short, while non-commercial traders are net long. This indicates a potential trend reversal.
🟡Sentimental Analysis
Market sentiment is slightly bearish, with 55% of traders holding short positions.
🟤Positioning Data Analysis
Institutional traders are holding short positions, while corporate traders are holding long positions. Banks are maintaining a bearish stance.
🔵Market Sentiment
- Institutional Traders: 60% bearish, 40% bullish
- Hedge Funds: 70% bearish, 30% bullish
- Retail Traders: 55% bullish, 45% bearish
🟣Overall Outlook
The US30 index is expected to remain volatile in the short term, with a slight bearish bias due to the hawkish stance of the Federal Reserve. However, the index's movement will largely depend on the overall performance of the US economy and global economic trends.
⚠️Trading Alert : News Releases and Position Management 📰 🗞️ 🚫🚏
As a reminder, news releases can have a significant impact on market prices and volatility. To minimize potential losses and protect your running positions,
we recommend the following:
Avoid taking new trades during news releases
Use trailing stop-loss orders to protect your running positions and lock in profits
📌Please note that this is a general analysis and not personalized investment advice. It's essential to consider your own risk tolerance and market analysis before making any investment decisions.
📌Keep in mind that these factors can change rapidly, and it's essential to stay up-to-date with market developments and adjust your analysis accordingly.
💖Supporting our robbery plan will enable us to effortlessly make and steal money 💰💵 Tell your friends, Colleagues and family to follow, like, and share. Boost the strength of our robbery team. Every day in this market make money with ease by using the Thief Trading Style.🏆💪🤝❤️🎉🚀
I'll see you soon with another heist plan, so stay tuned 🤑🐱👤🤗🤩


Bearish drop?Dow Jones (US30) is rising towards the pivot and could drop to the 1st support which has been identified as a pullback support.
Pivot: 44,615.69
1st Support: 43,759.97
1st Resistance: 44,991.93
Risk Warning:
Trading Forex and CFDs carries a high level of risk to your capital and you should only trade with money you can afford to lose. Trading Forex and CFDs may not be suitable for all investors, so please ensure that you fully understand the risks involved and seek independent advice if necessary.
Disclaimer:
The above opinions given constitute general market commentary, and do not constitute the opinion or advice of IC Markets or any form of personal or investment advice.
Any opinions, news, research, analyses, prices, other information, or links to third-party sites contained on this website are provided on an "as-is" basis, are intended only to be informative, is not an advice nor a recommendation, nor research, or a record of our trading prices, or an offer of, or solicitation for a transaction in any financial instrument and thus should not be treated as such. The information provided does not involve any specific investment objectives, financial situation and needs of any specific person who may receive it. Please be aware, that past performance is not a reliable indicator of future performance and/or results. Past Performance or Forward-looking scenarios based upon the reasonable beliefs of the third-party provider are not a guarantee of future performance. Actual results may differ materially from those anticipated in forward-looking or past performance statements. IC Markets makes no representation or warranty and assumes no liability as to the accuracy or completeness of the information provided, nor any loss arising from any investment based on a recommendation, forecast or any information supplied by any third-party.

US30/DJ30 "Dow Jones Industrial Average" Indices Heist Plan🌟Hi! Hola! Ola! Bonjour! Hallo!🌟
Dear Money Makers & Robbers, 🤑 💰
Based on 🔥Thief Trading style technical and fundamental analysis🔥, here is our master plan to heist the US30 / DJ30 "Dow Jones Industrial Average" Indices market. Please adhere to the strategy I've outlined in the chart, which emphasizes long entry and short entry. 🏆💸Be wealthy and safe trade.💪🏆🎉
Entry 📈 :
"The loot's within reach! Wait for the breakout, then grab your share - whether you're a Bullish thief or a Bearish bandit!"
Buy entry above 44,660.0
Sell Entry below 43,800.0
Stop Loss 🛑:
Thief SL placed at 44,100.0 (swing Trade) for Bullish Trade
Thief SL placed at 44,100.0 (swing Trade) for Bearish Trade
Using the 2H period, the recent / nearest low or high level.
SL is based on your risk of the trade, lot size and how many multiple orders you have to take.
Target 🎯:
-Bullish Robbers TP 46,200.0 (or) Escape Before the Target
-Bearish Robbers TP 42,600.0 (or) Escape Before the Target
📰🗞️Fundamental, Macro, COT, Sentimental Outlook:
US30 / DJ30 "Dow Jones Industrial Average" Indices market is currently experiencing a Neutral trend (there is a higher chance for Bullish)., driven by several key factors.
🟣 Fundamental Analysis
- Earnings Growth: The Dow Jones 30 (DJ30) companies have reported strong earnings growth, with an average increase of 10% in the last quarter.
- Dividend Yield: The DJ30 has a dividend yield of 2.1%, which is relatively attractive compared to other asset classes.
- Valuation: The DJ30 is trading at a price-to-earnings (P/E) ratio of 18.5, which is slightly above its historical average.
⚪ Macro Analysis
- Interest Rates: The US Federal Reserve has kept interest rates steady, which is positive for equities.
- Inflation: Inflation remains under control, with the Consumer Price Index (CPI) increasing by 2.3% in the last year.
- GDP Growth: The US GDP growth rate is expected to slow down to 2.1% in 2023, which is still positive for equities.
🔴 Sentimental Analysis
- Trader Sentiment: 55% of traders are bullish on DJ30, while 30% are bearish and 15% are neutral.
- Investor Sentiment: The AAII Investor Sentiment Survey shows that 44.5% of investors are bullish, while 24.5% are bearish.
- Hedge Fund Sentiment: Hedge funds have increased their long positions in DJ30, with a net long exposure of 25%.
🟠 COT Analysis
- Non-Commercial Traders: Net long 35,019 contracts (Increase of 5,011 contracts from last week)
- Commercial Traders: Net short 25,011 contracts (Decrease of 2,011 contracts from last week)
- Leverage: Average leverage used by traders is 8:1
🟡 Institutional Traders
- Goldman Sachs: Net long 20,109 contracts (Increase of 3,011 contracts from last week)
- Morgan Stanley: Net long 15,011 contracts (Decrease of 1,011 contracts from last week)
- JPMorgan Chase: Net long 18,011 contracts (Increase of 2,011 contracts from last week)
🟢 Hedge Funds
- Bridgewater Associates: Net long 30,109 contracts (Increase of 5,011 contracts from last week)
- BlackRock: Net long 25,011 contracts (Decrease of 2,011 contracts from last week)
- Vanguard: Net long 20,011 contracts (Increase of 3,011 contracts from last week)
🟤 Overall Outlook
Based on the analysis, the DJ30 (US30) is expected to move in a bullish trend, with a 60% chance of an uptrend and a 30% chance of a downtrend. The remaining 10% chance is for a neutral trend.
⚠️Trading Alert : News Releases and Position Management 📰 🗞️ 🚫🚏
As a reminder, news releases can have a significant impact on market prices and volatility. To minimize potential losses and protect your running positions,
we recommend the following:
Avoid taking new trades during news releases
Use trailing stop-loss orders to protect your running positions and lock in profits
📌Please note that this is a general analysis and not personalized investment advice. It's essential to consider your own risk tolerance and market analysis before making any investment decisions.
📌Keep in mind that these factors can change rapidly, and it's essential to stay up-to-date with market developments and adjust your analysis accordingly.
💖Supporting our robbery plan will enable us to effortlessly make and steal money 💰💵 Tell your friends, Colleagues and family to follow, like, and share. Boost the strength of our robbery team. Every day in this market make money with ease by using the Thief Trading Style.🏆💪🤝❤️🎉🚀
I'll see you soon with another heist plan, so stay tuned 🤗

Potential bearish drop?Dow Jones (US30) has reacted off the pivot which has been identified as a pullback resistance and could drop to the 1st support that lines up with the 50% Fibonacci retracement.
Pivot: 45,056.62
1st Support: 43,298.77
1st Resistance: 46,066.08
Risk Warning:
Trading Forex and CFDs carries a high level of risk to your capital and you should only trade with money you can afford to lose. Trading Forex and CFDs may not be suitable for all investors, so please ensure that you fully understand the risks involved and seek independent advice if necessary.
Disclaimer:
The above opinions given constitute general market commentary, and do not constitute the opinion or advice of IC Markets or any form of personal or investment advice.
Any opinions, news, research, analyses, prices, other information, or links to third-party sites contained on this website are provided on an "as-is" basis, are intended only to be informative, is not an advice nor a recommendation, nor research, or a record of our trading prices, or an offer of, or solicitation for a transaction in any financial instrument and thus should not be treated as such. The information provided does not involve any specific investment objectives, financial situation and needs of any specific person who may receive it. Please be aware, that past performance is not a reliable indicator of future performance and/or results. Past Performance or Forward-looking scenarios based upon the reasonable beliefs of the third-party provider are not a guarantee of future performance. Actual results may differ materially from those anticipated in forward-looking or past performance statements. IC Markets makes no representation or warranty and assumes no liability as to the accuracy or completeness of the information provided, nor any loss arising from any investment based on a recommendation, forecast or any information supplied by any third-party.


US30 Bearish Bias!
HI,Traders !
US30 made a bearish
Breakout of the key
Horizontal level of 44620.76
Which is now a resistance
And we will be expecting
A further move down After
retesting broken level !
Comment and subscribe to help us grow !

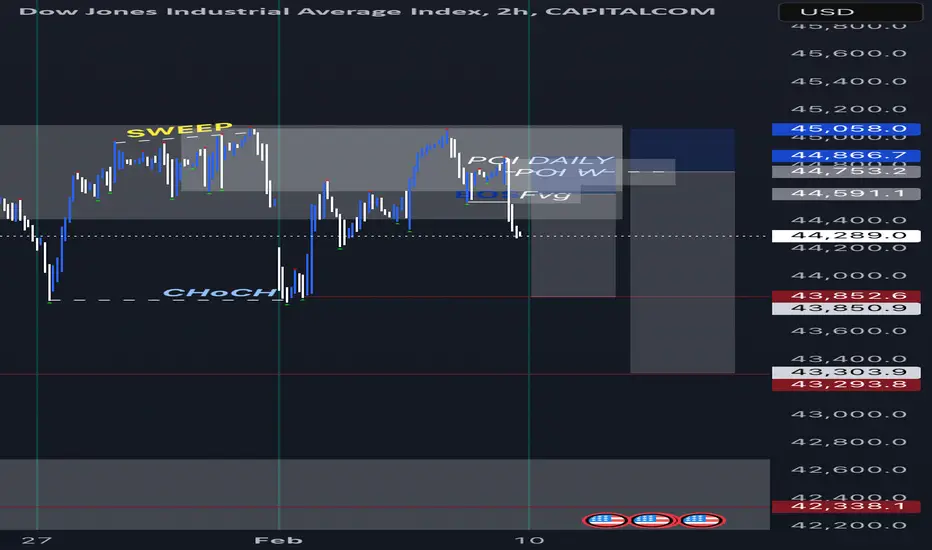
US30 TRADE IDEA: SHORT | SELL (10/08)Price has been bullish overall. While it has been overall bullish - price hasn’t broken from its consolidation, therefore in the meanwhile we’ll take advantage of the situation. Price has broken down on the 4H TF, so we’re looking for an optimal entry. Although I have marked out FVG - I believe the uppermost order block is a great place to enter from.
RR 1 : 2.69
RR 2 : 2.95
RR 3 : 4.82
N.B.: This is not financial advice. Trade safely and with caution.
Falling towards pullback support?Dow Jones (US30) is falling towards the pivot and could bounce to the 1st resistance which has been identified as a pullback resistance.
Pivot: 44,276.40
1st Support: 43,763.49
1st Resistance: 44,991.93
Risk Warning:
Trading Forex and CFDs carries a high level of risk to your capital and you should only trade with money you can afford to lose. Trading Forex and CFDs may not be suitable for all investors, so please ensure that you fully understand the risks involved and seek independent advice if necessary.
Disclaimer:
The above opinions given constitute general market commentary, and do not constitute the opinion or advice of IC Markets or any form of personal or investment advice.
Any opinions, news, research, analyses, prices, other information, or links to third-party sites contained on this website are provided on an "as-is" basis, are intended only to be informative, is not an advice nor a recommendation, nor research, or a record of our trading prices, or an offer of, or solicitation for a transaction in any financial instrument and thus should not be treated as such. The information provided does not involve any specific investment objectives, financial situation and needs of any specific person who may receive it. Please be aware, that past performance is not a reliable indicator of future performance and/or results. Past Performance or Forward-looking scenarios based upon the reasonable beliefs of the third-party provider are not a guarantee of future performance. Actual results may differ materially from those anticipated in forward-looking or past performance statements. IC Markets makes no representation or warranty and assumes no liability as to the accuracy or completeness of the information provided, nor any loss arising from any investment based on a recommendation, forecast or any information supplied by any third-party.

DOW JONES - Long after filling the imbalance !!Hello traders!
‼️ This is my perspective on DOW JONES.
Technical analysis: Here we are in a bullish market structure from 4H timeframe perspective, so I look for a long. I wait price to continue the retracement to fill the imbalance and then to reject from bullish OB around 44,000.
Like, comment and subscribe to be in touch with my content!

US30 Analysis: Is This Resistance the Turning Point?👀 👉 In this video, we conduct an in-depth analysis of US30, dissecting its prevailing uptrend and the recent retracements from resistance. We’ll examine key support and resistance zones, market structure, and price action behavior to identify potential trade scenarios. With price nearing a significant resistance level, we assess possible countertrend opportunities—provided price action aligns with our technical outlook. Watch now for a comprehensive breakdown. This analysis is for educational purposes only and should not be considered financial advice.

Bearish reversal?Dow Jones (US30) is reacting off the pivot and could drop to the 1st support.
Pivot: 44,527.60
1st Support: 43,330.76
1st Resistance: 46,048.47
Risk Warning:
Trading Forex and CFDs carries a high level of risk to your capital and you should only trade with money you can afford to lose. Trading Forex and CFDs may not be suitable for all investors, so please ensure that you fully understand the risks involved and seek independent advice if necessary.
Disclaimer:
The above opinions given constitute general market commentary, and do not constitute the opinion or advice of IC Markets or any form of personal or investment advice.
Any opinions, news, research, analyses, prices, other information, or links to third-party sites contained on this website are provided on an "as-is" basis, are intended only to be informative, is not an advice nor a recommendation, nor research, or a record of our trading prices, or an offer of, or solicitation for a transaction in any financial instrument and thus should not be treated as such. The information provided does not involve any specific investment objectives, financial situation and needs of any specific person who may receive it. Please be aware, that past performance is not a reliable indicator of future performance and/or results. Past Performance or Forward-looking scenarios based upon the reasonable beliefs of the third-party provider are not a guarantee of future performance. Actual results may differ materially from those anticipated in forward-looking or past performance statements. IC Markets makes no representation or warranty and assumes no liability as to the accuracy or completeness of the information provided, nor any loss arising from any investment based on a recommendation, forecast or any information supplied by any third-party.

US30/DJ30 "DOW JONES INDUSTRIAL AVERAGE" Bullish Heist Plan🌟Hi! Hola! Ola! Bonjour! Hallo!🌟
Dear Money Makers & Robbers, 🤑 💰
Based on 🔥Thief Trading style technical and fundamental analysis🔥, here is our master plan to heist the US30/DJ30 "DOW JONES INDUSTRIAL AVERAGE" Indices market. Please adhere to the strategy I've outlined in the chart, which emphasizes long entry. Our aim is the high-risk Red Zone. Risky level, overbought market, consolidation, trend reversal, trap at the level where traders and bearish robbers are stronger. Be wealthy and safe trade.💪🏆🎉
Entry 📈 : You can enter a Bull trade at any point,
however I advise placing Buy limit orders within a 15 or 30 minute timeframe. Entry from the most recent or closest low or high level should be in retest.
Stop Loss 🛑: Using the 3h period, the recent / nearest low or high level.
Goal 🎯: 44600.0 (or) escape Before the Target.
Scalpers, take note 👀 : only scalp on the Long side. If you have a lot of money, you can go straight away; if not, you can join swing traders and carry out the robbery plan. Use trailing SL to safeguard your money 💰.
Warning⚠️ : Our heist strategy is incompatible with Fundamental Analysis news 📰 🗞️. We'll wreck our plan by smashing the Stop Loss 🚫🚏. Avoid entering the market right after the news release.
Fundamental Outlook 📰🗞️
The US30/DJ30, also known as the Dow Jones Industrial Average (DJIA), is a stock market index that represents the 30 largest and most widely traded companies in the US. The index is a widely followed benchmark for the overall health of the US stock market.
CURRENT MARKET SENTIMENT:
The current market sentiment for the US30/DJ30 is bullish, with the index trading near its all-time highs. The US economy is strong, with low unemployment and steady GDP growth. However, there are concerns about the impact of trade tensions and rising interest rates on the economy.
UPCOMING NEWS:
US GDP Growth Rate: The US GDP growth rate for the second quarter is expected to be released on Friday, with expectations of a 2.0% growth rate.
US Non-Farm Payrolls: The US non-farm payrolls for July are expected to be released on Friday, with expectations of 180,000 new jobs added.
US Unemployment Rate: The US unemployment rate for July is expected to be released on Friday, with expectations of a 3.6% unemployment rate.
Federal Reserve Interest Rate Decision: The Federal Reserve is expected to announce its interest rate decision on Wednesday, with expectations of a 25 basis point rate cut.
Strong US Economy:
Low unemployment rate
Steady GDP growth
Increase in consumer spending
Improvement in business confidence
Monetary Policy:
Federal Reserve adopts a dovish tone
Interest rates are cut or remain low
Increase in money supply
Stimulative monetary policy
Fiscal Policy:
Government implements expansionary fiscal policies
Increase in government spending
Tax cuts or reductions
Infrastructure investments
Earnings Growth:
Strong corporate earnings growth
Increase in revenue and profitability
Positive guidance from companies
Beat of analyst estimates
Valuations:
Attractive valuations compared to historical averages
Low price-to-earnings ratio
High dividend yield
Undervalued stocks
Technical Indicators:
MACD line crosses above the signal line
RSI (14) falls below 30 and then rises back above it
50-period Moving Average (MA) crosses above the 200-period MA
Price closes above the 50-period MA
Bullish chart patterns, such as a head and shoulders or a inverse head and shoulders
Sentiment Analysis:
Bullish sentiment among traders and investors
Increase in long positions
Decrease in short positions
Put-call ratio falls below 1.0
Please note that this is a general analysis and not personalized investment advice. It's essential to consider your own risk tolerance and market analysis before making any investment decisions.
Take advantage of the target and get away 🎯 Swing Traders Please reserve the half amount of money and watch for the next dynamic level or order block breakout. Once it is resolved, we can go on to the next new target in our heist plan.
Keep in mind that these factors can change rapidly, and it's essential to stay up-to-date with market developments and adjust your analysis accordingly.
💖Supporting our robbery plan will enable us to effortlessly make and steal money 💰💵 Tell your friends, Colleagues and family to follow, like, and share. Boost the strength of our robbery team. Every day in this market make money with ease by using the Thief Trading Style.🏆💪🤝❤️🎉🚀
I'll see you soon with another heist plan, so stay tuned 🫂

Heading into 78.6% Fibonacci resistance?Dow Jones (US30) is rising towards the pivot which has been identified as a pullback resistance and could reverse to the 1st support which is an overlap support.
Pivot: 44,343.65
1st Support: 43,729.99
1st Resistance: 44,765.65
Risk Warning:
Trading Forex and CFDs carries a high level of risk to your capital and you should only trade with money you can afford to lose. Trading Forex and CFDs may not be suitable for all investors, so please ensure that you fully understand the risks involved and seek independent advice if necessary.
Disclaimer:
The above opinions given constitute general market commentary, and do not constitute the opinion or advice of IC Markets or any form of personal or investment advice.
Any opinions, news, research, analyses, prices, other information, or links to third-party sites contained on this website are provided on an "as-is" basis, are intended only to be informative, is not an advice nor a recommendation, nor research, or a record of our trading prices, or an offer of, or solicitation for a transaction in any financial instrument and thus should not be treated as such. The information provided does not involve any specific investment objectives, financial situation and needs of any specific person who may receive it. Please be aware, that past performance is not a reliable indicator of future performance and/or results. Past Performance or Forward-looking scenarios based upon the reasonable beliefs of the third-party provider are not a guarantee of future performance. Actual results may differ materially from those anticipated in forward-looking or past performance statements. IC Markets makes no representation or warranty and assumes no liability as to the accuracy or completeness of the information provided, nor any loss arising from any investment based on a recommendation, forecast or any information supplied by any third-party.

US30_Tracement_to_43k_or_up to_44.5kso we broke an internal high,
now i see some sort of retracement could happen before going back up for the highs
the question is how much of a retracement and the macro economic landscape has a huge factor on this
or could it just cont up...

Could the Dow Jones be bullish?
Hi Dears
I think the Dow Jones will continue to move higher in the coming months and the target indicated in the image will occur when the candles can break the orange line.
You can see an order gathering area in the image that looks like it could gather buy orders and be ready to fly to the target.
Do you think this could happen?

Market Analysis: US30USD and Trump’s Presidential InaugurationMarket Analysis: US30USD and Trump’s Presidential Inauguration
Overview of US30 (Dow Jones Industrial Average)
The US30USD (Dow Jones Industrial Average) represents 30 of the largest and most influential companies in the United States. Its performance is often used as a barometer for the overall health of the US economy and investor sentiment.
Key Reasons Why US30 May Rally Today
1. Trump’s Inauguration and Pro-Business Policies:
• With Trump being inaugurated as president, market participants are anticipating a renewed focus on pro-business and growth-oriented policies.
• Historically, Trump’s presidency has been associated with corporate tax cuts, deregulation, and infrastructure spending, all of which boosted the markets during his first term. Investors are pricing in similar expectations.
2. Market Optimism and Speculative Rally:
• Political transitions often spark short-term speculative moves, especially when aligned with positive sentiment regarding economic growth.
• Increased investor confidence in the potential for fiscal stimulus and business-friendly legislation is likely driving buying pressure on the US30.
3. Technical Breakout on the Chart:
• The US30USD recently broke above a key descending trendline, signaling a shift from bearish to bullish momentum.
• The index has also formed a higher low pattern, suggesting buyers are stepping in at stronger levels, creating upward momentum.
4. Increased Volatility and Volume:
• The chart shows rising trading volume, which typically confirms stronger price movements.
• The Stochastic Oscillator indicates the market is approaching neutral or oversold levels, suggesting room for further upward movement without hitting overbought territory.
5. Sector-Specific Gains:
• Key sectors like financials, industrials, and technology are likely to benefit from anticipated pro-business policies, driving gains in major components of the US30.
Potential Upside Targets
• Immediate Resistance: 43,750
• If this level is broken, the next target will be 44,000, which aligns with previous resistance zones.
• Support Levels:
• Strong support is located at 43,400, providing a safety net for any minor pullbacks.
Risks to Watch
• Unexpected Announcements: Any policy announcements deviating from pro-business expectations could temper gains.
• Global Factors: Macroeconomic risks, such as geopolitical tensions or unexpected Federal Reserve actions, could impact market sentiment.
Conclusion
The US30USD is positioned for an upward move today, supported by technical bullish signals, increased optimism around Trump’s pro-business policies, and market momentum. Investors and traders should monitor key resistance and support levels closely while leveraging today’s rally for potential short-term gains.

Bearish reversal off overlap resistance?Dow Jones (US30) is reacting off the pivot which has been identified as an overlap resistance that aligns with the 50% Fibonacci retracement and could drop to the pullback support.
Pivot: 43,330.76
1st Support: 41,777.16
1st Resistance: 44,327.75
Risk Warning:
Trading Forex and CFDs carries a high level of risk to your capital and you should only trade with money you can afford to lose. Trading Forex and CFDs may not be suitable for all investors, so please ensure that you fully understand the risks involved and seek independent advice if necessary.
Disclaimer:
The above opinions given constitute general market commentary, and do not constitute the opinion or advice of IC Markets or any form of personal or investment advice.
Any opinions, news, research, analyses, prices, other information, or links to third-party sites contained on this website are provided on an "as-is" basis, are intended only to be informative, is not an advice nor a recommendation, nor research, or a record of our trading prices, or an offer of, or solicitation for a transaction in any financial instrument and thus should not be treated as such. The information provided does not involve any specific investment objectives, financial situation and needs of any specific person who may receive it. Please be aware, that past performance is not a reliable indicator of future performance and/or results. Past Performance or Forward-looking scenarios based upon the reasonable beliefs of the third-party provider are not a guarantee of future performance. Actual results may differ materially from those anticipated in forward-looking or past performance statements. IC Markets makes no representation or warranty and assumes no liability as to the accuracy or completeness of the information provided, nor any loss arising from any investment based on a recommendation, forecast or any information supplied by any third-party.
